Panic Selling To Panic Buying In One Week


In this 12-10-21 issue of “Panic Selling To Panic Buying In One Week?”
- Panic Selling Turns To Panic Buying
- Market Gets A Breadth Mint
- Minsky’s View On Stability
- Portfolio Positioning
- Sector & Market Analysis
- 401k Plan Manager
Follow Us On: Twitter, Facebook, Linked-In, Sound Cloud, Seeking Alpha
Is It Time To Get Help With Your Investing Strategy?
Whether it is complete financial, insurance, and estate planning, to a risk-managed portfolio management strategy to grow and protect your savings, whatever your needs are, we are here to help.
Schedule your “FREE” portfolio review today.

From Panic Selling To Panic Buying
While the media is trying to pin headlines on the current bout of panic selling from the Fed to the Omicron variant, the reality is that we are in the midst of mutual fund distribution season.
We believe the rotation is not a sudden change in mindset but, likely the actions of mutual funds rebalancing their portfolios. Frequently at year-end mutual funds sell the winners which have become overweight positions and buy the losers which are below their proper weights. The large returns this year in certain sectors are making these actions more visible than normal.“
Notably, while the previous week was marked by panic selling, with stocks like DocuSign (DOCU) dropping 40% in a single session, this week was the exact opposite. Starting on Monday, there was almost a palpable “panic” to buy stocks.
Did anything fundamentally change to support the panic buying? No. If you paid attention to the headlines, the Federal Reserve has become considerably more “hawkish” in the stance. The acceleration of tapering liquidity and hiking interest rates will prove unkind to investors chasing highly overvalued securities.
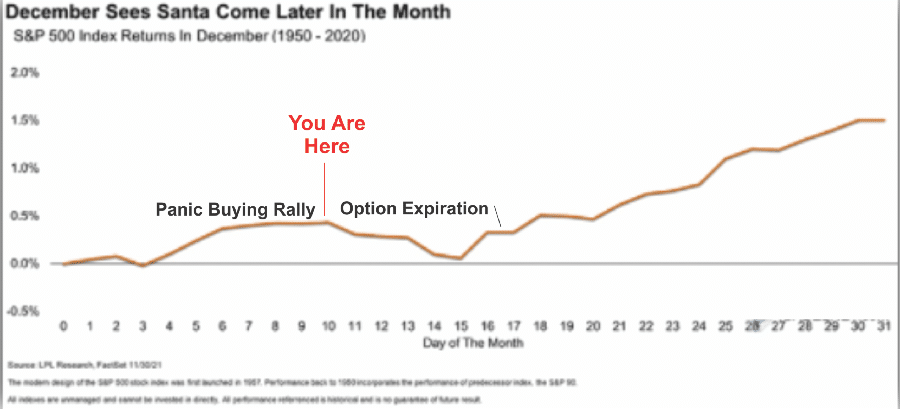
This week’s rally continues to follow the seasonality chart we discussed last week. Such also suggests that we will see some additional “sloppy” action next week heading into options expiration next Friday. However, that weakness should provide the base for the year-end rally to commence from.
After previously raising cash in November, as discussed in the portfolio update below, we used the recent panic selling to increase our exposure to equities. We will look for additional weaknesses next week to do the same.
On a longer-term basis, we remain cautious due to valuations, earnings expectations, and weaker economic growth. However, there are reasons to be more optimistic from a trading perspective in the near term.
Market Gets A Breadth Mint
I previously noted the poor breadth of the market, particularly concerning stocks trading above their respective 50- and 200-day moving averages. The panic buying rally improved that breadth moderately but remains weak relative to a market close to all-time highs.
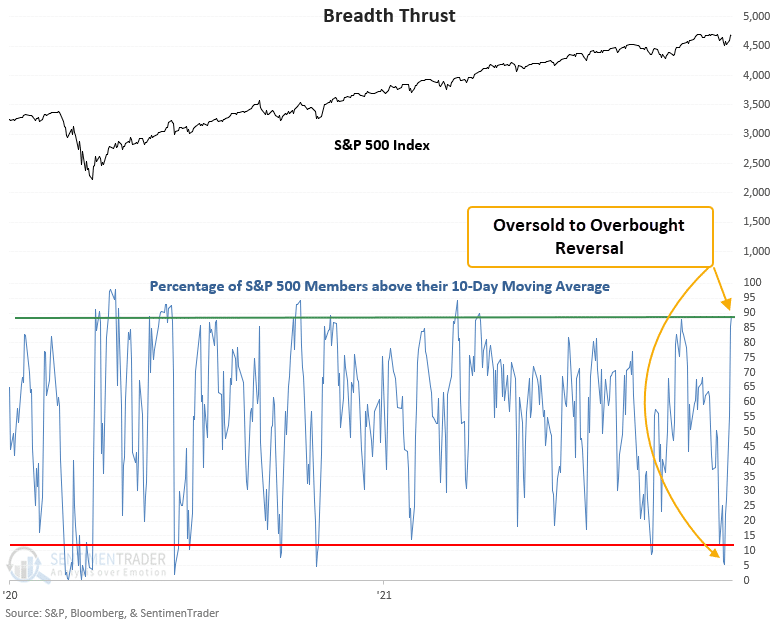
However, the breadth improvement suggests the rally has some room to run. As noted by Sentiment Trader:
The number of S&P 500 members above the 10-day moving average increased from 5% to 89% in only 5 sessions. That’s the quickest reversal since last October. This signal triggered 52 other times over the past 93 years. After the others, future returns and win rates were solid across all time frames. The 2-month time frame shows 36 out of 39 winners since 1947 and is currently riding a 15 signal winning streak. The worst drawdown in the previous 39 signals was -4%.
Such doesn’t mean that the market will continue higher unabated. It just means the bias remains higher given the improvement in breadth.
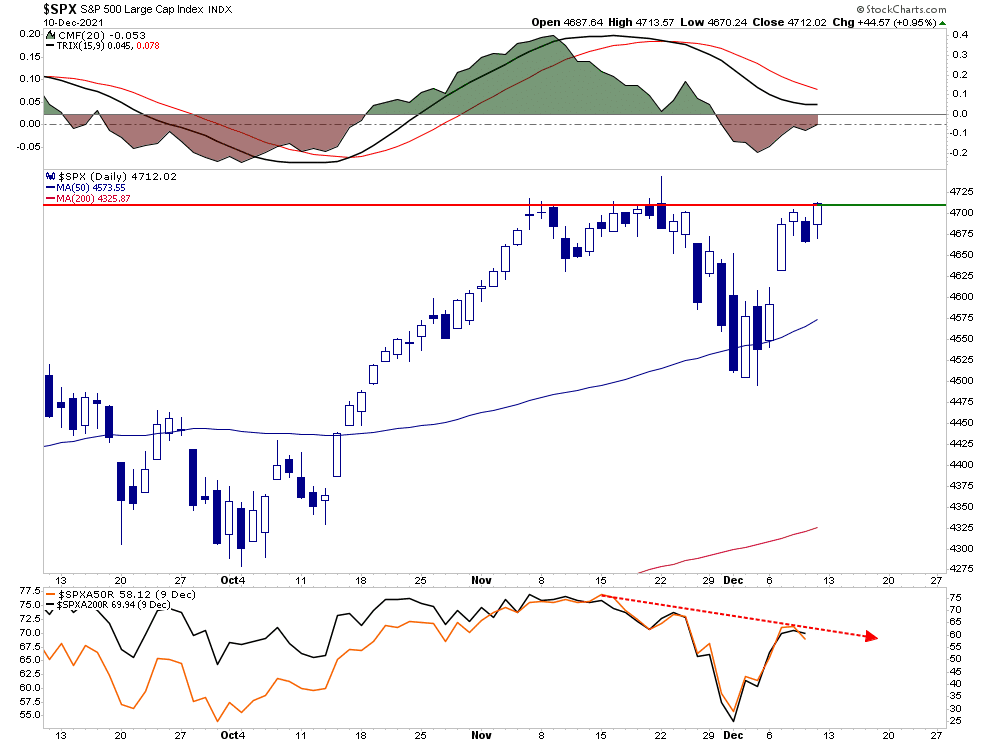
Furthermore, the collapse in the Volatility Index also bodes well for further upside as complacency returns to the market. However, the coincident volume collapse suggests the current advance remains fragile.

Again, with the market trading at near all-time high levels, the VIX is just shy of 20. Also, the market is struggling with the bottom of the trend line from the October lows. Finally, the latest bout of panic selling is still feeding through the system with a lag, so upside is possible but likely limited.
Notably, while the panic selling alleviated much of the overbought and extended market conditions, risks remain. Next week, the Fed meeting could signal faster tightening, not to mention options expiration, which could weigh on sentiment. While we are increasing exposure to equities in portfolios, we do so with very tight risk parameters.
This Week’s MacroView

Minsky’s View On Stability
The market continues to defy the odds as each retracement to the 50-dma gets bought handily. As my colleague Doug Kass noted last week:
No sooner than I write, amid pessimism in late November, about how certain areas of the market may be undervalued; the S&P Index tacks on 200 handles in a handful of trading sessions.
Stocks are now moving into integers and not fractions.
I view the new regime of volatility in both the bond and stock markets, with recent swings from despair to euphoria, experienced in the last few weeks as a forerunner to even more volatility. And, eventually, to a likely but unpredictable sequence of weaker bond and stock prices.
What Doug is alluding to is that stability eventually leads to instability.
I have written on this previously, but it is worth reviewing.
Hyman Minsky argued there is an inherent instability in financial markets. In other words, an abnormally long bullish cycle spurs an asymmetric rise in market speculation. That speculation eventually results in market instability and collapse.
We can visualize these periods of “instability” by examining the daily price swings of the S&P 500 index. Note that long periods of “stability” with regularity lead to periods of “instability.”
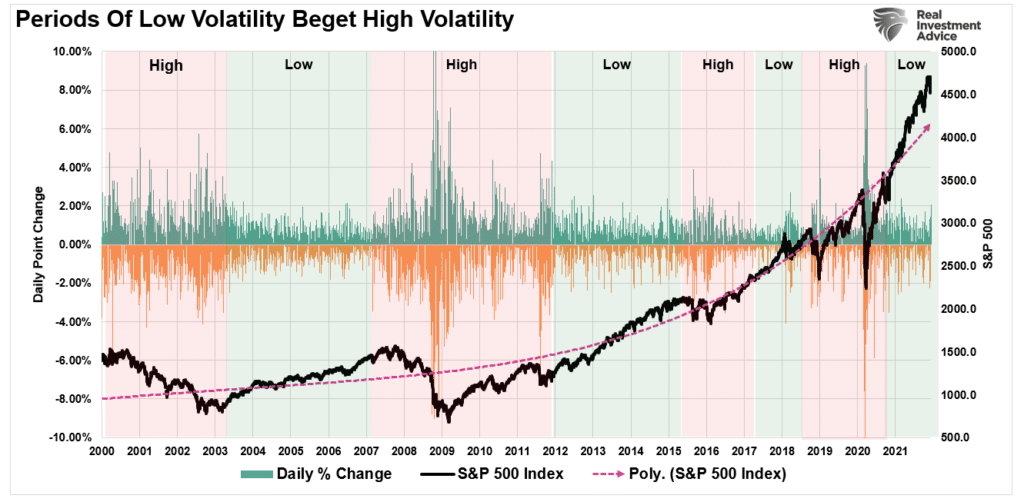
Minsky is alluding to the eventual reversal of leverage following prolonged bullish speculation. The build-up of leverage directly results from the complacency occurring from low-volatility market regimes.
Such is known as a “Minksy Moment.”
The Biggest Risk For The Fed
One way to look at “leverage,” as it relates to the financial markets, is through “margin debt,” and in particular, the level of “free cash” investors have to deploy. So, for example, in periods of “high speculation,” investors are likely to be levered (borrow money) to invest, which leaves them with “negative” cash balances.
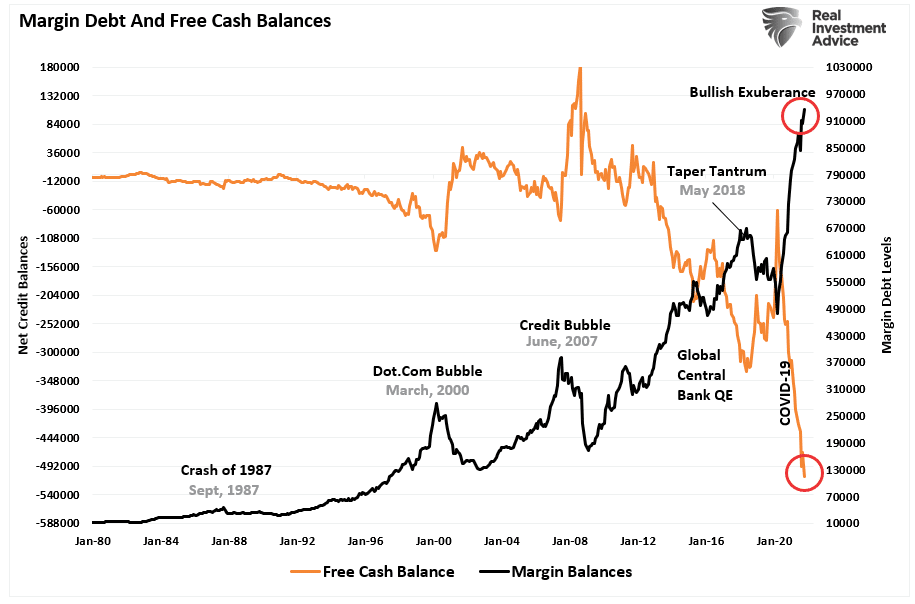
Critically, while “margin debt” provides the fuel to support the bullish speculation, it is also the accelerant for “crisis” when it occurs.
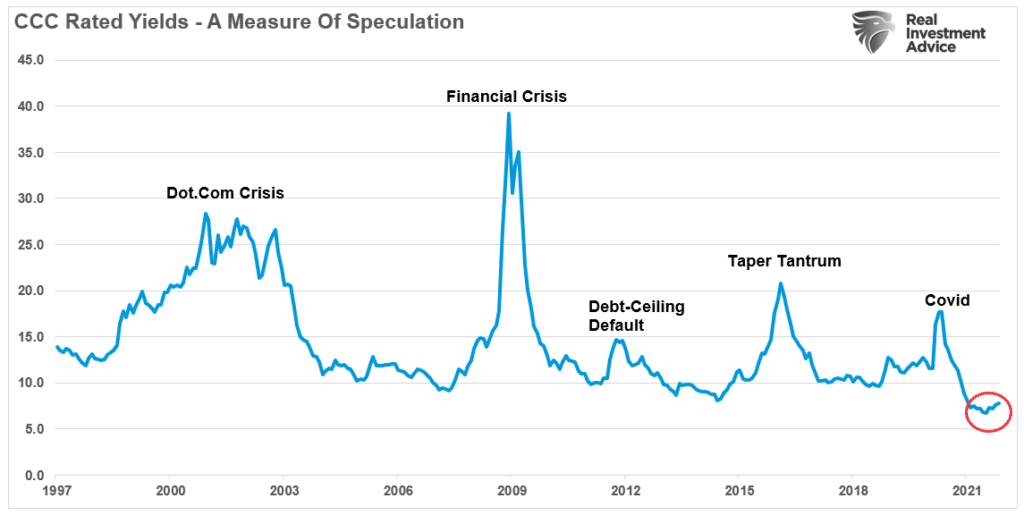
Another view is in the yield of CCC-rated bonds. These are corporate bonds just one notch above “default” and should carry very high yields to compensate for that default risk.
With the Federal Reserve set to tighten policy, such removes the support for taking on excess leverage and over-paying for valuations. With the entirety of the financial ecosystem more heavily levered than ever, the “instability of stability” is now the most significant risk for the Fed.
Unfortunately, previous rate hiking cycles have all ended badly. Every. Single. One.
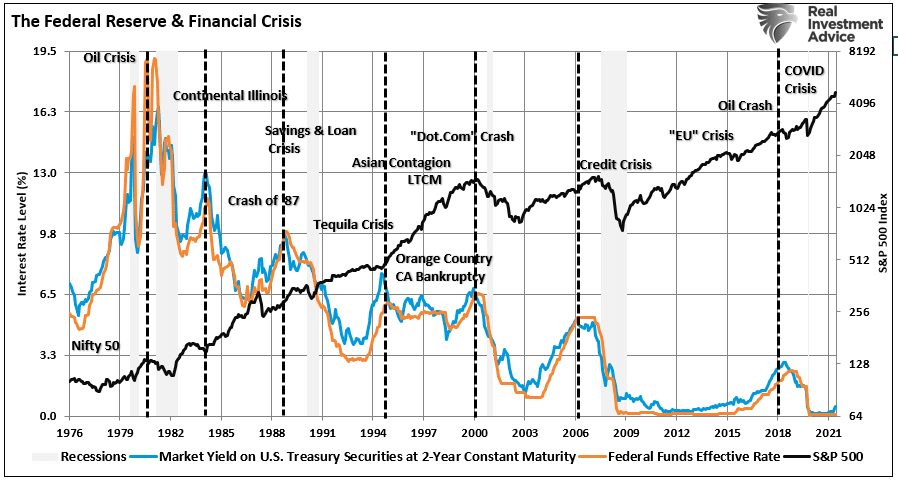
But, maybe this time will be different.
I just wouldn’t bet my retirement on it.
A Quick Word On Inflation
My colleague Mish Shedlock had a good note about Friday’s CPI report.
Consumer prices are on a tear again in November. The BLS reports a month-over-month increase of another 0.8% following a jump of 0.9% in October.
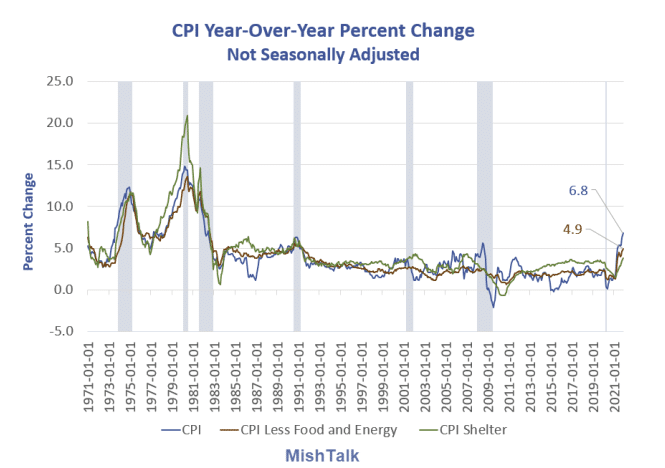
The numbers seem atrocious because they are atrocious. They are also understated.
Owners’ Equivalent Rent (OER) is the largest single item in the CPI at 24.26%. It is the mythical price one would pay to rent one’s own house from himself, unfurnished and without utilities.
Housing prices are not in the CPI nor are asset bubbles and rent is understated.
The problem with this approach is bubbles are very much a part of inflation and the Fed’s focus on “consumer” inflation is simply wrong.
He is correct. As noted previously, food and energy consumption is something American’s deal with every week. However, healthcare, mortgage, and rent payments are fixed for a contractual period. Therefore, the impact on discretionary incomes is far more insidious when adjusting for those realities.
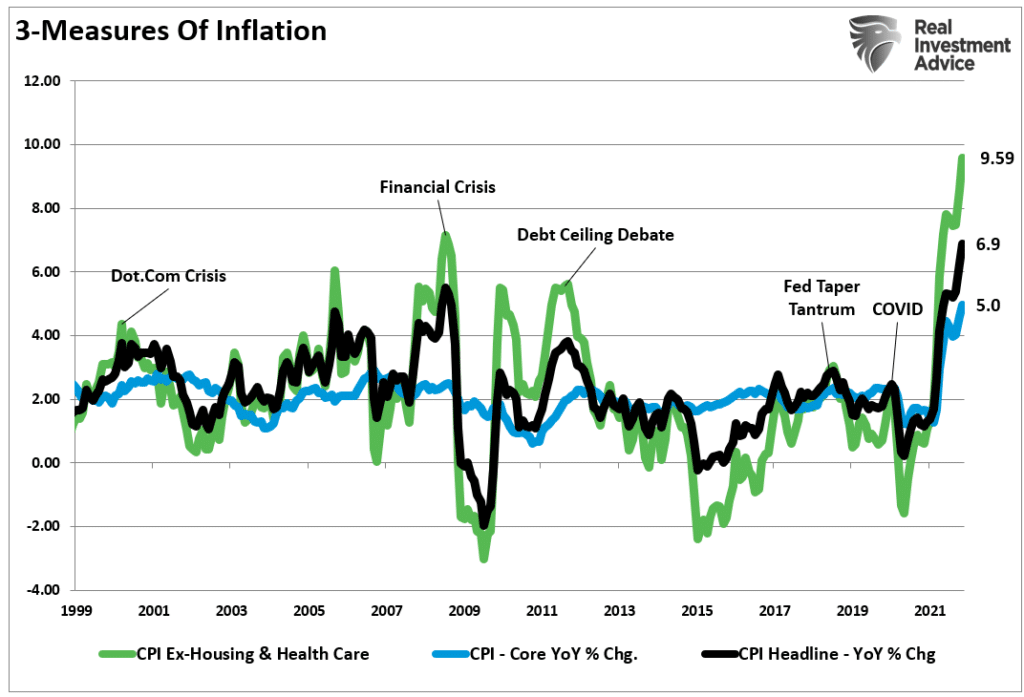
We suggested previously that we have likely seen the peak in inflationary pressures. Not surprisingly, the BEA is now going to change the weights to a 2019-2020 baseline, where consumption was suppressed, which will reduce the rate of inflation significantly.
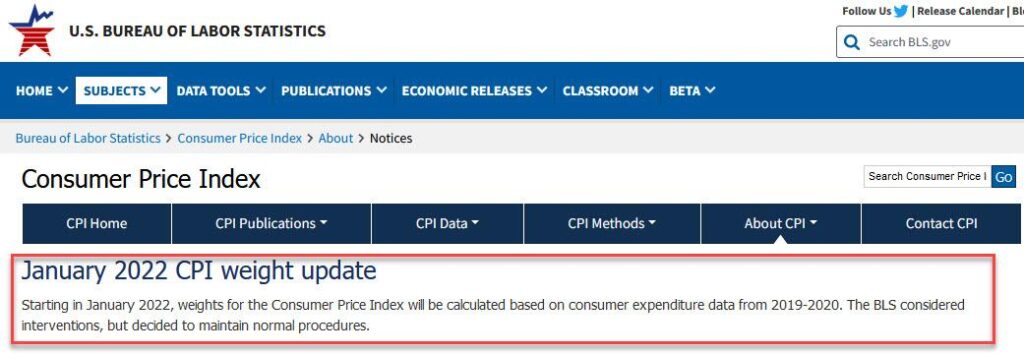
While changing the weights will suppress the headline number, it doesn’t mean higher prices won’t continue to weigh on consumers. Such is why we see weak consumer confidence reports given that wages are not keeping up with the rising inflation of daily living costs.
Heading into 2022, the risk of disappointing economic growth expectations is very high. Unfortunately, such means current earnings growth estimates are also at risk.
But this is a story for next year.

Portfolio Update
There is a significant risk to the financial markets in the longer term. However, the panic selling gave us an opportunity with the markets heading into year-end.
Over the last couple of weeks, we reiterated our previous actions to reduce risk in extremely overbought areas of our portfolio and raise cash to hedge against a correction. That correction came, and we began increasing our equity allocations back to full target levels last Friday. As noted last week:
“With that correction, we are now starting to slowly increase our equity risk exposure as we head into year-end. Given the statistical probability of a year-end ‘Santa Rally,’ we want to position portfolios for that potential opportunity.
We added a trading position in the S&P 500 index on Thursday morning and late Friday afternoon. We also nibbled on some energy exposures after the correction in oil prices.”
This past Monday, we added to our Technology positions (ones we previously took profits in) such as Nvidia (NVDA,) AMD (AMD), and Microsoft (MSFT.) We also added Ratheon Technologies (RTX) due to its deeply oversold condition. (We post all of our portfolio changes in real-time at RIAPRO.NET)
As noted, those additions brought our model allocation weights to target levels (60% stocks / 40% bonds and cash.)
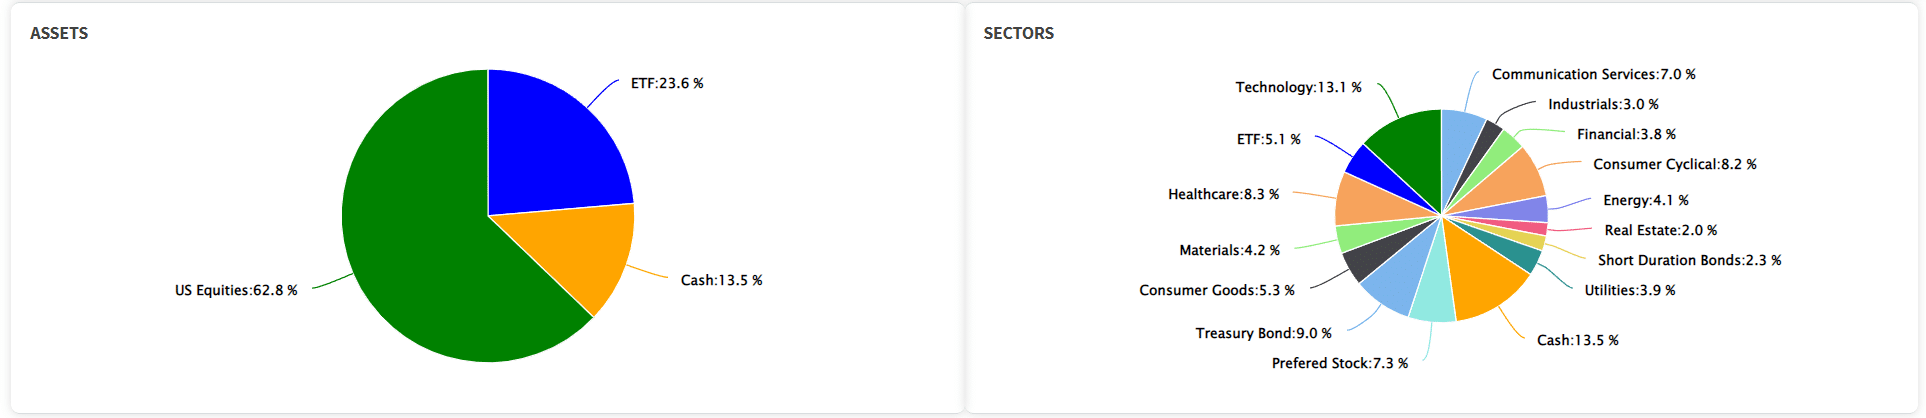
We will use any further weakness to overweight our equity holdings going into year-end. However, please make no mistake assuming we are bullish going into 2022. We maintain tight stops on all of our positions, and we use the rally to lock in profits once the market returns to overbought levels.
We remain optimistic, but we also remain well aware of the risks.

See you next week.
By Lance Roberts, CIO


