Market Struggle As “Bear-Bitten” Investors Shy Away


Inside This Week’s Bull Bear Report
- Market Struggle To Hold Support
- Will October Mark The Lows
- How We Are Trading It
- Research Report – Recession Fatigue
- Youtube – Market Recap With Adam Taggert
- Stock Of The Week
- Daily Commentary Bits
- Market Statistics
- Stock Screens
- Portfolio Trades This Week
Market Struggle To Hold Support
Last week, we discussed the market was testing a critical support level that separates bull markets from bear markets. To wit:
“Notably, the market continues to flirt with support at the 200-week moving average, which has defined the ‘bullish trend’ since the financial crisis lows. In other words, despite the ‘correction’ from this year’s highs, the ongoing bull market remains intact. However, a ‘confirmed break,’ which will be a close, retest, and failure of that bullish trend, will constitute a bear market.”
I updated that chart to include the 50-week moving average and recessions. The importance of these additional measures shows that in all previous bear markets and recessions, the 50-WMA crossed below the 200-WMA. That cross also coincided with a price break below the 200-WMA.
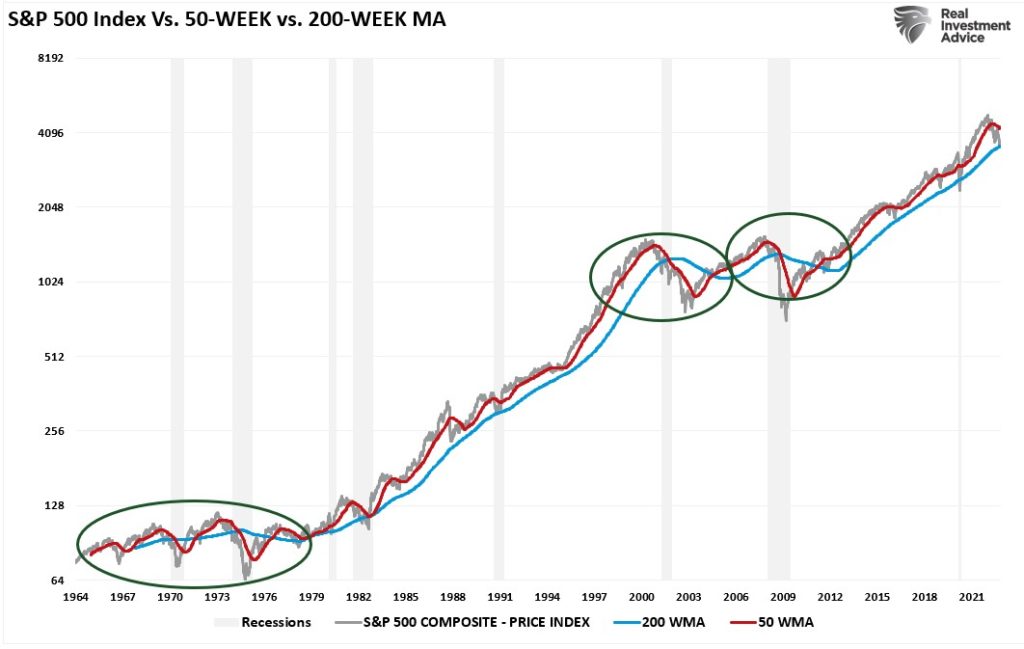
Notably, while the market held that critical support level this past week, there was also no progress on the anticipated reflexive rally. Such is because investors have now become “bear bitten” and are unwilling to “buy the dip.”
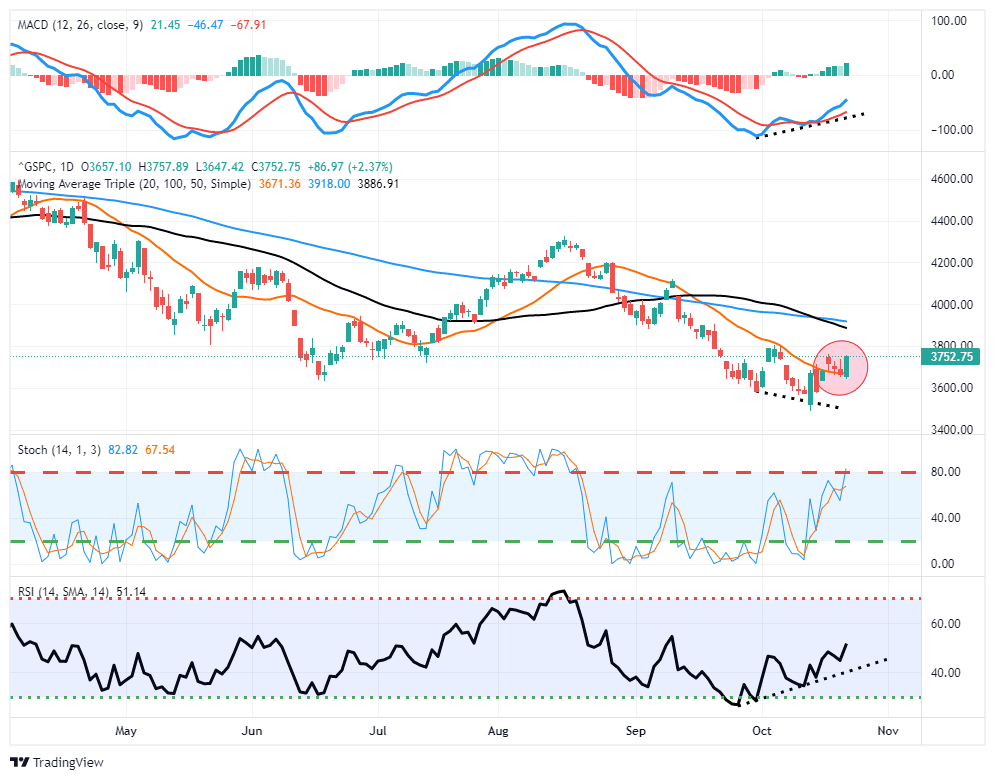
This past week was another disappointing week in terms of market action. However, there were some positive developments short-term. The market bounced off the 20-dma, turning that previous resistance level into support. That bounce came on rumors from the “Fed Whisperer,” Nick Timaros of the WSJ, the Fed may be considering slowing the pace of rate hikes in December. Such was a welcome relief for the beaten-up bulls, and stocks rallied sharply to close the week.
It will be necessary for the market to rally some more next week and ideally rises above 3800 to confirm another “bear market” rally is underway. Furthermore, the positive divergences of the MACD and RSI indicators also support the short-term bullish outlook.
With the technical action of the market supporting a rally, October tends to mark lows as the seasonally strong period gets underway. However, it is important not to mistake a rally from oversold conditions as a market bottom. There are still a tremendous number of headwinds that suggest we won’t see the final market lows until next year.
However, we will worry about that when we get there. Let’s just enjoy the break from the recent market struggle.
Need Help With Your Investing Strategy?
Are you looking for complete financial, insurance, and estate planning? Need a risk-managed portfolio management strategy to grow and protect your savings? Whatever your needs are, we are here to help.

Will October End The Market Struggle
October started strong and slid to new lows, which was undoubtedly discouraging. However, as noted above, the market struggle may be temporarily abating. The question is whether October will mark the end of the market’s struggle and whether buyers will return.
The honest answer is no one knows for sure. However, as Yahoo Finance recently noted, October tends to mark the end of bear markets more often than not.
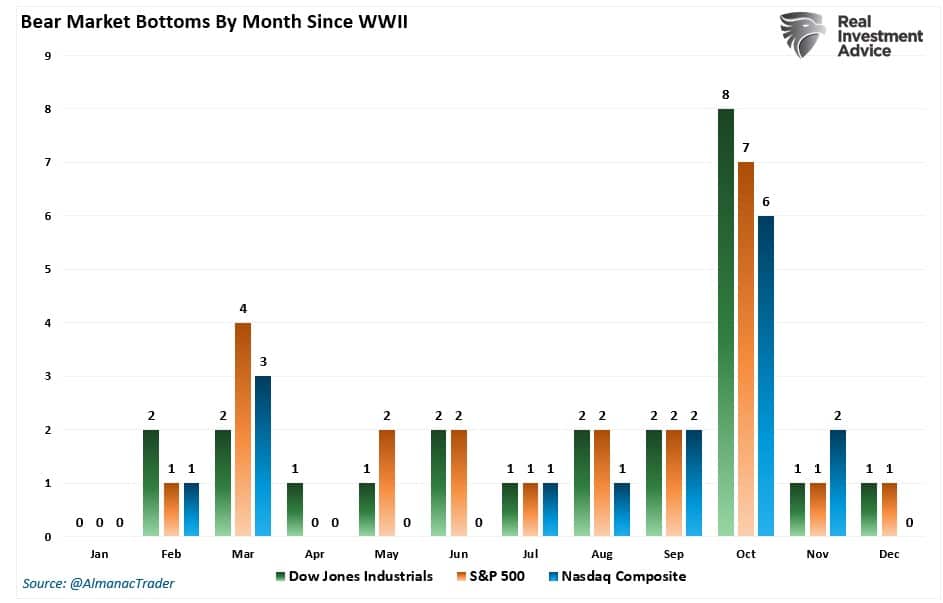
As Stock Trader’s Almanac’s Jeffrey Hirsch noted:
“Not all indices have bottomed on the same day for all bear markets, but the lion’s share, or bear’s share I should say, bottomed in October.”
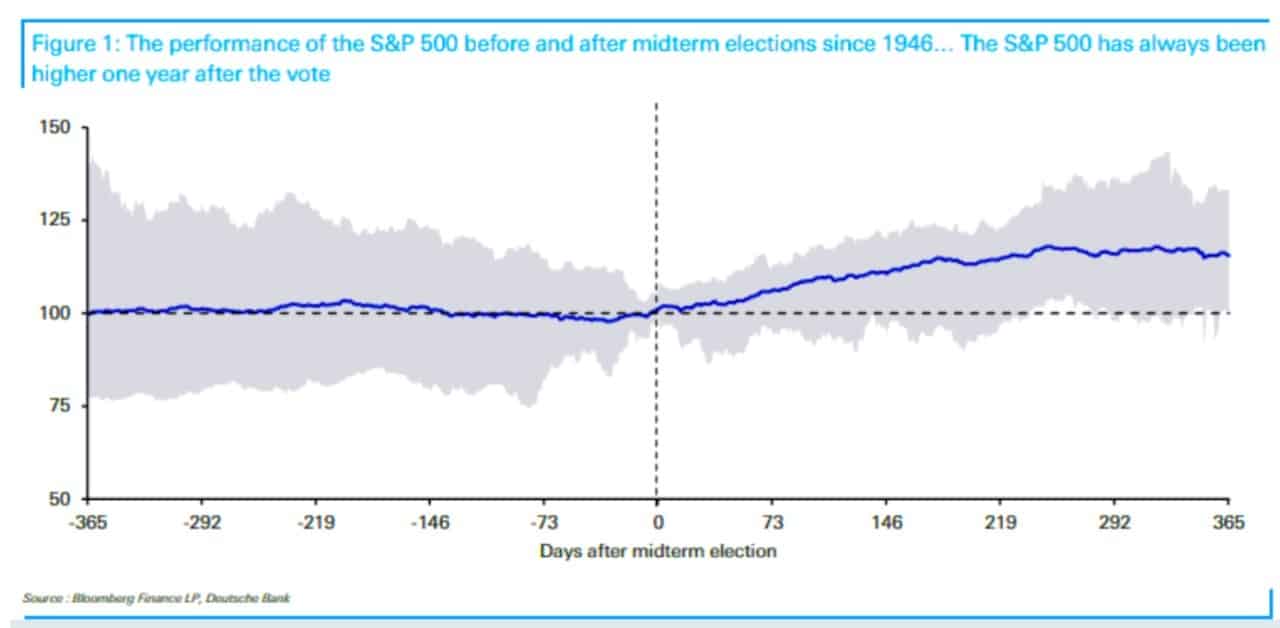
October market lows have also occurred regularly before a midterm election, such as in 2022. As Deutsche Bank recently observed:
“The S&P 500 has risen in the year after every single one of the 19 midterm elections since World War II, with not a single instance seeing a negative return.”
However, while there is undoubtedly historical precedent to suggest October market lows may be in, it is crucial to remember there are “no sure things” in the financial markets.
“History is a great guide, but it’s not gospel.” – Sam Stovall
As noted last week, there are many reasons to believe the market’s struggles may not be at an end. Most notably, many factors are currently missing that coincided with each previous bear market cycle.
- Surging unemployment
- Recession
- Bankruptcies
- Defaults
- Fed cutting rates
- Falling 2-year and 10-year Treasury yields
- Un-inversion of the yield curve.
- Spiking credit spreads
Further to this point, BofA recently published a checklist of “signposts” that previously signaled bear market lows. Currently, only 2 of the 10-signposts are registered.
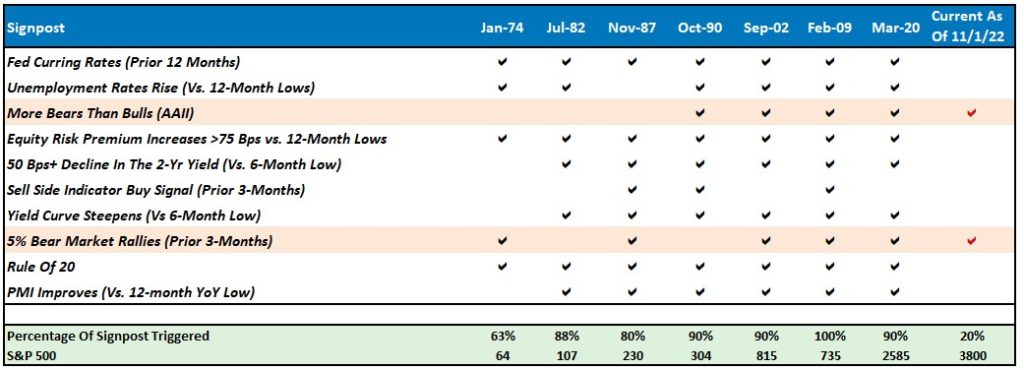
While the market could likely rally from the recent October market lows, it will probably not mark the bear market’s end just yet. As BofA noted this past week, we are only part-way through the complete economic downturn cycle.
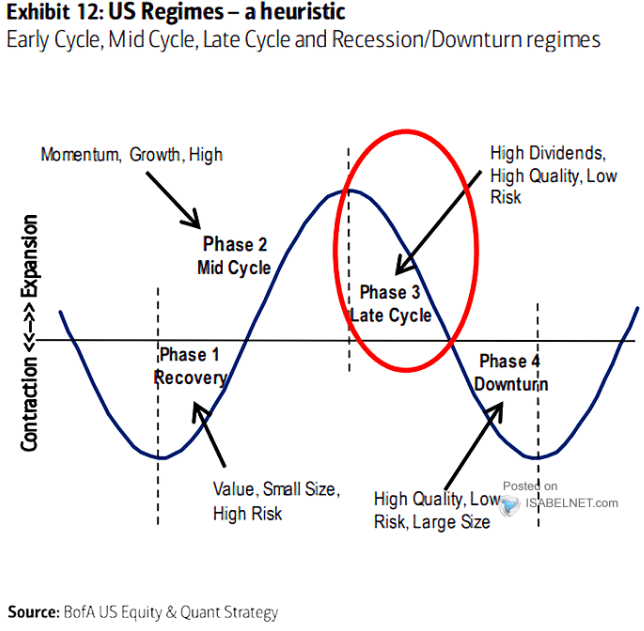
Given the economic downturn and earnings recession phase, the market bottom will not occur until 2023.
The 2023 Market Bottom
As we move into 2023, the markets will have much with which to contend. With valuations still elevated by many measures, earnings are weakening, and profit margins under pressure from inflation, a repricing risk of equities remains. Investors should remain cautious until the economy shows signs of sustained improvement.
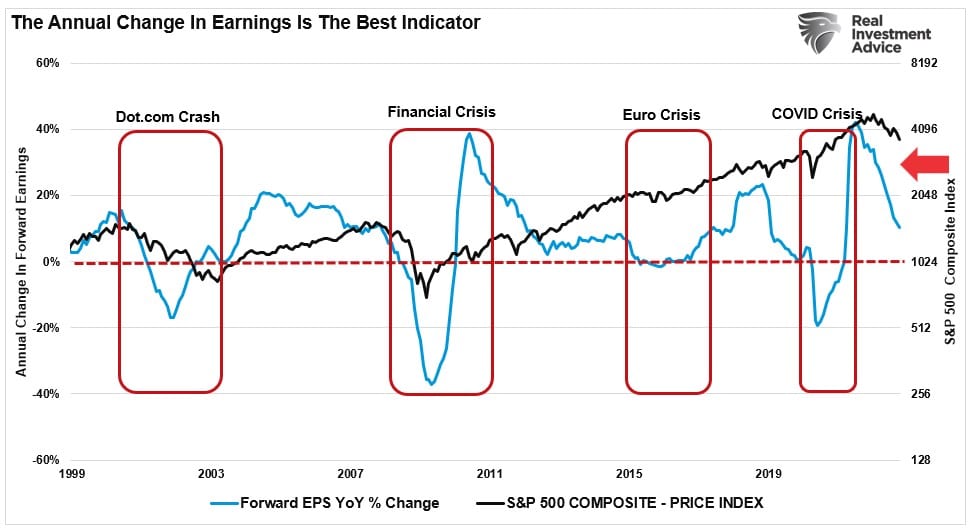
Notably, markets tend to bottom and recover before the economic data, which is why it tends to be a leading indicator of economic activity. However, the risk to investors in 2023 is an economic recession, which is most likely not accounted for currently.
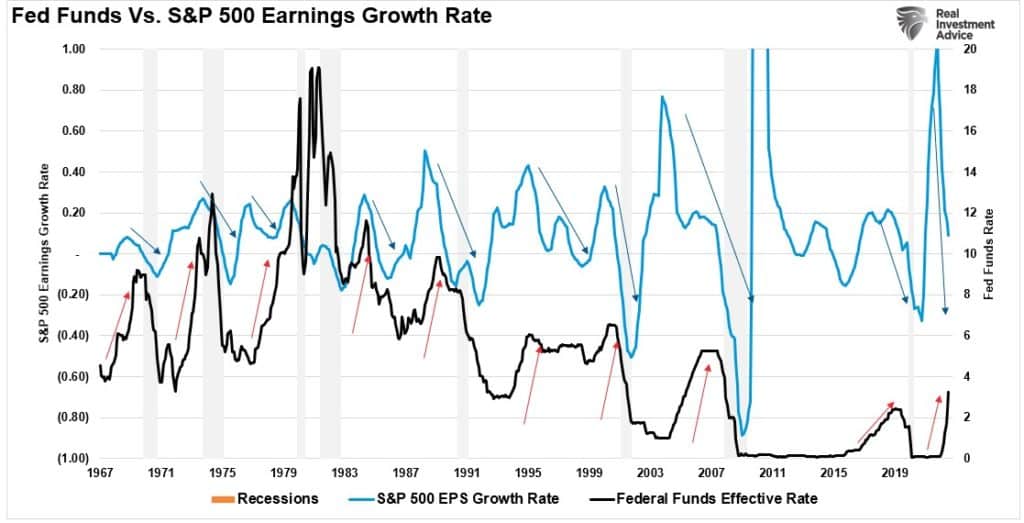
As we have noted previously, each increase in the Fed funds rate takes between 9 and 12 months to impact the economy. At the same time, the economy is already slowing, and assuming the Fed hikes to its predicted target, that 4% increase in rates has yet to impact growth. If such is the case, earnings growth will slow considerably more.
But critically, the Fed is not operating in a vacuum. Accompanying that surge in the dollar was the sharpest increase in interest rates in history. Sharp increases in interest rates, particularly in a heavily indebted economy, are problematic as debt servicing requirements and borrowing costs surge. Interest rates alone can destabilize an economy, but when combined with a surging dollar and inflation, the risks of market instability increase markedly.

We suspect that the risk of a recession in 2023 is substantially higher than most economists expect. Such is particularly the case when the lag effect of monetary policy collides with economic weakness from reduced consumer demand.
However, there is one asset that you should not overlook.
Why I Bought Call Options On TLT
This past week, I bought long-dated out-of-the-money call options on the 20-Year Treasury Bond ETF (TLT) for my personal trading account. I also bought more TLT to add to my current personal holdings.
“Buy Lance, the Fed is still hiking rates, and yields must go up.”
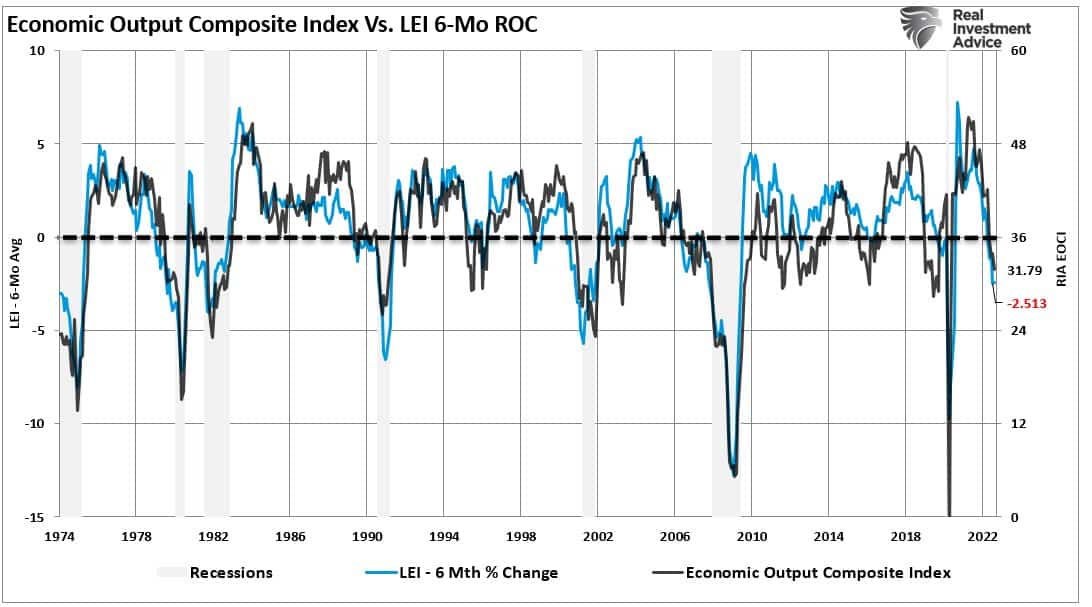
Maybe. But despite the Fed hiking rates, which control the short end of the yield curve, the economy and inflation control the long end. Everything is screaming that a recession is coming and will translate into sharply reduced inflation. Whether it is our Economic Composite Index, the Leading Economic Indicators, or the ISM Surveys, all suggest weaker growth is ahead.
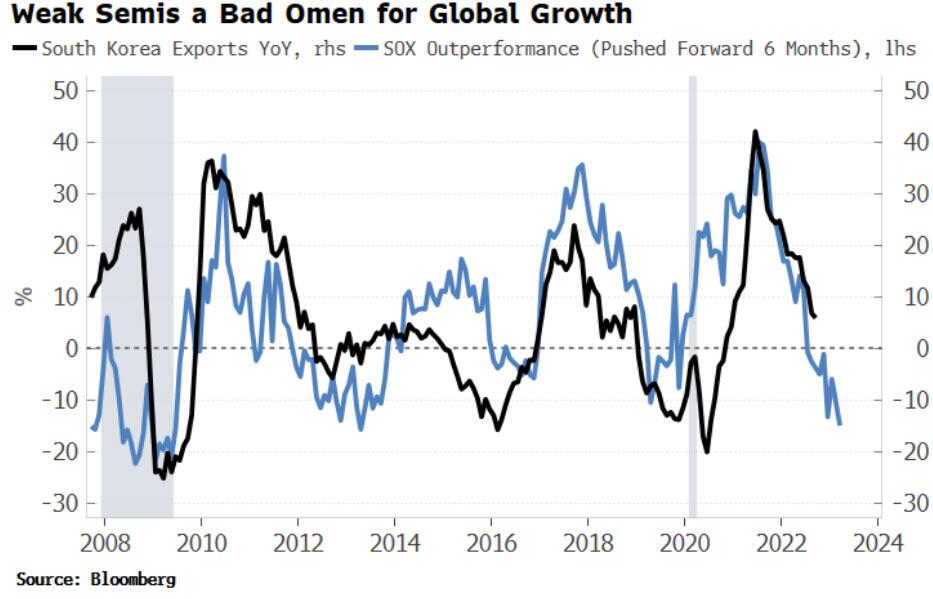
As Simon White from Bloomberg pointed out on Thursday:
“South Korean exports are one of the best leading indicators of global trade and hence growth, given it is a small, open, and trade-focused economy. At the current rate, the collapse in semis’ stock prices soon points to a relatively deep contraction in South Korean exports. The risk of global recession is also rising.“
If these data warnings remain valid, as noted above, the U.S. will be in a reasonably deep recession next year. If that comes to pass, the long-dated U.S. Treasuries are grossly mispriced.
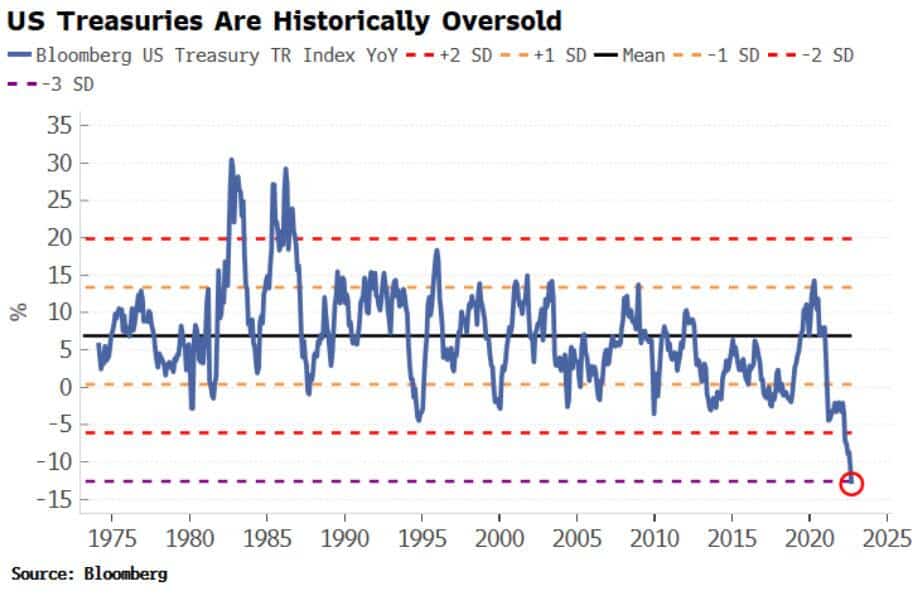
“Peak Fed hawkishness is likely here or very close. USTs are extremely oversold, and speculators are very short, while seasonals out to the end of the year are very positive.” – Simon White
If I am correct, the coming recession will spur a potentially significant haven-driven bond rally, taking especially longer-dated U.S. yields much lower. Such creates the opportunity for substantial capital appreciation by the end of next year.
That’s why we continue to own bonds.
Not Getting The Bull Bear Report Each Week In Your Mailbox? Subscribe Here For Free.
How We Are Trading It
The market struggle continues, and the lack of process weighs on investor mentality. We remain range-bound, making it tough on both bulls and bears. Many indicators suggest we are near a short-term market bottom and a reflexive rally remains likely as we move toward year-end. Notably, next week will mark the end of the “stock buyback blackout” period. Such could provide as much as $4.5 billion in a daily bid to markets as corporations return to repurchases.
We will continue to use rallies to reduce equity risk and rebalance exposures until we are sure the current bearish market cycle is complete.
However, given the market’s deeply oversold conditions, we are holding some additional equity exposure we added previously for the expected reflexive market rally. Again, as the market rallies, we will sell and reduce risk.
Also, as we move into year-end, we will be taking advantage of tax loss selling for taxable accounts to offset some of the gains we took earlier this year.
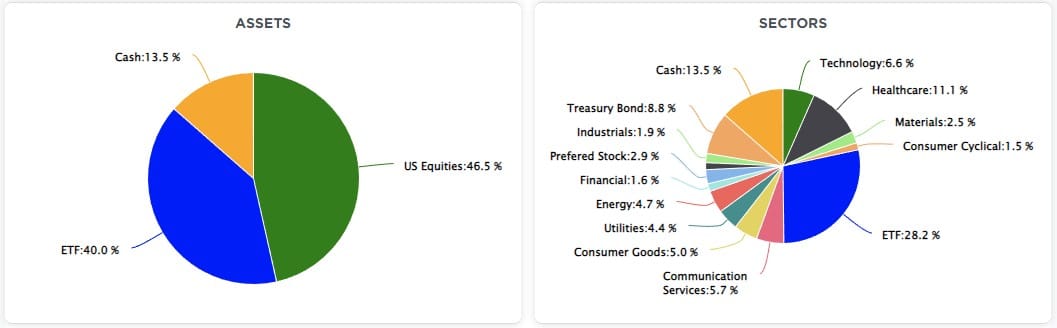
From an allocation standpoint, we remain underweight in stocks and bonds and overweight cash and short-term Treasuries. (The ETF allocation comprises short-duration Treasury bonds and floating rate Treasuries, with a lesser allocation to long-dated Treasuries. You can view our models in real-time at SimpleVisor.com)
See you next week.
Research Report

Market Recap – With Adam Taggert
Subscribe To Our Youtube Channel To Get Notified Of All Our Videos
Stock Of The Week In Review
Using The SimpleVisor Screening Tool To Find Relative Strength
This week’s scan serves two purposes. The primary purpose is to find value stocks with relative strength. Second, we use the SimpleVisor Screener tool to perform this scan and provide step-by-step instructions to help you get better acquainted with scanning for stocks using your criteria.
Here is a link to the full SimpleVisor Article For Step-By-Step Instructions.
Here is one of the stocks from the scan.
EOG Resources, Inc. (EOG)
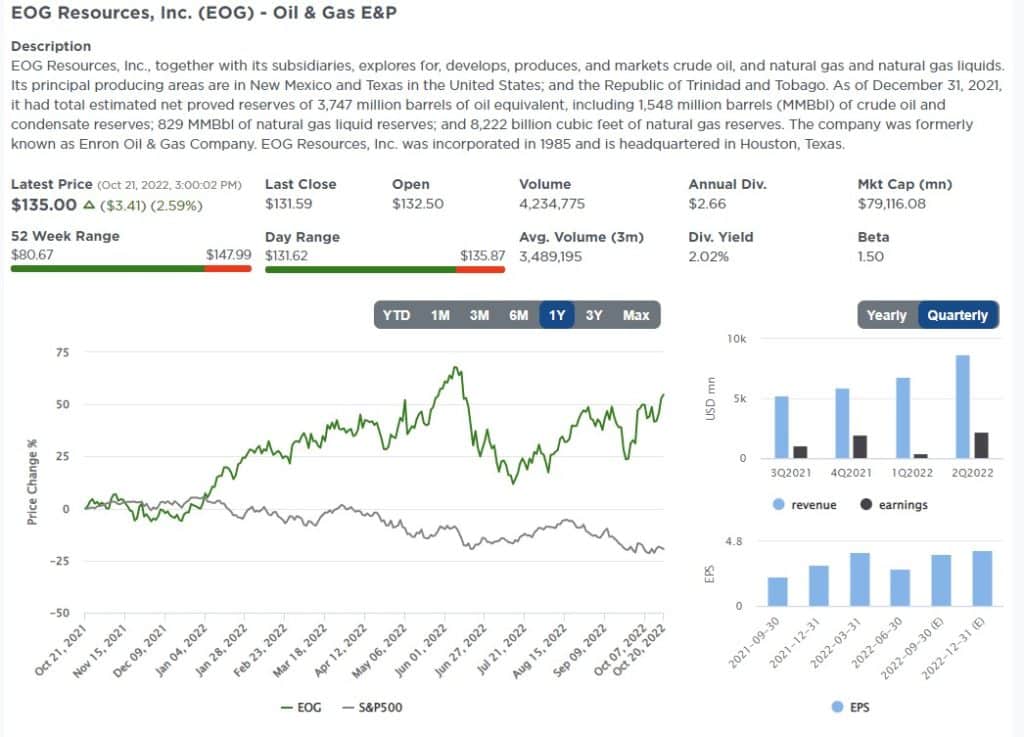
Login to Simplevisor.com to read the full 5-For-Friday report.
Daily Commentary Bits
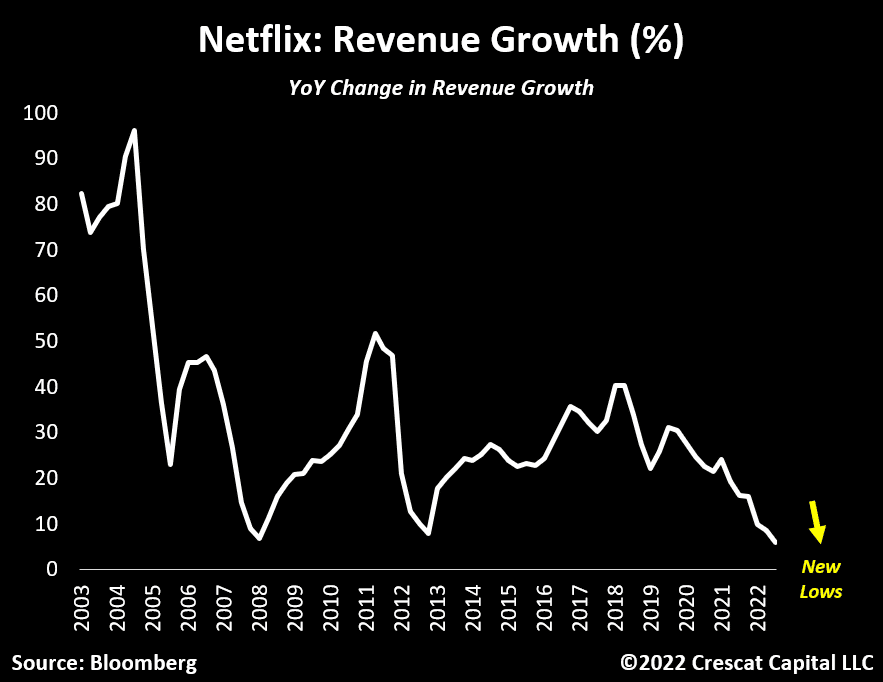
Netflix – Pay Attention To The Revenue
The latest release of the series Stranger Things helped Netflix (NFLX) achieve better-than-expected earnings and a sizeable rally. The market’s 17% after-hours surge on the earnings news resembles its hit Stranger Things. NFLX’s financials were better than expected but far from as encouraging as the price gain suggests. For growth companies like NFLX, we prefer to focus on revenue and subscriber growth. As shown below, revenue growth continues to stall, and the growth rate of paid membership is slowing rapidly. Revenues fell slightly from the prior quarter and are only up .9% over the past four quarters. Paid membership grew 4.5% over the last year, which was moderately better than expected. However, it represents a sharp slowdown from 9.4% last year. It is expected to be at 2.6% for the year in Q4.
Netflix’s earnings may be a harbinger of stranger things to come this earnings season. Many stocks are so beaten down that instances of good or better-than-expected results, even if underlying trends remain poor, might cause strong rallies. Even with NFLX’s strong stranger things rally, the stock is down almost twice as much as the S&P 500 this year.
Click Here To Read The Latest Daily Market Commentary (Subscribe For Pre-Market Email)
Bull Bear Report Market Statistics & Screens

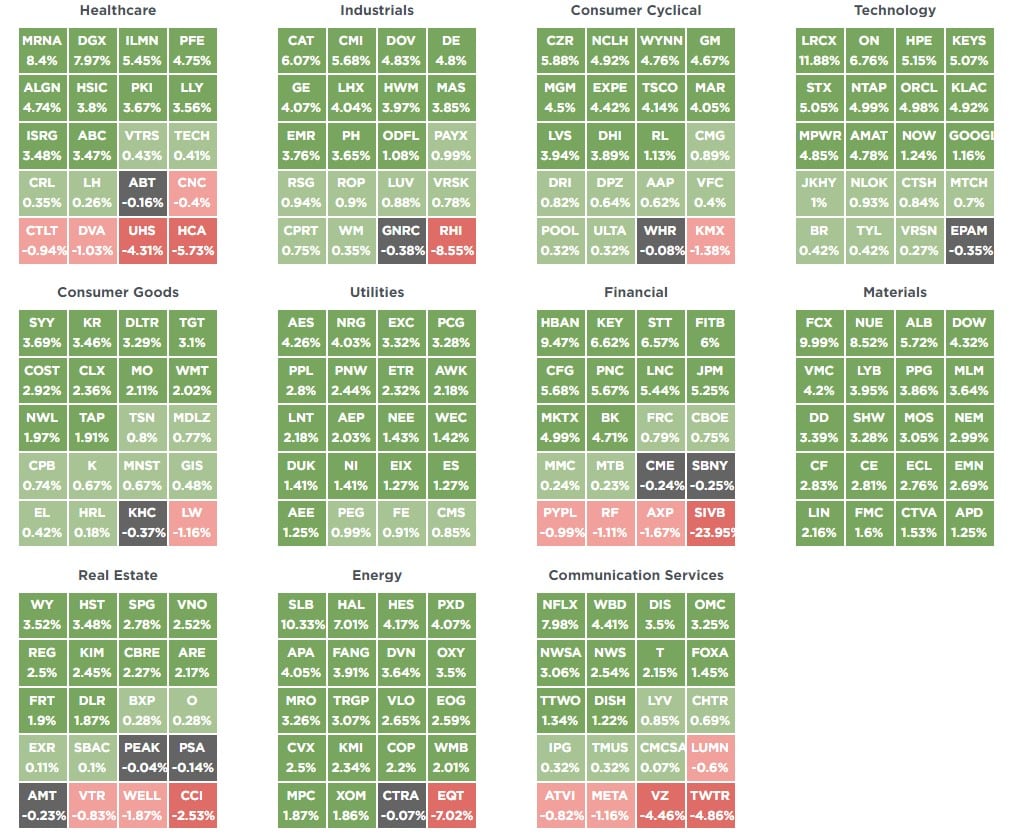
SimpleVisor Top & Bottom Performers By Sector
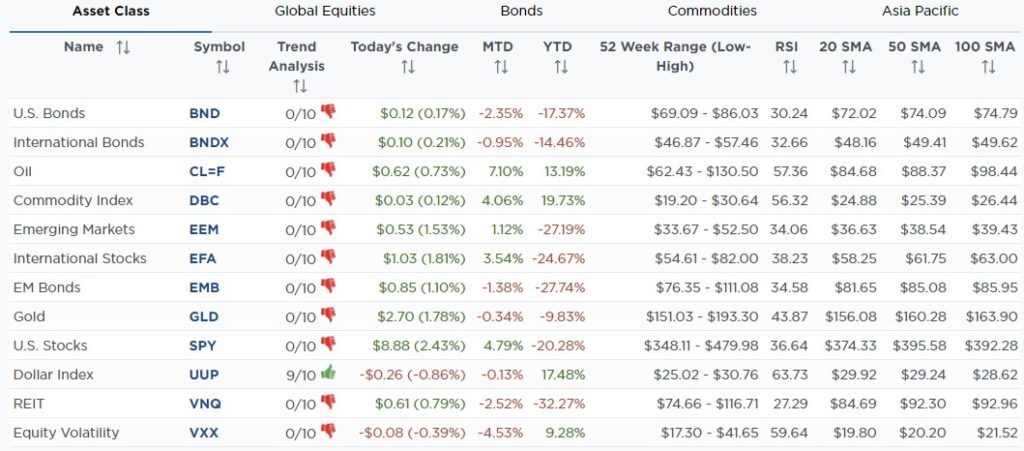
SimpleVisor Asset Class Trend Analysis
Relative Performance Analysis
While the market struggle continues, the rally on Friday pushed several sectors into more overbought territory. Bonds are extremely oversold, and Energy and Industrials are the most overbought. Look for some sector rotations next week. While there is a possibility of a further advance, we still suggest using rallies to reduce exposure accordingly.

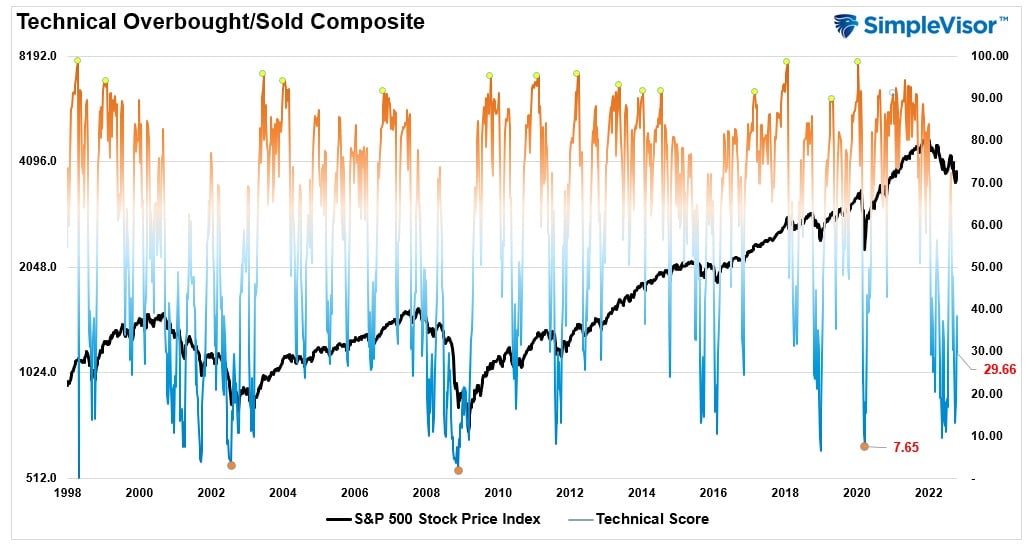
Technical Composite
The technical overbought/sold gauge comprises several price indicators (RSI, Williams %R, etc.), measured using “weekly” closing price data. Readings above “80” are considered overbought, and below “20” are oversold. Markets tend to peak when readings are at 80 or above, which suggests profit-taking and risk management are prudent. The best buying opportunities exist when readings are 20 or below.
The current reading is 29.66 out of a possible 100 and rising. Remain long equities for now.
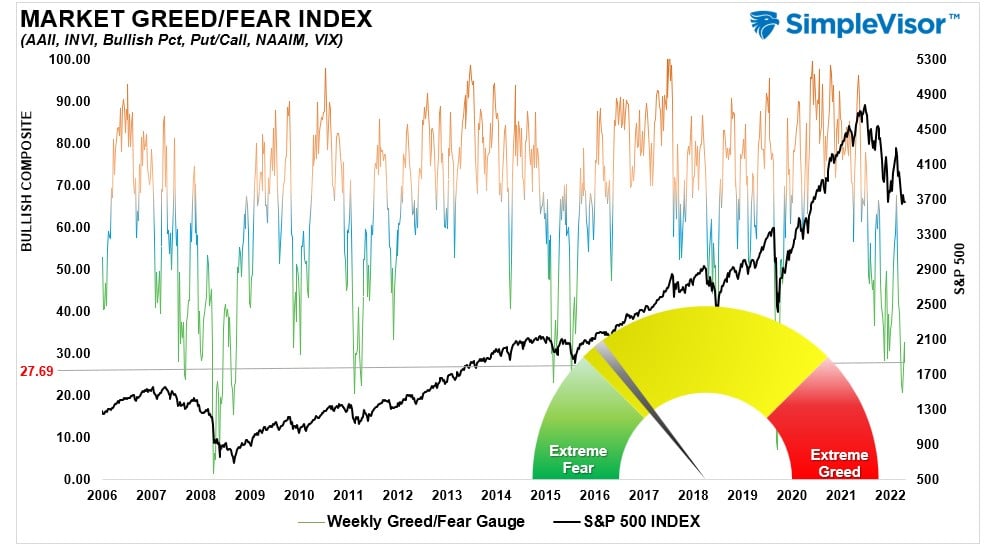
Portfolio Positioning “Fear / Greed” Gauge
The “Fear/Greed” gauge is how individual and professional investors are “positioning” themselves in the market based on their equity exposure. From a contrarian position, the higher the allocation to equities, to more likely the market is closer to a correction than not. The gauge uses weekly closing data.
NOTE: The Fear/Greed Index measures risk from 0 to 100. It is a rarity that it reaches levels above 90. The current reading is 27.69 out of a possible 100.
Sector Model Analysis & Risk Ranges
How To Read This Table
- The table compares the relative performance of each sector and market to the S&P 500 index.
- “M/A XVER” is determined by whether the short-term weekly moving average crosses positively or negatively with the long-term weekly moving average.
- The risk range is a function of the month-end closing price and the “beta” of the sector or market. (Ranges reset on the 1st of each month)
- The table shows the price deviation above and below the weekly moving averages.
Even though going into Friday’s open, the market was virtually flat for the month, the rally on Friday took a majority of sectors outside their normal risk ranges. This suggests that while we could see further upside next week, it will likely be limited. Bonds, Staples, and Real Estate continue to trade at oversold levels.

Weekly SimpleVisor Stock Screens
Each week we will provide three different stock screens generated from SimpleVisor: (RIAPro.net subscribers use your current credentials to log in.)
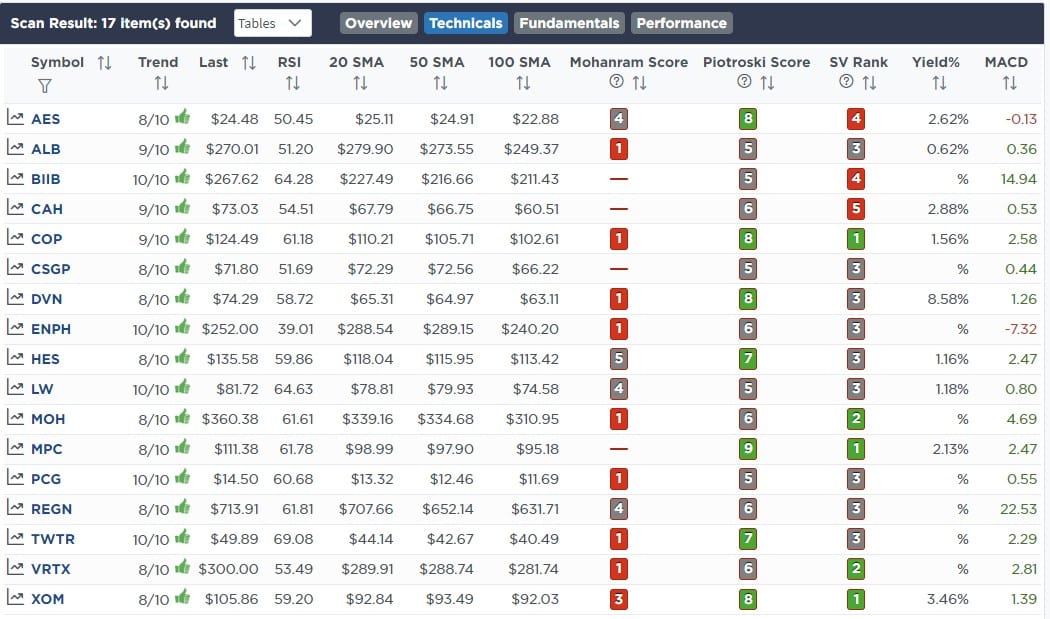
This week we are scanning for the Top 20:
- Relative Strength Stocks
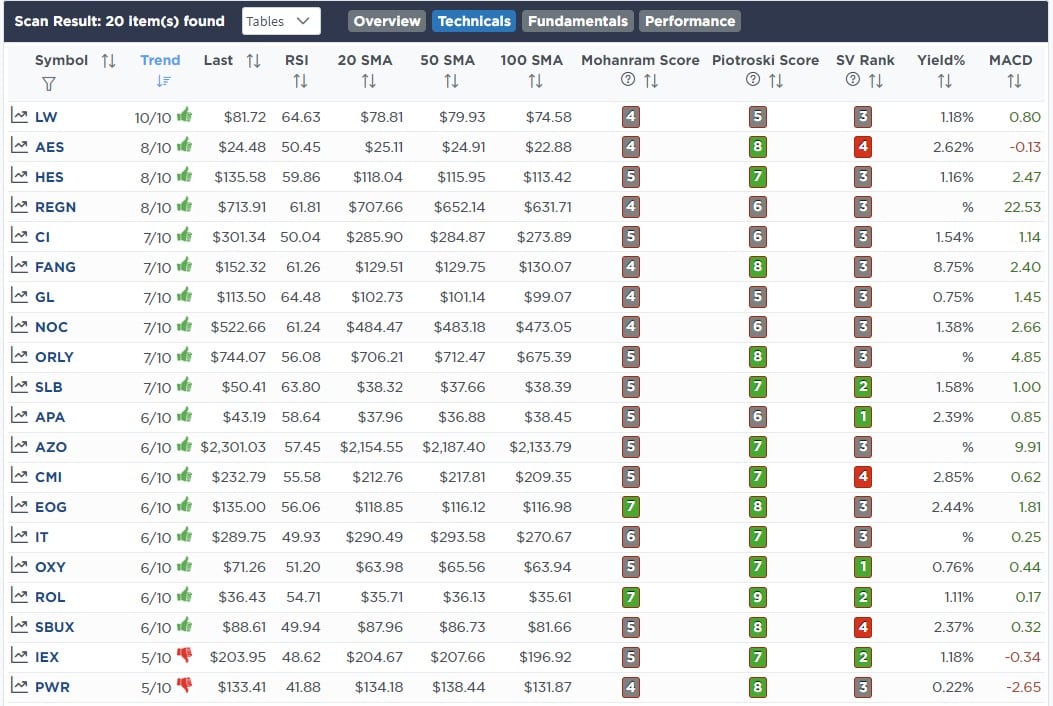
- Momentum Stocks
- Highest Rated Stocks
These screens generate portfolio ideas and serve as the starting point for further research.
(Click Images To Enlarge)
RSI Screen
Momentum Screen

Highest Rated Screen
SimpleVisor Portfolio Changes
We post all of our portfolio changes as they occur at SimpleVisor:
October 17th
When the Federal Reserve breaks something, the yield curve will UN-invert rapidly, which will bode well for financial-related stocks. While we will add some direct exposure to bank stocks, we continue to add to our holding of iShare Preferred Income ETF (PFF), which is currently carrying a dividend yield north of 5%.
Equity And ETF Models
- Increase PFF by 1% of the portfolio, bringing the total weight to 3%.
October 18th
We are adding a little exposure to the portfolios for this reflexive rally which we will reduce as we start tax loss harvesting over the next two weeks. The goal is to keep reduced exposure overall. We are absent Financial exposure in the portfolio, and with higher interest rates, the Net Interest Income to banks is much more appealing. We are adding 1.5% to Goldman Sachs (GS) and increasing the SPDR Financial ETF by 1.5%.
We are also underweight in Communications relative to the benchmark, and we will be selling Verizon (VZ) for year-end tax reasons soon. Therefore, we added 1.5% to Comcast Communications (CMCSA) and 1.5% to the SPDR Communications ETF (XLC).
Equity Model
- Initiate a 1.5% position in Goldman Sachs (G.S.)
- Initiate a 1.5% position in Comcast Communications (CMCSA)
ETF Model
- Add 1.5% to SPDR Financial ETF (XLF)
- Add 1.5% to SPDR Communications ETF (XLC)

Lance Roberts, CIO
Have a great week!


