All I Want For Christmas Is A Bull Market (Full Version) 12-25-20


In this issue of “All I Want For Christmas Is A Bull Market 2021.”
- Will Santa Claus Visit Broad & Wall
- The Grinch That Stole Christmas
- Portfolio Positioning Update
- MacroView: Yellen’s Arranged Marriage To The Fed
- Sector & Market Analysis
- 401k Plan Manager
Follow Us On: Twitter, Facebook, Linked-In, Sound Cloud, Seeking Alpha
The 2020/21 Tax Guide Is Now Available
RIA Advisors has partnered with DoerenMayhew, CPA’s, to bring you, and our clients, the best tax planning services available. Click the link to download the free tax planning guide for 2020 and 2021.

Catch Up On What You Missed Last Week

Will Santa Claus Visit Broad & Wall
Today’s newsletter will be relatively short, but I want to update our portfolio positioning with you. More importantly, I wanted to take this opportunity to wish you and your families a very Merry Christmas and share my hopes for a prosperous and safe New Year.
Over the last couple of weeks, we have discussed why we were positioning portfolios to participate in the traditional year-end “window dressing” rally. Such is also known as the “Santa Claus” rally.
As we discussed in “Will ‘Santa Claus’ Visit Broad & Wall:”
“Stock Trader’s Almanac explored why end-of-year trading has a directional tendency. The Santa Claus indicator is pretty simple. It looks at market performance over a seven day trading period – the last five trading days of the current trading year and the first two trading days of the New Year. The stats are compelling.
‘The stock market has risen 1.3% on average during the 7 trading days in question since both 1950 and 1969. Over the 7 trading days in question, stock prices have historically risen 76% of the time, which is far more than the average performance over a 7-day period.'”
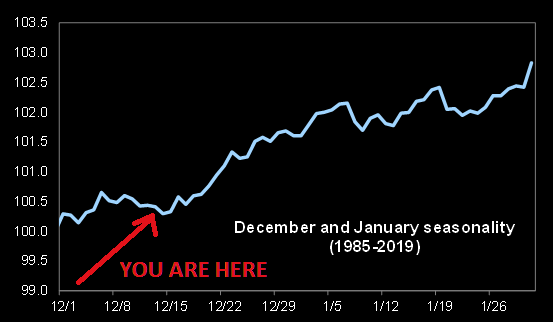
The statistics are very compelling. As Ryan Detrick noted this week:
“Whether optimism over a coming new year, holiday spending, traders on vacation, institutions squaring up their books before the holidays—or the holiday spirit—the bottom line is that bulls tend to believe in Santa Claus.”

However, it is worth noting that on more than a few occasions when “Santa visited Broad & Wall,” the bull market didn’t continue in January.

A Review Of Negative Januarys
Let’s review the years in which January failed to carry through from the “Santa Rally.”
The first two examples, 2001 and 2002, were in the midst of the “Dot.Com” crash, so that we can write those off to a bear market. The same goes for 2009.
However, 2010 is a bit different as the economy had started a recovery, earnings growth was strong, and the Federal Reserve was amid QE-1. Yet, January had a -3.7% rate of return following the “Santa Rally.” Other than the “Haiti Tsunami,” there was no other major event causing stocks to decline except “exhaustion” after a 10-month uninterrupted advance.
In 2013, January also posted a negative return. The concern of the “fiscal cliff,” as the comprise to lift the “debt ceiling,” required a bipartisan group of Congressman to find $1 Trillion in budget cuts. Their failure to find cuts triggered an automatic set of cuts across agencies. Fed Chairman Ben Bernanke launched QE3 a month before to offset the impact of the “fiscal cliff.” However, given the cuts never materialized, the Fed’s flood of liquidity caused a surge in stocks over the rest of the year.
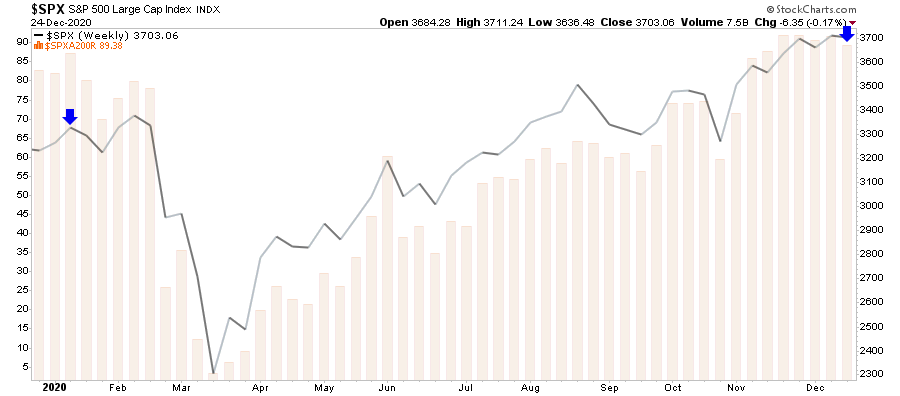
The beginning of 2020 also posted a negative January return following an incredible rally in 2019. More like 2013, the market’s extension was extreme with a near-record number of stocks above their 200-dma. The market needed to correct before continuing its advance to all-time highs in February.
January 2021 has a lot of similarities to both 2013 and 2019. With the Federal Reserve continuing QE and a near-record number of stocks above their 200-dma, and an extreme bullish bias, the risk of a correction exists. A government shutdown, stalled stimulus bill, or a surge in virus cases could do the trick.

The Grinch That Could Also Steal Christmas
As discussed in Wednesday’s “3-minutes” video, there is a potential “Grinch” that could also “Steal Christmas.”
Much of the equity rally this year has been supported by the decline in the USD. Currently, foreign inflows into U.S. equities are near a record, along with net-short positioning on the dollar. (Note previous record inflows.)
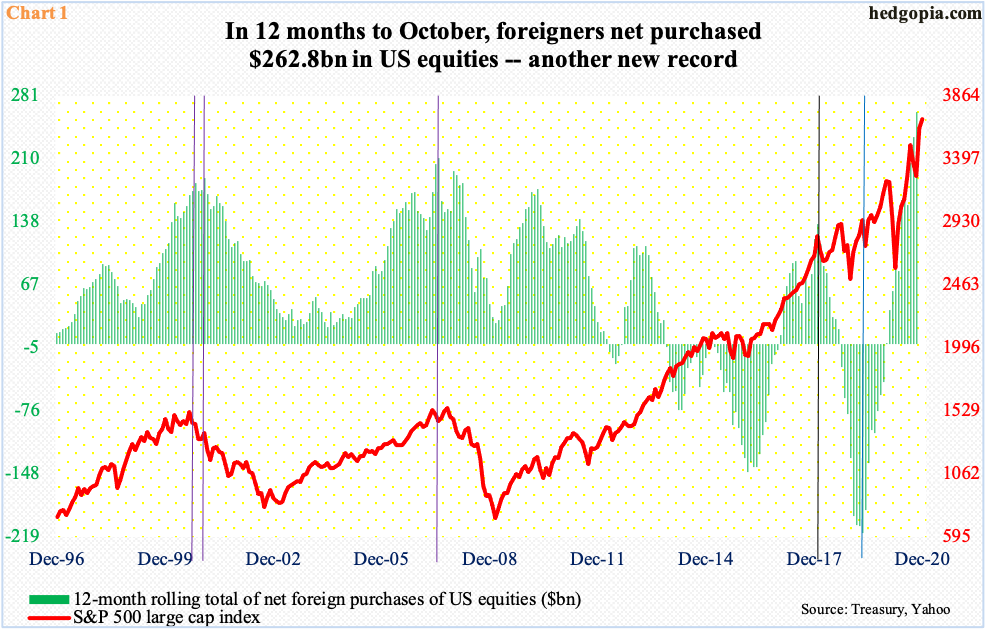
Such is the perfect environment for a sharp reversal in the dollar from deeply oversold conditions. Notably, over the last few days, we have seen a positive turn in the dollar. While still too early to definitively say a turn has occurred, this is something to watch very closely.
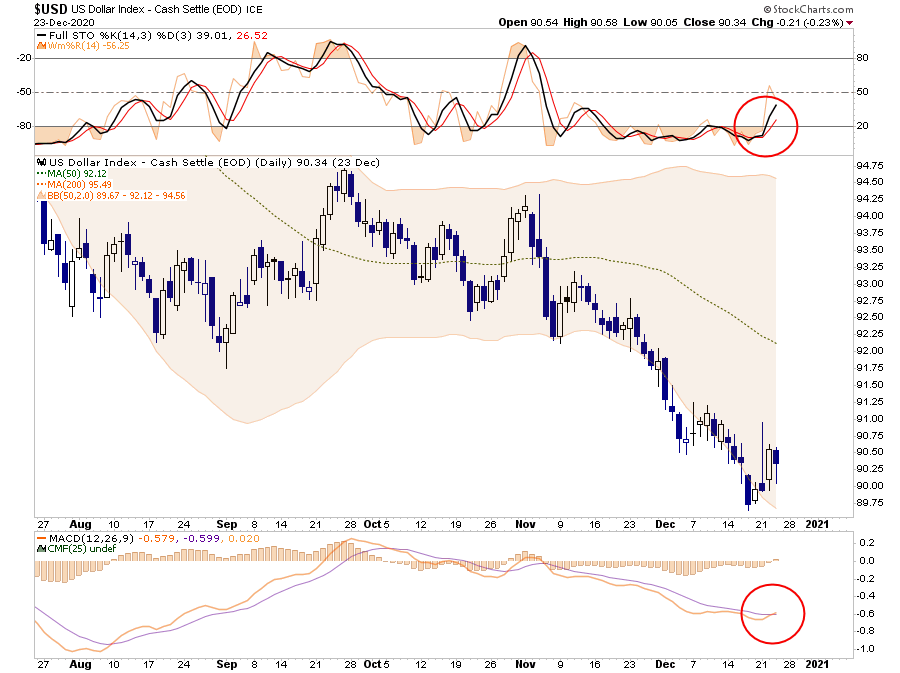
As shown below, the decline in the dollar has been a contributor to the equity rally. With money flows now turning positive, a counter-trend rally will potentially reverse the equity bid.
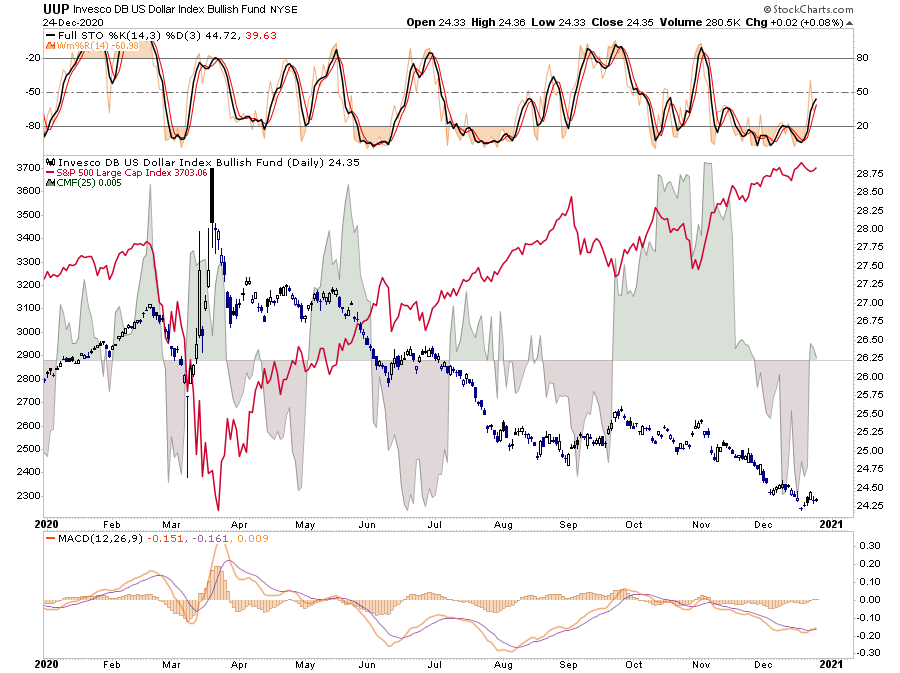
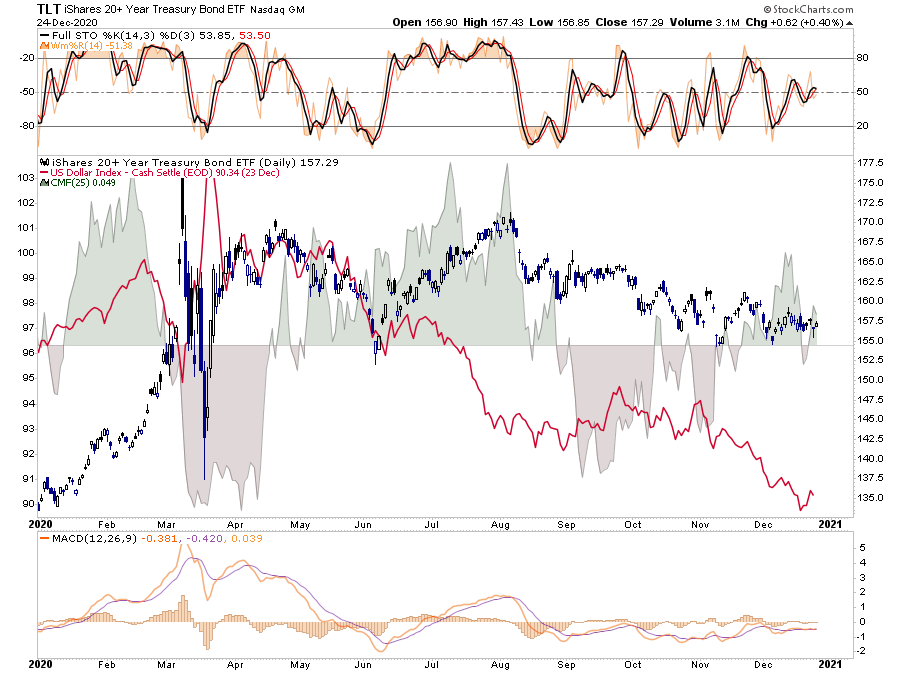
Of course, if dollar flows do indeed reverse, we would also expect to see a bid in Treasury bonds. Such would also get support from foreign currency reserves moving to higher-yielding alternatives compared to other global bonds.
While we expect the “Santa Claus” rally to ensue over the next few trading days, there are risks heading into January. As noted, there are occasions when investors have received a “lump of coal.” With current market dynamics more similar to 2013 and 2019, this may be a year investors wind up on the “naughty” list.

A Record High In Overvaluation
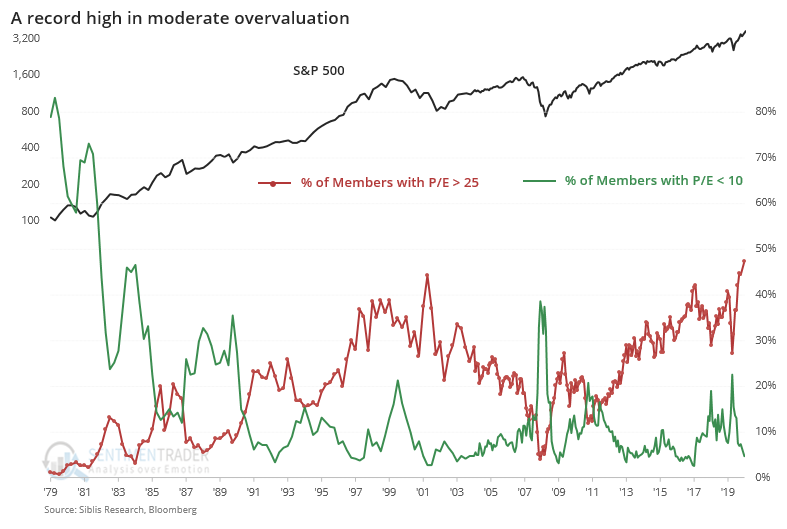
SentimenTrader had a great post out this past week, with some more data showing the more extreme overvalued conditions in the market currently.
“Sentiment and valuation go hand-in-hand. One impacts the other and creates a self-reinforcing loop until something happens to break the cycle.
Over the past 40 years, there have never been more mild, moderate, or severely overvalued companies within the S&P 500.”
Bubbles Are Psychological
What is essential to understand is that excessive bullish sentiment and overvaluation are the two required ingredients for a “bubble.”
“Since stock market ‘bubbles’ are a reflection of speculation, greed, and emotional biases; valuations are only a reflection of those emotions.”
However, it isn’t just P/E’s showing elevated valuations but virtually every conceivable valuation metric used in finance.
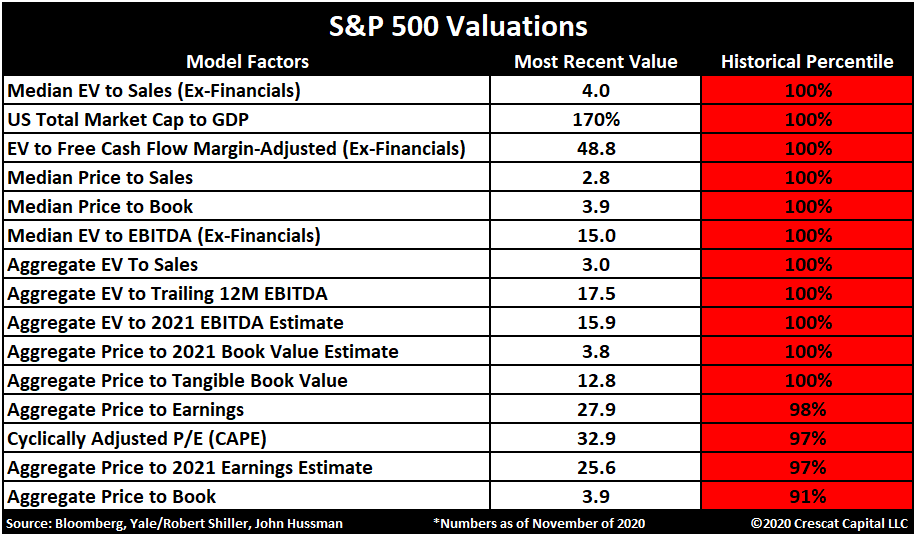
“Psychology” breeds “overvaluation,” which is the very essence of a market “bubble.”
Portfolio Positioning Update
Okay, I said this would be short.
With the “Santa Claus” rally officially kicking off next week, we are maintaining our long bias with reduced hedges at the moment. During the past week, we added to our energy exposure on the recent pullback and some of our “momentum” trades we took profits in previously. We are still maintaining our S&P Index position through next week.
Once we get into January, depending on the state of the stimulus bill, government shutdown, and market levels, we will likely begin reducing risk and hedging portfolios accordingly.
The evidence is mounting quickly that economic and earnings data will likely disappoint overly optimistic projections currently. Furthermore, investors are too confident. Historically, such has always turned out to be a poor mix for a continued bull market advance in the short-term.
We will continue to trade accordingly, but the extreme deviations in all markets from long-term fundamentals are unsustainable.
That is a problem the even the Fed can’t fix.

The MacroView
If you need help or have questions, we are always glad to help. Just email me.
See You Next Week
By Lance Roberts, CIO
Market & Sector Analysis
Analysis & Stock Screens Exclusively For RIAPro Members
S&P 500 Tear Sheet
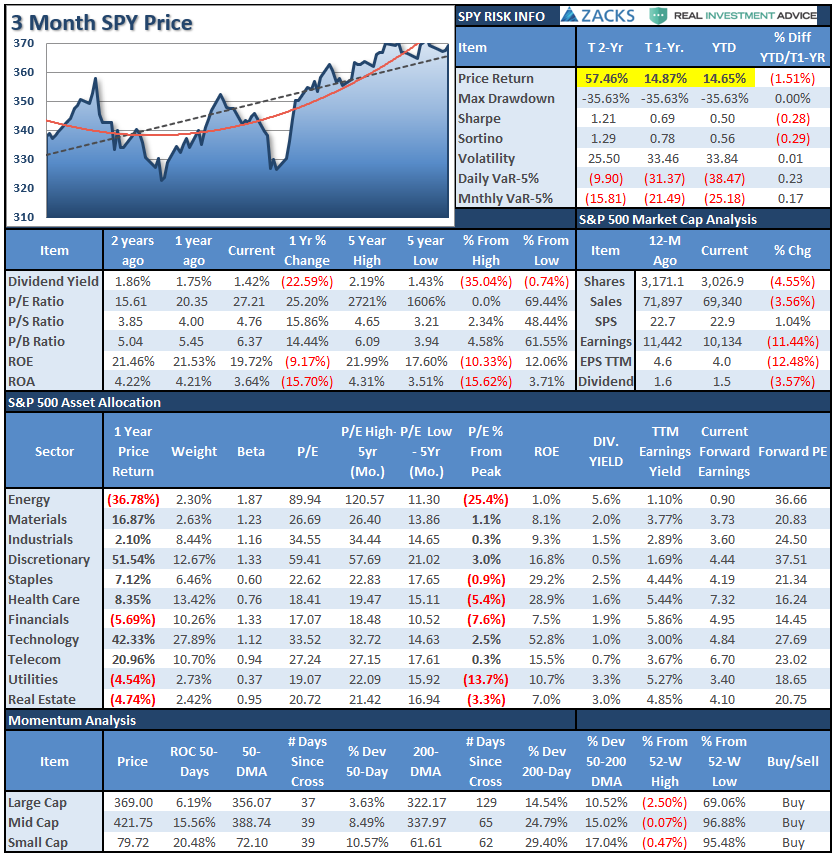
Performance Analysis
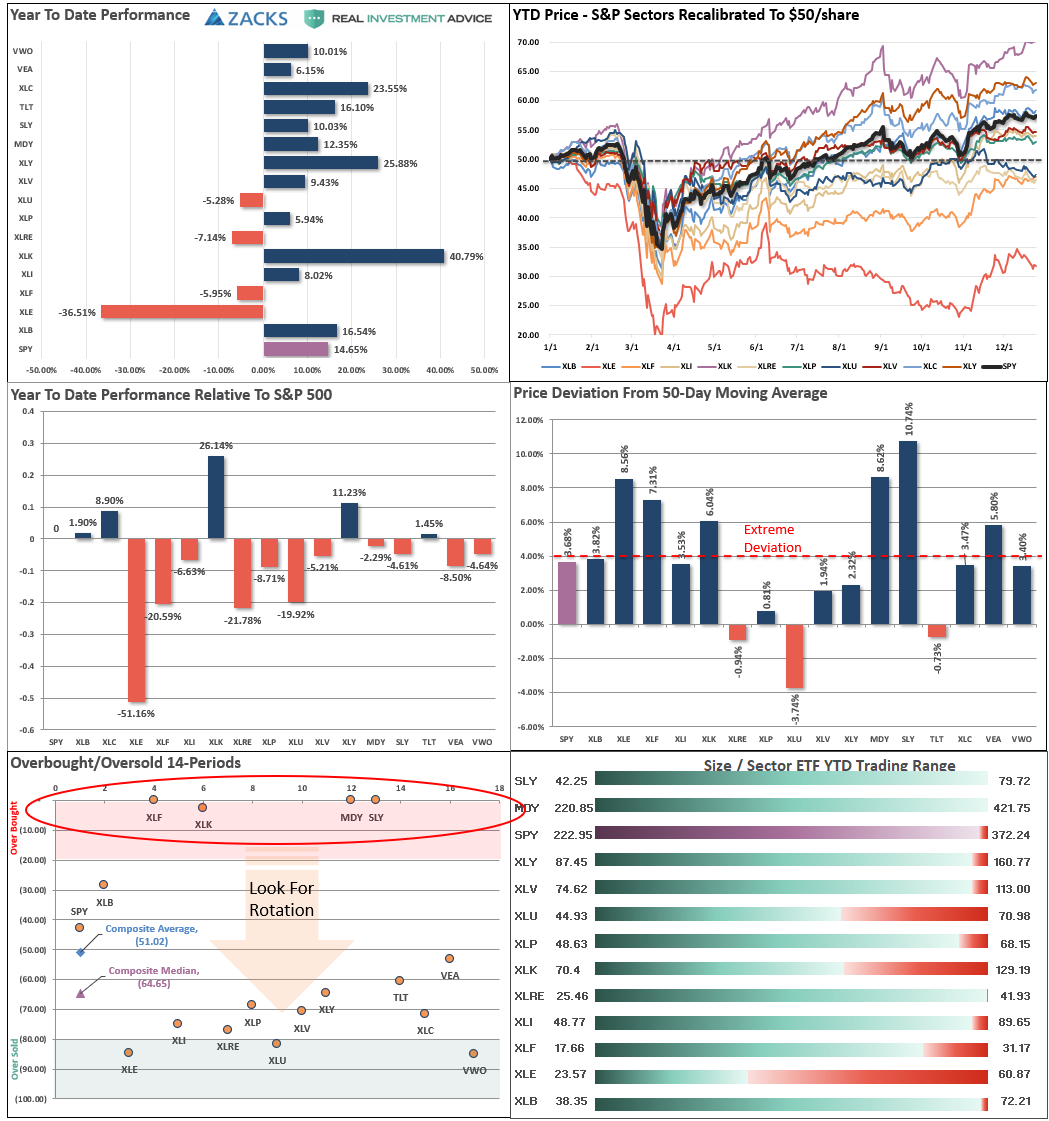
Technical Composite
The technical overbought/sold gauge comprises several price indicators (RSI, Williams %R, etc.), measured using “weekly” closing price data. Readings above “80” are considered overbought, and below “20” is oversold.

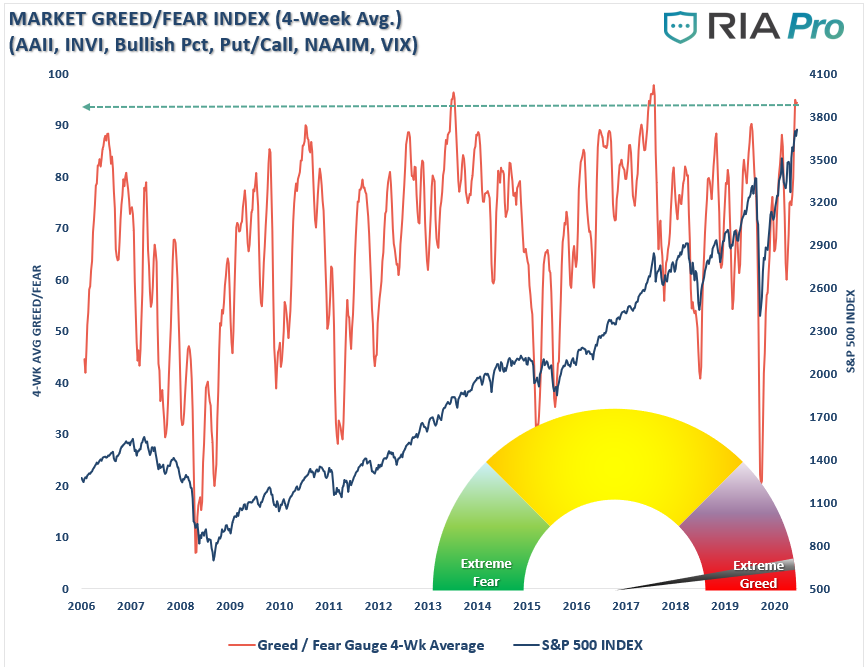
Portfolio Positioning “Fear / Greed” Gauge
The “Fear/Greed” gauge is how individual and professional investors are “positioning” themselves in the market based on their equity exposure. From a contrarian position, the higher the allocation to equities, to more likely the market is closer to a correction than not. The gauge uses weekly closing data.
NOTE: This week, I published the 4-Week Average of the Fear/Greed Index. It is a rarity that it reaches levels above 90. The current reading is 96.07 out of a possible 100.
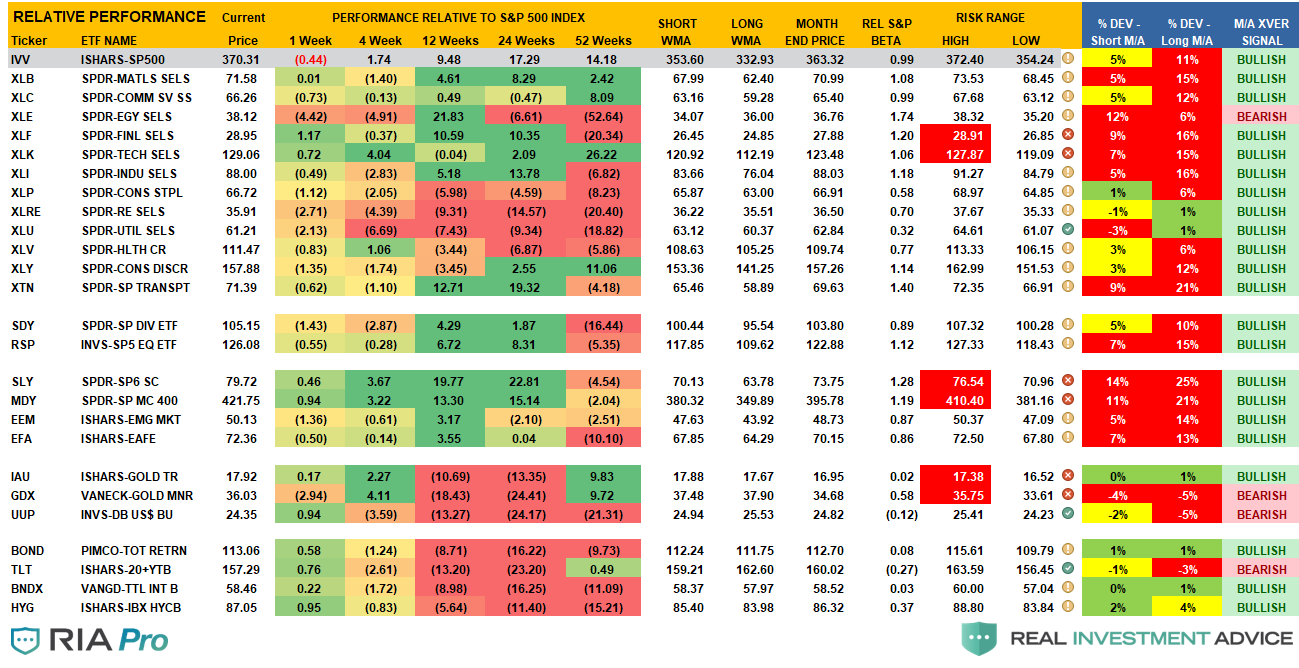
Sector Model Analysis & Risk Ranges
How To Read.
- The table compares each sector and market to the S&P 500 index on relative performance.
- The “MA XVER” is determined by whether the short-term weekly moving average crosses positively or negatively with the long-term weekly moving average.
- The risk range is a function of the month-end closing price and the “beta” of the sector or market.
- The table shows the price deviation above and below the weekly moving averages.
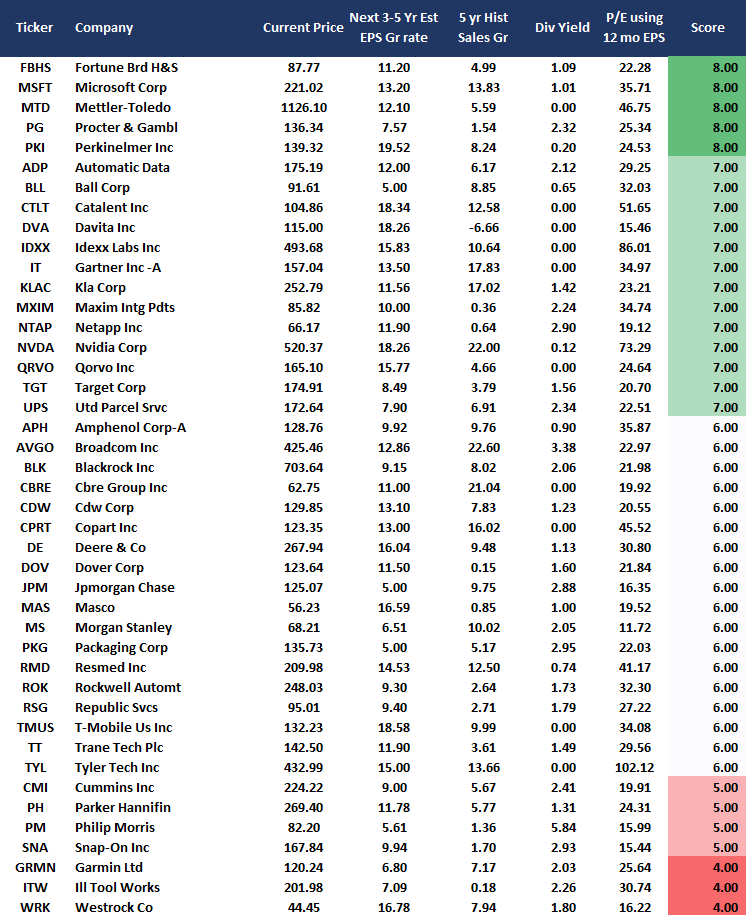
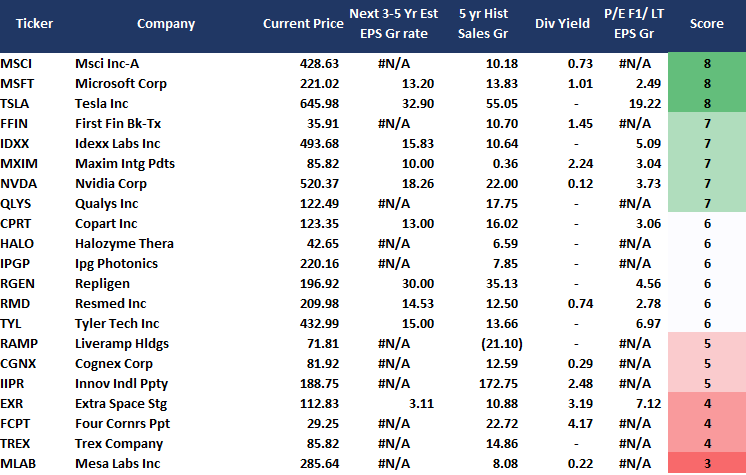
Weekly Stock Screens
Currently, there are 3-different stock screens for you to review. The first is S&P 500 based companies with a “Growth” focus, the second is a “Value” screen on the entire universe of stocks, and the last are stocks that are “Technically” strong and breaking above their respective 50-dma.
We have provided the yield of each security and a Piotroski Score ranking to help you find fundamentally strong companies on each screen. (For more on the Piotroski Score – read this report.)
S&P 500 Growth Screen
Low P/B, High-Value Score, High Dividend Screen

Aggressive Growth Strategy
Portfolio / Client Update
As we get ready to wrap up the final trading week of the year, this is one year we will be glad to leave behind. We certainly hope that 2021 will leave the virus behind us, and we can return to more normal lives.
What 2020 taught us is that we needed to adjust our models and strategies to account for increased liquidity. Not liquidity from the Fed. Instead, it was the Government’s stimulus that looped directly back into markets through retail trading accounts.
With success over the last several months, we have now implemented several indicators that track money flows and price momentum. We have also adjusted our model weightings to allow room for additional hedges and overweight equity risk as needed to generate alpha in portfolios.
However, with that said, our goal remains to navigate these markets as best we can while maintaining our focus on conserving your principal.
Portfolio Changes
During the past week, we made minor changes to portfolios. We post all trades in real-time at RIAPRO.NET.
In anticipation of the seasonally strong period from Christmas to the first two days of January, we added some additional exposure to portfolios.
“Adding 5% of SPY to Equity and ETF portfolios for the end-of-year strength. As noted in both posts below, there is a 76% win ratio for the S&P between the 15th of December and the first week of January.
- Initiate a 5% position of SPY in portfolios.”
Furthermore, with TSLA entering the S&P 500 index, the rebalancing of sectors put downward pressure on energy stocks. We have been looking for a pullback in a couple of stocks to their support levels to start adding positions to portfolios. We used this opportunity today to begin that process.
EQUITY Model
- Reducing CLX from 3% to 2% (Tax loss selling)
- Initiating a 1% position in KMI
- Initiating a 1% position in FANG
ETF Model
- Reducing CLX from 3% to 2% (Tax loss selling)
- Initiating a 2% position in XLE
We are aware of the risks and are carrying tight stops on this position.
As always, our short-term concern remains the protection of your portfolio. We have now shifted our focus from the election back to the economic recovery and where we go from here.
Lance Roberts
CIO
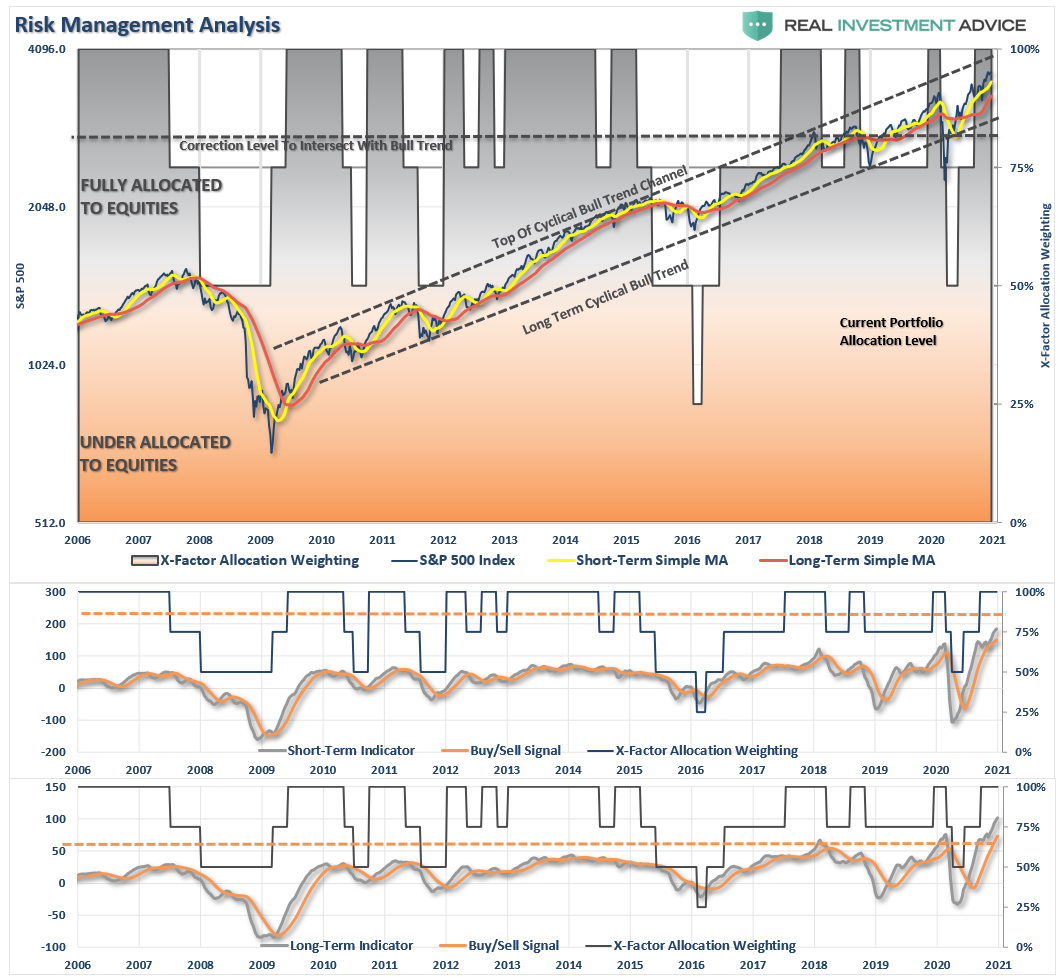
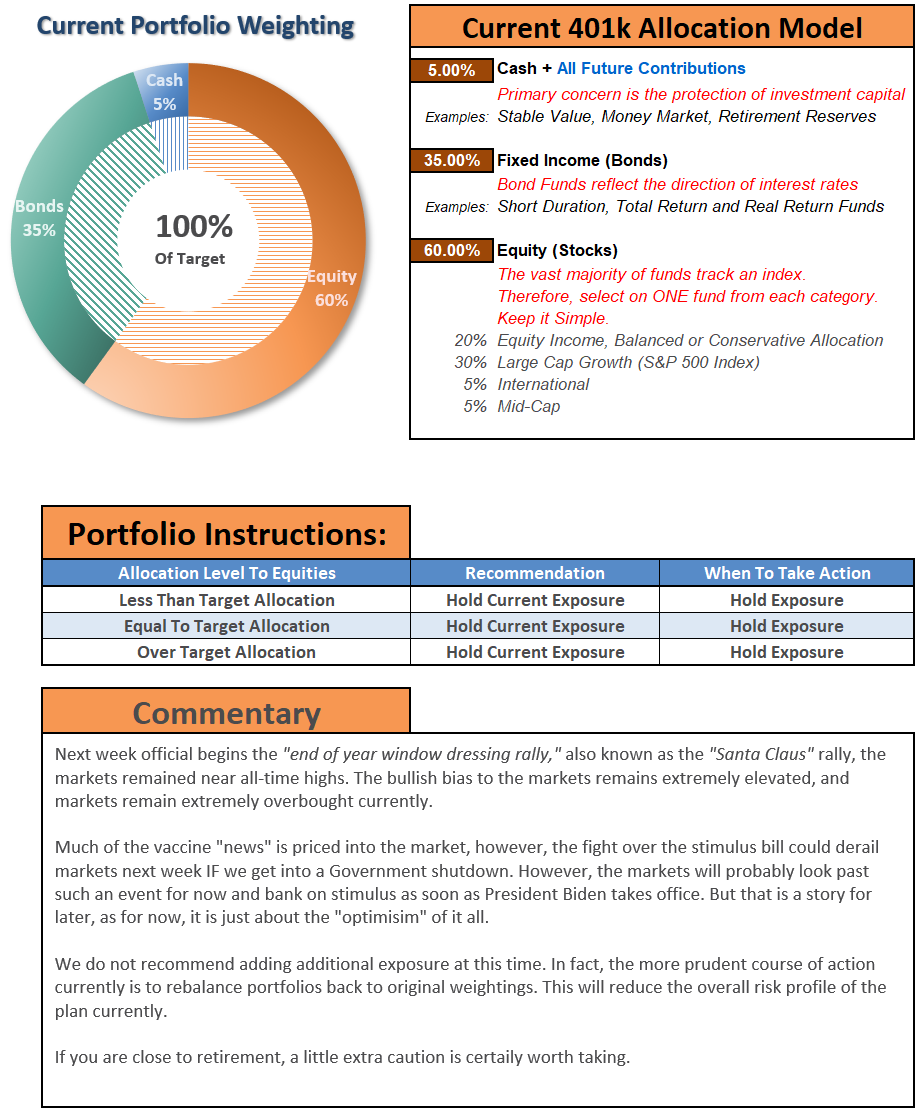
THE REAL 401k PLAN MANAGER
A Conservative Strategy For Long-Term Investors
If you need help after reading the alert, do not hesitate to contact me.
Model performance is a two-asset model of stocks and bonds relative to the weighting changes made each week in the newsletter. Such is strictly for informational and educational purposes only, and one should not rely on it for any reason. Past performance is not a guarantee of future results. Use at your own risk and peril.

401k Plan Manager Live Model
As anRIA PRO subscriber (You get your first 30-days free), you can access our live 401k plan manager.
Compare your current 401k allocation to our recommendation for your company-specific plan and our 401k model allocation.
You can also track performance, estimate future values based on your savings and expected returns, and dig down into your sector and market allocations.
If you would like to offer our service to your employees at a deeply discounted corporate rate, please contact me.


