The Pre-Election Correction Continues, Is It Over? 09-18-20


In this issue of “The Pre-Election Correction Continues, Is It Over?”
- The Correction Continues
- A Historical Look At Pre- And Post-Election Years
- Will Policy Matter
- Portfolio Positioning Update
- MacroView: A Permanent Shift To Valuations
- Sector & Market Analysis
- 401k Plan Manager
Follow Us On: Twitter, Facebook, Linked-In, Sound Cloud, Seeking Alpha
We Need You To Manage Our Growth.
Are you a strong advisor who wants to grow your practice? We need partners we can work with to manage our lead flow. If you are ready to move your practice forward, we would love to talk.

Catch Up On What You Missed Last Week

The Correction Continues
Over the last couple of weeks, we have been discussing the ongoing market correction. As we stated last week:
“As shown in the chart below, we had suggested a correction back to previous market highs was likely but could extend to the 50-dma. So far, the correction has played out much as we anticipated.”
However, we also said:
“However, while we expect a rally next week, due to the short-term oversold condition of the market, there is a downside risk to the 200-dma, which is another 5% lower from current levels. Such would entail a near 14% decline from the peak, which is well within the historical norms of corrections during any given year.”
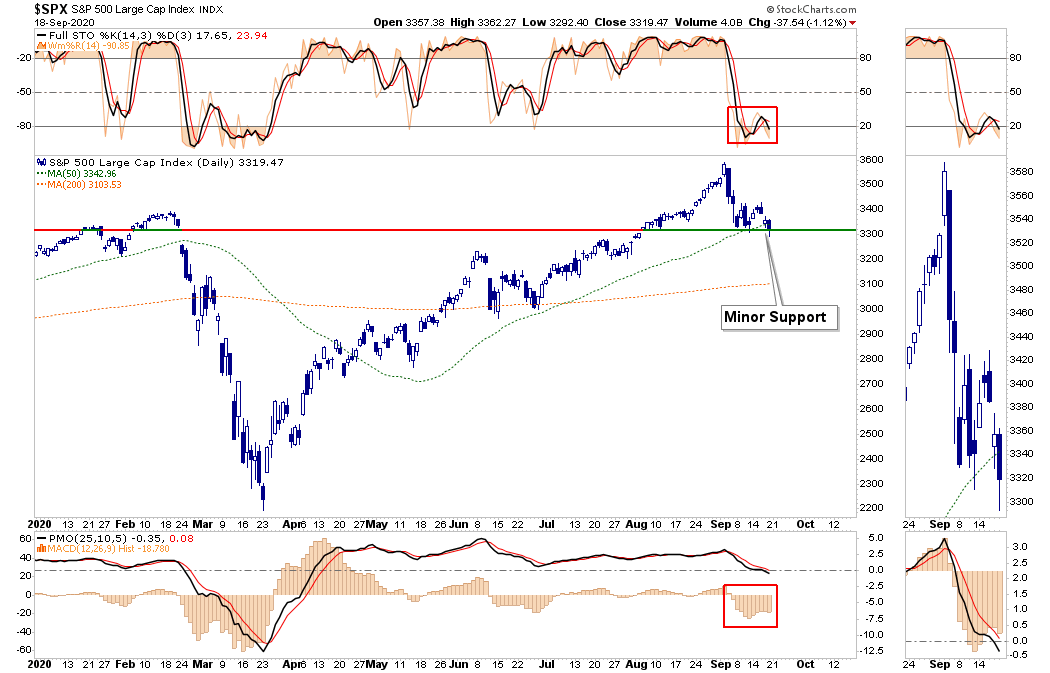
On Friday, due to the “quad-witching options expiration” (when all options contracts for the current strike month expire and rollover), the market gave up support at the 50-dma, as shown below.
The good news, if you want to call it that, is the market did hold a previous level of minor support and remains oversold short-term.
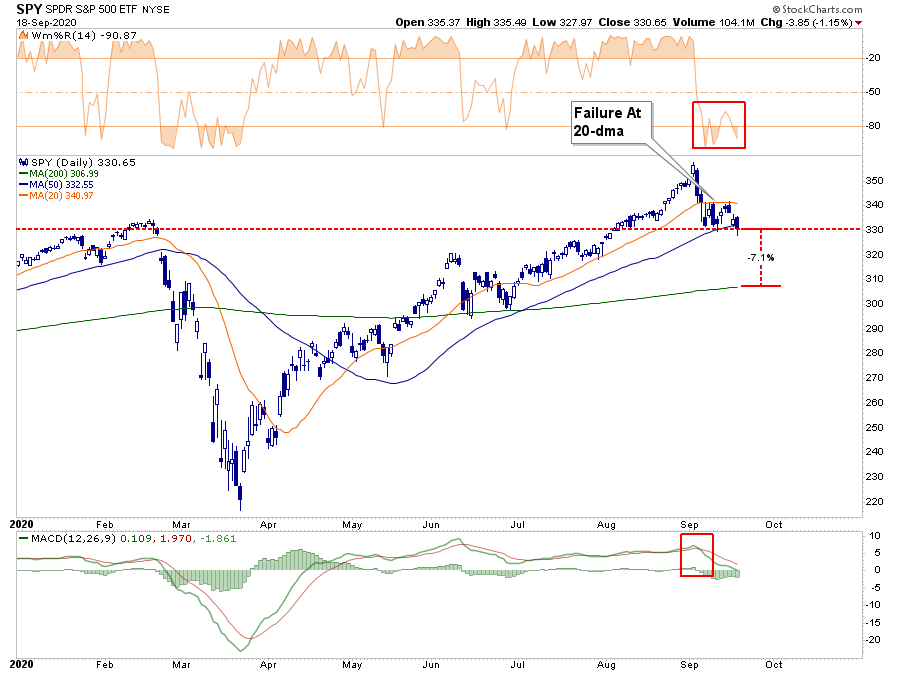
As such, the break of the 50-dma must recover early next week, or it will put the 200-dma into focus. That is currently about 7% lower than where we closed on Friday.
However, as shown below, the markets are very oversold short-term, so a tradeable “bounce” remains very likely in the next few days. If the bounce fails at either the 50- or 20-dma’s overhead, as shown above, such could well confirm an ongoing correction process.
Importantly, as noted previously, this correction was not unexpected and fell in line with historical pre-election market cycles.
Is the correction over? As noted we are likely to get a tradeable bounce next week, but as we will discuss next, there could be more downside pressure in October heading into the election.

Presidential Elections & Market Outcomes
There has been a fair bit of concern about the upcoming election. Given the rampant rhetoric between the right and left, such is not surprising. The Republicans claim that Biden will crash the market. The Democrats suggest the same with President Trump.
From a portfolio management perspective, what we need to understand is what happens during election years to stock markets and investor returns.
“Since 1833, the Dow Jones industrial average has gained an average of 10.4% in the year before a presidential election, and nearly 6%, on average, in the election year. By contrast, the first and second years of a president’s term see average gains of 2.5% and 4.2%, respectively. A notable recent exception to decent election-year returns: 2008, when the Dow sank nearly 34%. (Returns are based on price only and exclude dividends.)” – Kiplinger
The data in the table below varies a bit from Kiplinger as it uses total returns. Since 1833, markets have gained in 35 of those years, with losses in only 11.
Since President Rosevelt’s victory in 1944, there have only been two losses during presidential election years: 2000 and 2008. Those two years corresponded with the “Dot.com Crash” and the “Financial Crisis.” On average, stocks produced their second-best performance in Presidential election years.
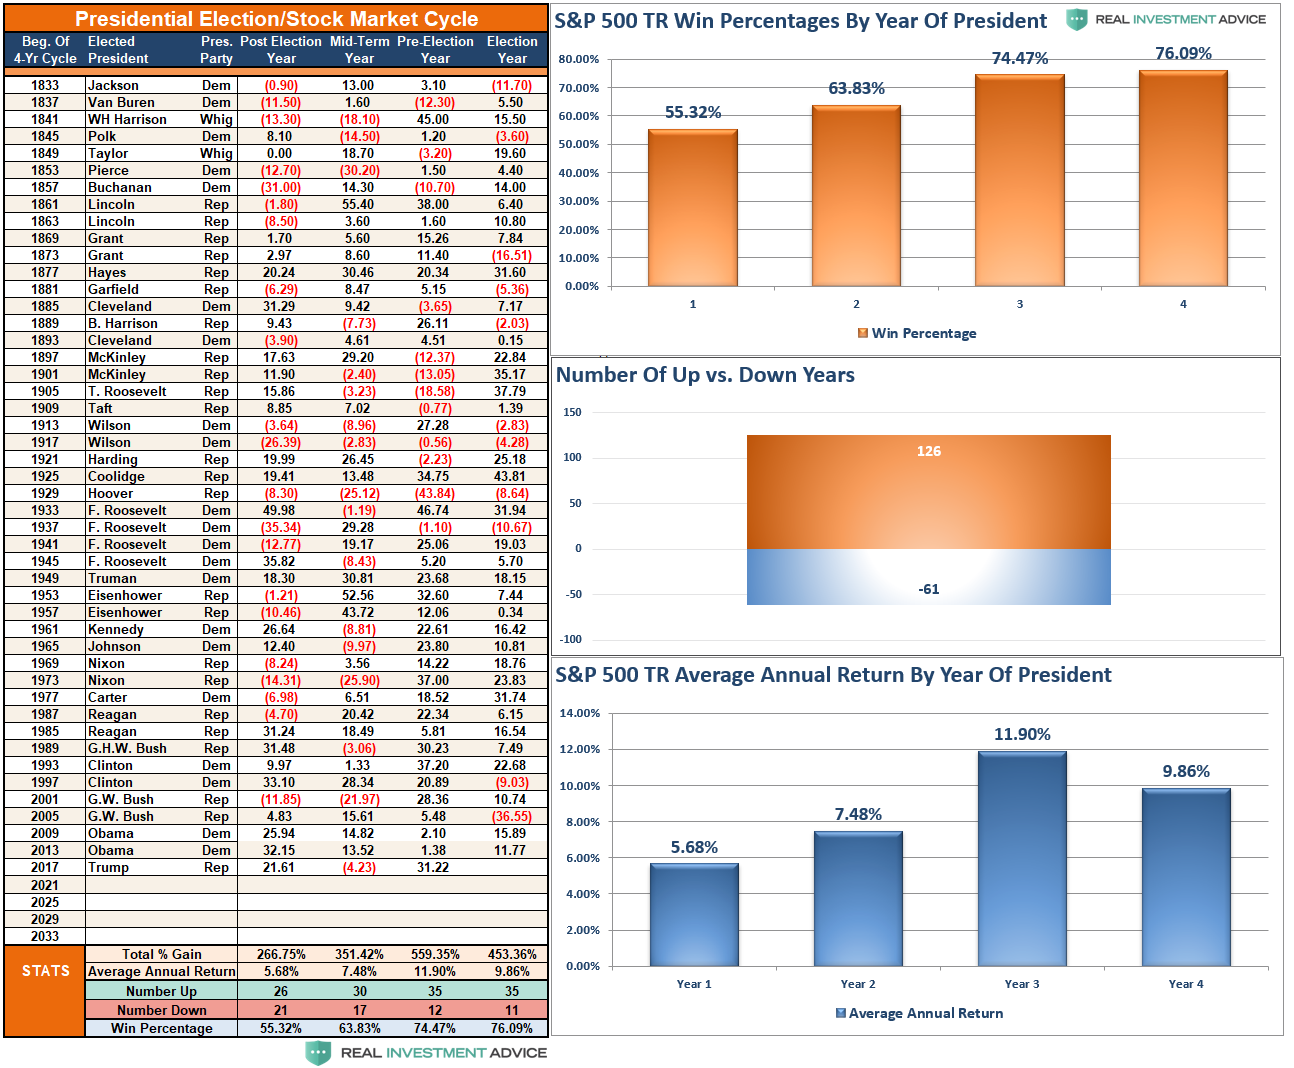
With a “win ratio” of 76%, the odds are high that markets will continue their winning ways. However, I would caution completely dismissing the not so insignificant 24% chance that a bear market could reassert itself, given the current economic weakness.
Furthermore, given the current 12-year duration of the ongoing bull market, the more extreme deviations from long-term means, and ongoing valuation issues, a “Vegas handicapper” might increase those odds a bit.
Will Policies Matter
The short answer is, “Yes.” However, not in the short-term.
Presidential platforms are primarily “advertising” to get your vote. As such, a politician will promise many things that, in hindsight, rarely get accomplished.
Therefore, while there currently much debate about whose policies will be better for the stock market, historically and statistically speaking, it doesn’t matter much.
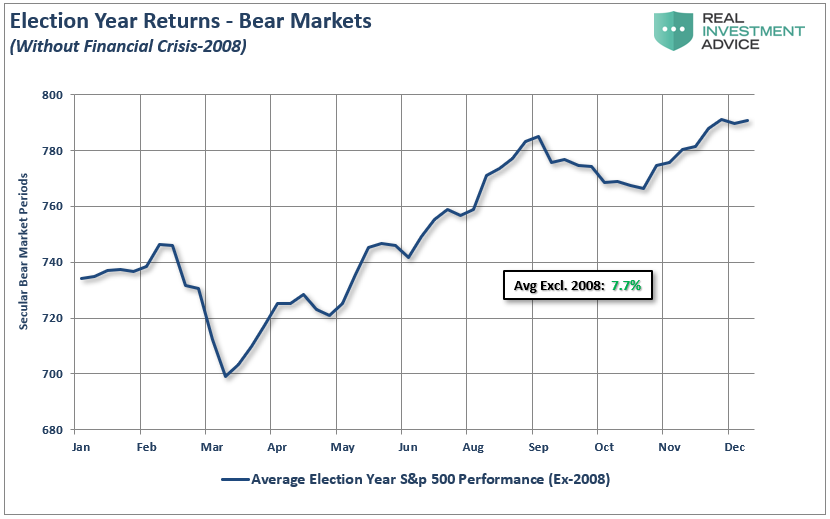
A look back at all election years since 1960 shows an average increase in the market of nearly 2.2% annually.

However, that number is heavily skewed by the decline during the 2008 “Financial Crisis.” If we extract that one year, returns jump to 7.7% annually in election years.
Importantly, note in both cases the slump in returns during September and October. As we stated above, the current market correction falls nicely in line with historical norms.
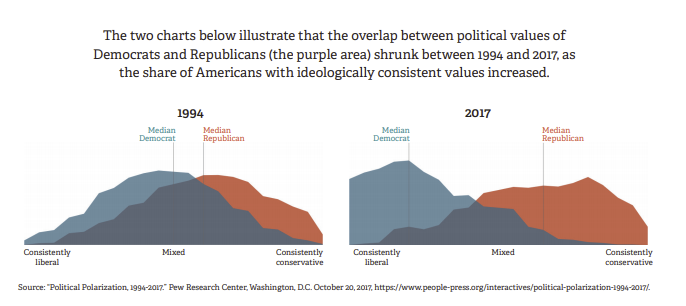
The Great Divide
While you may feel strongly about one party or the other when it comes to politics, it doesn’t matter much when it comes to your money.
Such is particularly the case today.
“For the second election in a row, voters will cast ballots for the candidate they dislike less, not whose policies they like more.” – Lance Roberts, Real Investment Show
What the market already understands is with the parties more deeply divided than at any other single point in history; the likelihood of any policies getting passed is slim. (2017 was the latest data from a 2019 report. That gap is even larger currently as Social Media fuels the divide.)
The one thing markets do seem to prefer – “political gridlock.”
“A split Congress historically has been better for stocks, which tend to like that one party doesn’t have too much sway. Stocks gained close to 30% in 1985, 2013 and 2019, all under a split Congress, according to LPL Financial. The average S&P 500 gain with a divided Congress was 17.2% while GDP growth averaged 2.8%.” – USA Today


It’s Not A Risk-Free Outcome
What we can derive from the data is the odds suggest the market will end this year on a positive note. However, such says little about next year. If you go back to our data table above, the 1st year of a new Presidential cycle is roughly a 50/50 outcome. It is also the lowest average return year going back to 1833.
Furthermore, from the election and 2021, outcomes are overly dependent on many things continuing to go “right.”
- Avoidance of a “double-dip” recession. (Without more Fiscal stimulus, this is a plausible risk.)
- The Fed continues expanding monetary policy. (There is currently no indication of this.)
- The consumer will need to expand their current debt-driven consumption. (This is a risk without more fiscal stimulus or sustainable economic growth.)
- There is a marked improvement in both corporate earnings and profitability. (This will likely be the case as mass layoffs will benefit bottom-line profitability. However, top-line sales remain at risk due to items #1 and #3.)
- A sharp improvement in employment, rising wages, and falling jobless claims will signal a sustainable economic recovery. (There is currently little indication this is the case outside the bounce from the March shutdown.)
These risks are all undoubtedly possible.
However, when combined with the longest-running bull market in history, high-valuations, and excessive speculation, the risks of something going wrong indeed have risen.
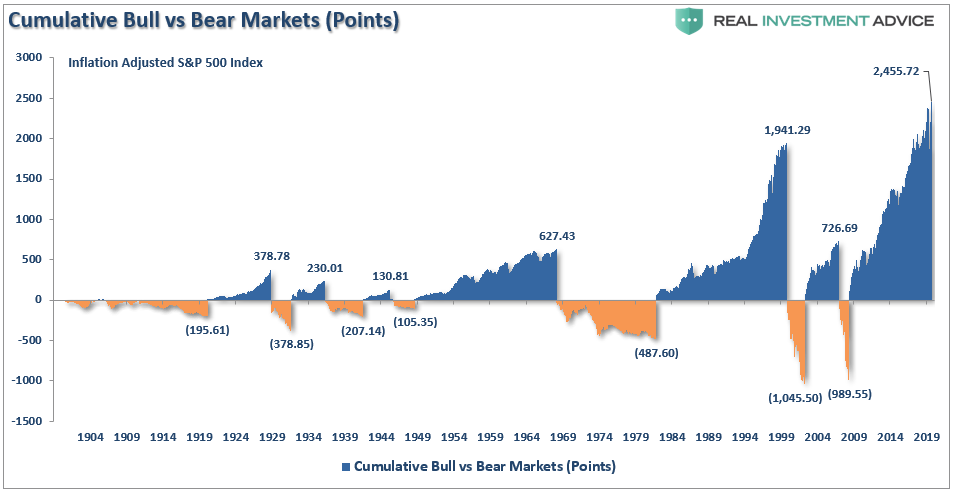
(While most financial media types present bull and bear markets in percentages, which is deceiving because a 100% gain and a 50% loss are the same thing, it worth noting what happens to investors by viewing cumulative point gains and losses. In every case, the majority of the previous point gain is lost during the full-market cycle.)
So, how do you position your portfolio into the election?
Portfolio Positioning For An Unknown Election Outcome
Over the last few weeks, we have repeatedly discussed the idea of reducing risk, hedging, and rebalancing portfolios. Part of this was undoubtedly due to the overly exuberant rise from the March lows and the potential for an unexpected election outcome. As we noted in “Tending The Garden:”
“Taking these actions has TWO specific benefits depending on what happens in the market next.
- If the market corrects, these actions clear out the ‘weeds’ and allow for protection of capital against a subsequent decline.
- If the market continues to rally, then the portfolio has been cleaned up and new positions can be added to participate in the next leg of the advance.
No one knows for sure where markets are headed in the next week, much less the next month, quarter, year, or five years. What we do know is not managing ‘risk’ to hedge against a decline is more detrimental to the achievement of long-term investment goals.”
That advice continues to play well in setting up your portfolio for the election. As we have laid out, the historical odds suggest that markets will rise regardless of the electoral outcome. However, those are averages. In 2000 and 2008, investors didn’t get the “average.”
Such is why it is always important to prepare for the unexpected. While you certainly wouldn’t speed down a freeway “blindfolded,” it makes little sense not to be prepared for an unexpected outcome.
Holding a little extra cash, increasing positioning in Treasury bonds, and adding some “value” to your portfolio will help reduce the risk of a sharp decline in the months ahead. Once the market signals an “all clear,” you can take “your foot off the brake,” and speed to your destination.
Of course, it never hurts to always “wear your seatbelt.”

The MacroView
If you need help or have questions, we are always glad to help. Just email me.
See You Next Week
By Lance Roberts, CIO
Market & Sector Analysis
Analysis & Stock Screens Exclusively For RIAPro Members
Discover All You Are Missing At RIAPRO.NET
This is what our RIAPRO.NET subscribers are reading right now! Risk-Free For 30-Day Trial.
- Sector & Market Analysis
- Technical Gauge
- Sector Rotation Analysis (Risk/Reward Ranges)
- Portfolio Positioning
- Sector & Market Recommendations
- Client Portfolio Updates
- Live 401k Plan Manager

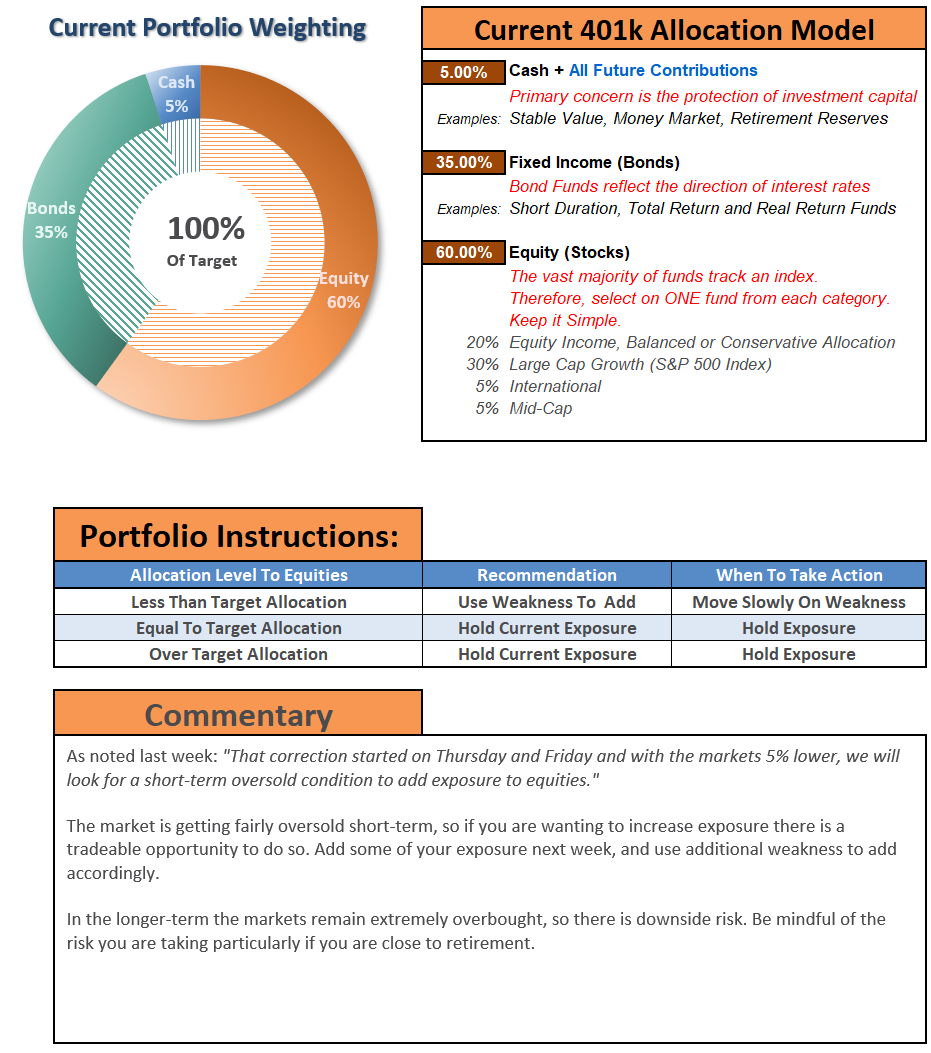
THE REAL 401k PLAN MANAGER
A Conservative Strategy For Long-Term Investors

If you need help after reading the alert, do not hesitate to contact me.
Model performance is a two-asset model of stocks and bonds relative to the weighting changes made each week in the newsletter. Such is strictly for informational and educational purposes only, and one should not rely on it for any reason. Past performance is not a guarantee of future results. Use at your own risk and peril.

401k Plan Manager Live Model
As an RIA PRO subscriber (You get your first 30-days free), you have access to our live 401k plan manager.
Compare your current 401k allocation to our recommendation for your company-specific plan and our on 401k model allocation.
You can also track performance, estimate future values based on your savings and expected returns, and dig down into your sector and market allocations.
If you would like to offer our service to your employees at a deeply discounted corporate rate, please contact me.


