Disinflation Risk Is Wall Street’s Blind Spot


Inside This Week’s Bull Bear Report
- The Santa Rally Gets A Icy Start
- Disinflation Risk Is Wall Street’s Blind Spot
- How We Are Trading It
- Research Report – Market Valuation Suggests Weak Returns In 2023
- Youtube – Weekly Market Review With Adam Taggart
- Stock Of The Week
- Daily Commentary Bits
- Market Statistics
- Stock Screens
- Portfolio Trades This Week
The Santa Rally Gets An Icy Start
Disinflation risk may be an unappreciated risk next year. However, before we discuss that, let’s start with what we said last week.
“The MACD sell signal remains a good signal NOT to get sucked into rally attempts. Remaining cautious has served readers well over the last several weeks. The good news, if you want to call it that, is the 50-DMA held on Friday and sets the market up for a “Santa Rally” into year-end. The not-so-good news is that the rally may be somewhat limited, given the downside break of the recent consolidation range, which will provide overhead resistance.”
With the MACD “sell signal” still intact, that downside break put additional pressure on asset prices this past week. With only one trading week left until year-end, the “Santa Rally” has gotten off to a rather icy start. Since Monday is a market holiday, such leaves only four days for “Santa to visit Broad and Wall.” At this point, December will likely have a negative return, which bodes poorly for January.

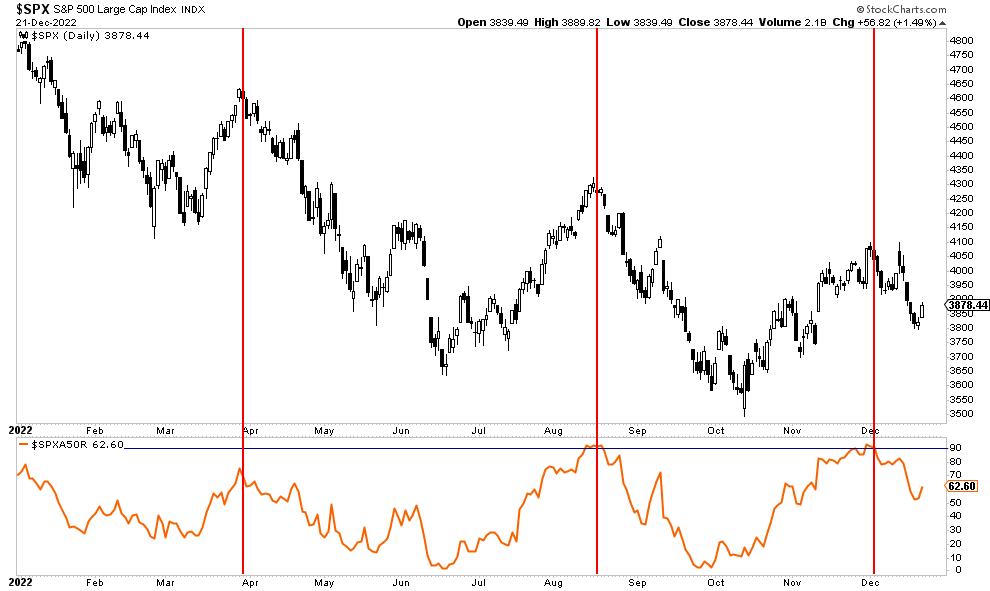
Importantly, with the market trading below the 50-DMA, there is a cluster of resistance just overhead in the market, with the 20, 100, and 200-DMA sitting just above current levels. Most importantly, the downtrend line from the January highs has continued to cap rallies all year.
Another “risk off” indicator this year remains the number of stocks above their respective 50-DMA. As shown, each time that indicator reached 90%, it was the peak of the “bear market” rally. We just recently triggered that signal once again.
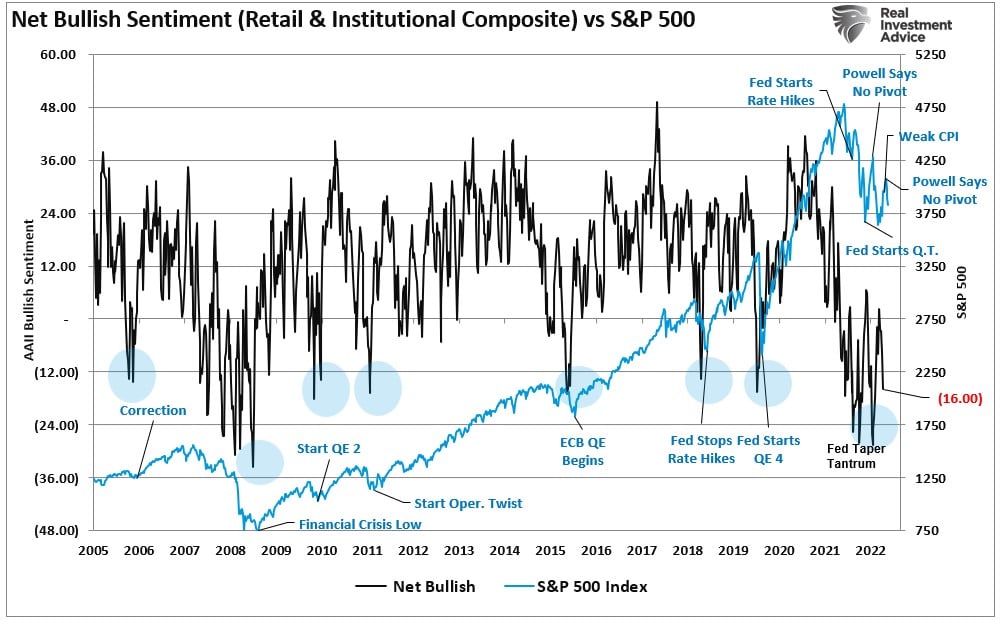
While investor sentiment had improved recently, with professional investors getting bullish during the recent rally, that sentiment mostly reversed in recent days as the rally failed.
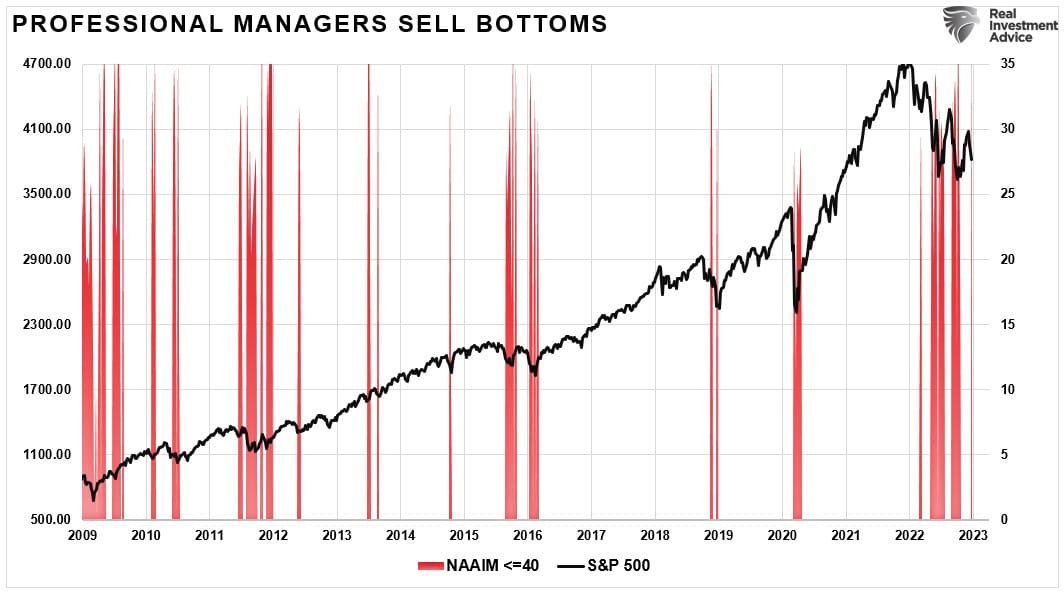
The question is whether traders will begin to buy the market heading into 2023 or if the risk-off positioning we witnessed in December will continue in January. On a bullish note, it has paid to buy stocks whenever professional investors sell, as denoted by the NAAIM index. Since 2009, whenever net exposure to stocks fell below 40, currently at 39.35, such has marked the bottom of the correction cycle.
Interestingly, despite the near-term bearishness, Wall Street continues to carry a relatively bullish outlook for 2023.
Need Help With Your Investing Strategy?
Are you looking for complete financial, insurance, and estate planning? Need a risk-managed portfolio management strategy to grow and protect your savings? Whatever your needs are, we are here to help.

Wall Street Has A Bullish View For 2023
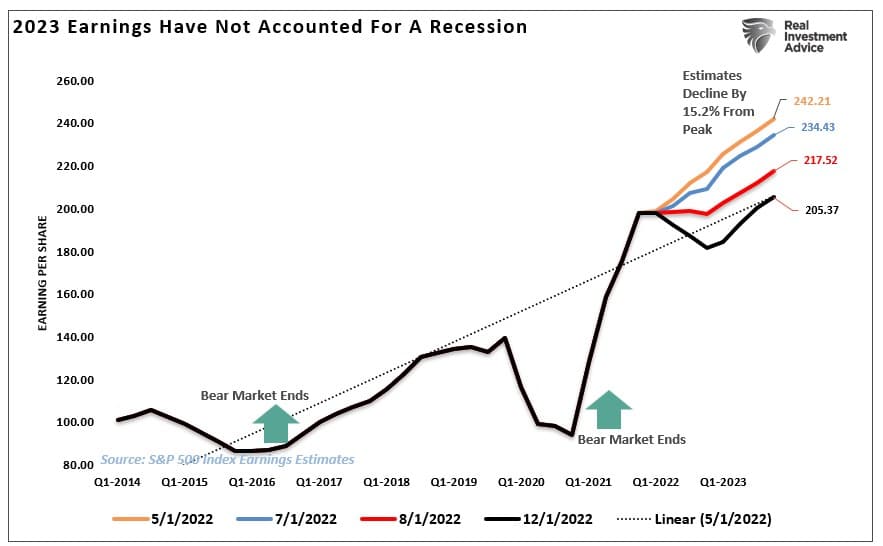
Last week’s MacroView discussed the 2023 price targets based on valuation and earnings assumptions. At that time, estimated earnings for the end of 2023 were ~$205/share. Since then, those expectations have dropped again to just $203.75/share. However, as we stated, those downward revisions continue.
“Using FORWARD operating earnings for any analysis is flawed. The reason is that forward operating earnings today will not be at the same level in the future. Since May 2022, forward earnings estimates have declined by 15%. We suspect estimates will fall further, making forward valuation assumptions unreliable.”
However, here is the problem for investors heading into 2023.
Currently, Wall Street estimates for next year remain primarily bullish, with the median price target at 4000, but with some running as high as 4500, which is nearly 17% above 3850 (as of the time of this writing.)
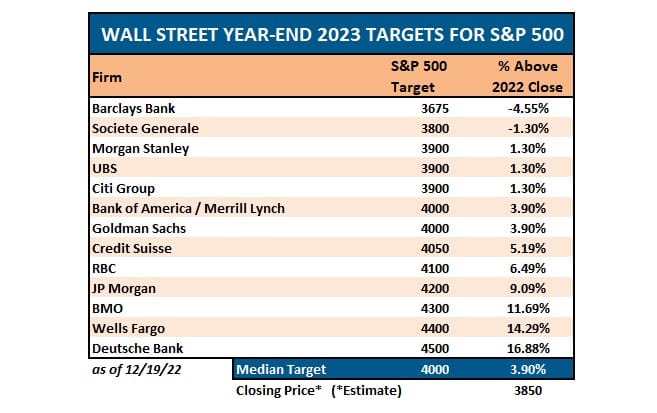
Since markets rise about twice as often as they fall, it always pays for Wall Street estimates to be bullish. (No one remembers the years when the bulls were wrong.)
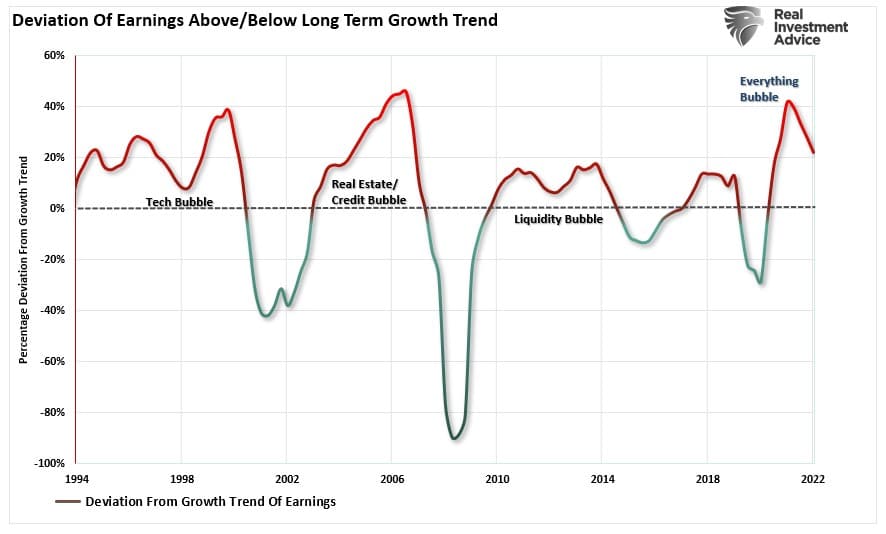
However, here is the problem with those estimates going into 2023. Currently, earnings estimates, even with all of the downward revisions already factored in, remain 20% above their long-term growth trend. During a recession or even an economic slowdown, earnings tend to revert to their growth trend. Such makes sense as earnings growth is a function of economic growth over time.
As we will discuss momentarily, the disinflation risk in 2023 remains Wall Street’s current “blind spot.” However, as the Fed has already stated, below-trend economic growth is required to beat the inflationary pressures in the economy. If that is the case, slower earnings growth will result in lower asset prices to adjust valuations. As we showed last week, depending on where you assess valuations and earnings, there is a wide range of potential outcomes. Unfortunately, most ranges suggest lower prices versus Wall Street’s more optimistic views.

Disinflation Risk Is Wall Street’s Blind Spot
One of the main themes we have discussed in the last year is the current bout of inflation is not due to strong, organic economic growth. Instead, the inflation surge is a function of too much money chasing too few assets following $5 Trillion in stimulus money sent to households amid an economic shutdown.
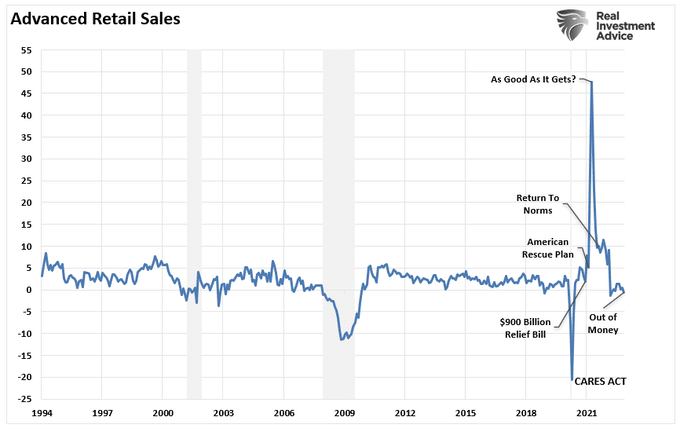
The massive surge in stimulus sent directly to households resulted in an unprecedented spike in “savings,” creating artificial demand as represented by retail sales. Over the next two years, that “bulge” of excess liquidity will revert to the previous growth trend, which is a disinflation risk. As a result, economic growth will lag the reversion in savings by about 12 months. This “lag effect” is critical to monetary policy outcomes.
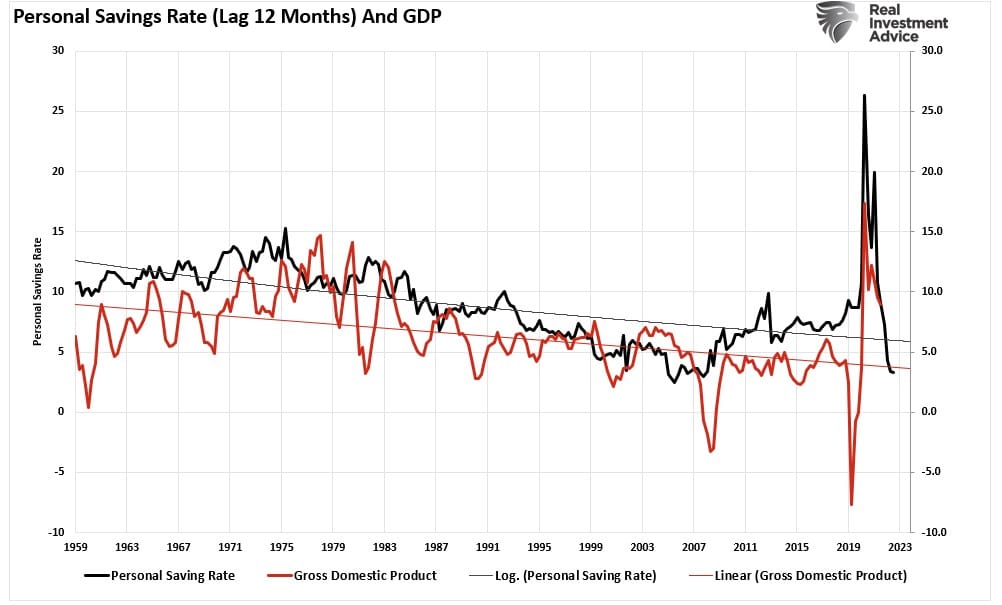
Since 1980, personal savings and economic growth have continued to decline. That correlation is obvious, considering economic growth is ~70% consumption. Unfortunately, due to the massive debt loads, the natural economic growth rate is below 2%. Such is evident that following each “crisis event,” the trend of economic growth continues to slow.
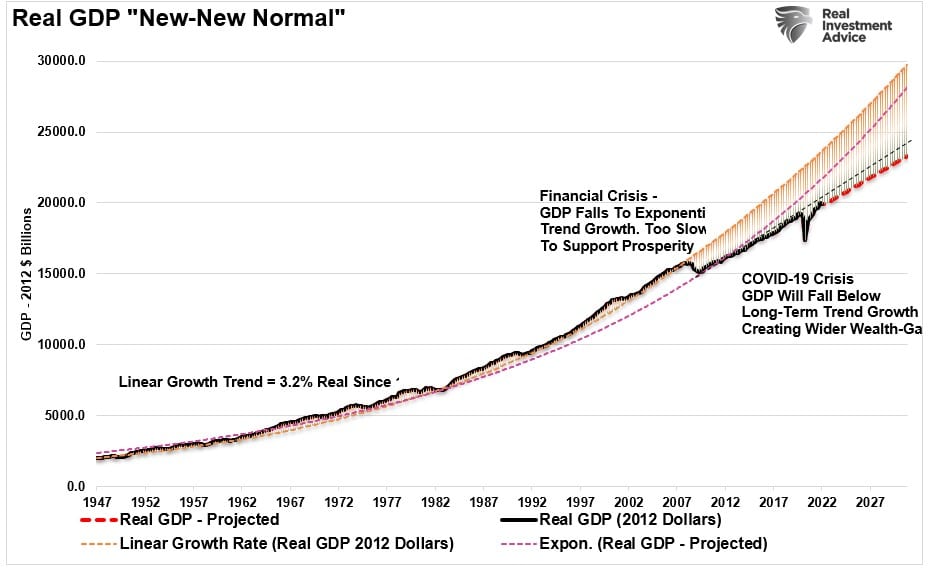
The slower rate of growth, combined with tighter monetary accommodation, will challenge the Fed as disinflation risk becomes the next monetary policy challenge.
The Pig In The Python
The “pig in the python” effect is apparent. Personal consumption expenditures (PCE) comprise roughly 70% of economic activity. The chart below shows the monthly net change in PCE and credit card debt. As with the data above, the surge in spending is evident following the $5 trillion in fiscal stimulus. Currently, spending continues running well above the long-term average even though it continues to revert to norms.
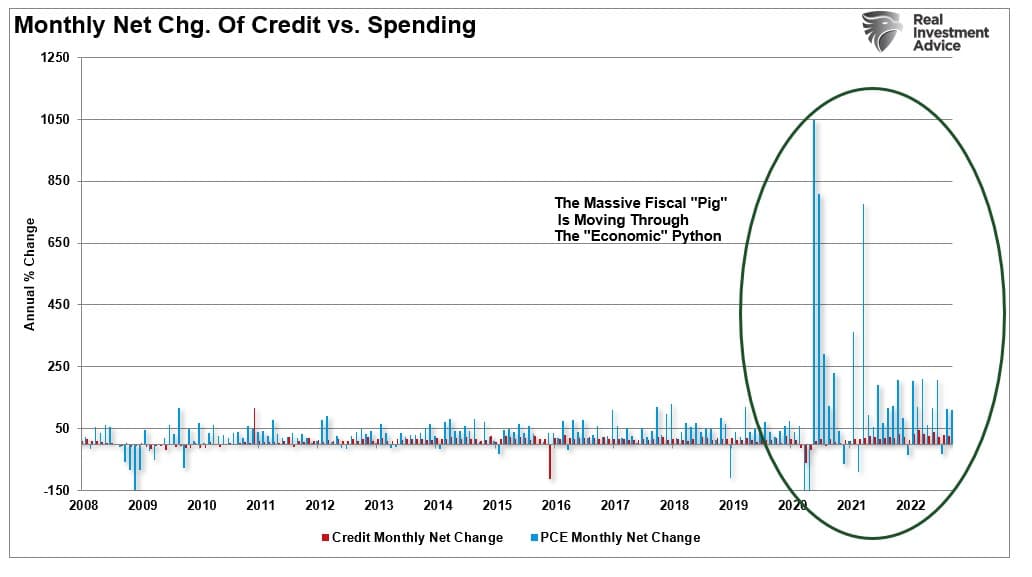
That bulge in spending is pulling forward future consumption, which presents a substantial disinflation risk next year. In other words, as households received stimulus money, they spent it on things they would have bought in the future. For example, many individuals bought new computers to work from home, made household improvements, or purchased a new car. The problem with “pulling forward” future consumption is that it creates a void in the future. If that void remains unfilled, it will drag on economic growth.
The remnants of the fiscal “pig” in the economic “python” is masking the effects of higher interest rates and more restrictive monetary accommodation. My colleague, Albert Edwards at Societe Generale, had an excellent note this week on disinflation risk.
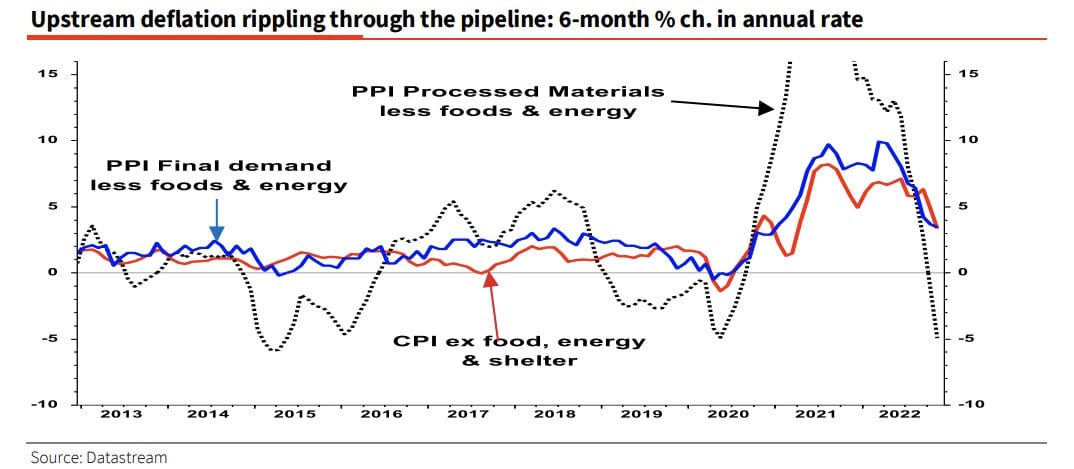
“Nobody expects Powell to signal that an increase in the Fed’s inflation target is imminent when inflation is at 7%, and unemployment is near record lows. Let’s see what happens when the unemployment rate starts to surge and headline inflation falls below zero (as the chart below indicates is in the pipeline).”

He goes on to note other signals of disinflation risk next year.
“The chart below also signals that the 2021 pipeline cost pressures are in full reverse. The last two times upstream PPI cost pressures saw this much deflation, core PPI and CPI inflation fell to zero on both occasions. Wage inflation may be higher now, but a rapid decline is still likely.”
For investors, one question to be answered is what happens when the “pig finally exits the python.”
The Pig Exits The Python
Investors are currently clinging from one economic headline, or Fed comment, to the next in hopes of a sign the Fed will restart monetary accommodation. However, the Federal Reserve remains adamant that inflation is the more significant concern and that some “economic pain” may be needed.
As noted, earnings are currently highly elevated due to the massive fiscal interventions that dragged forward consumption. We previously discussed that earnings are extremely deviated above their long-term growth trends and well above what the economy can naturally generate.
“The problem of overvaluation in a slow-growth economic environment is problematic. The massive surge in earnings during the pandemic-driven shutdown is unsustainable as the economy normalizes. Massive stimulus programs, combined with enormous unemployment, led to surging profits that are not replicable in the future. As shown, earnings are one of the most mean-reverting data series in existence, and ultimately if earnings don’t revert, capitalism is no longer functioning correctly.”
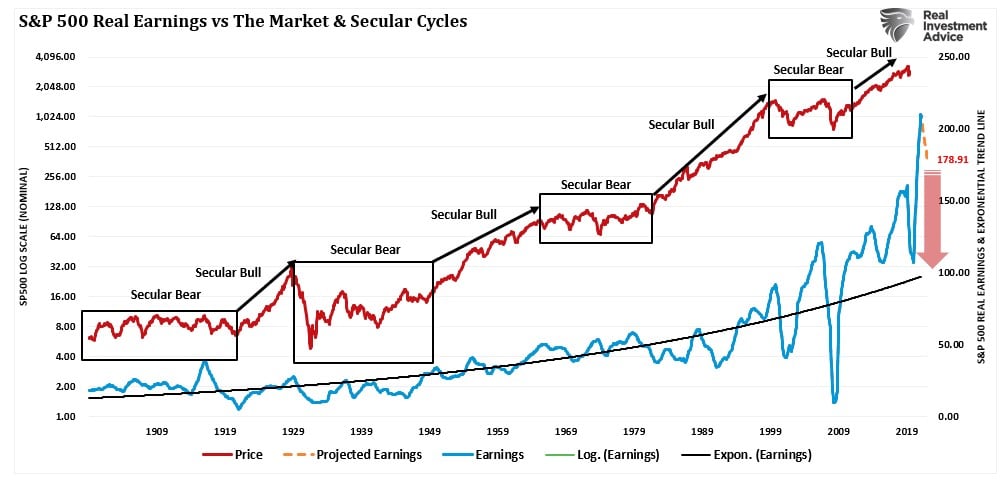
Earnings can not, over the long term, outgrow the economy. Such is because it is economic activity that creates corporate revenues. As the lag effect of monetary tightening bits into economic growth, both economic growth and corporate earnings must revert to historical norms. Such suggests that asset prices are vulnerable to significant repricing to reflect future economic realities. The outcome seems inevitable without either the Federal Reserve reverting to quantitative easing or the Government injecting more fiscal stimulus.
Jerome Powell’s recent statement from the Brookings Institution speech was full of warnings about the lag effect of monetary policy changes. It was also clear there is no “pivot” in policy coming anytime soon.
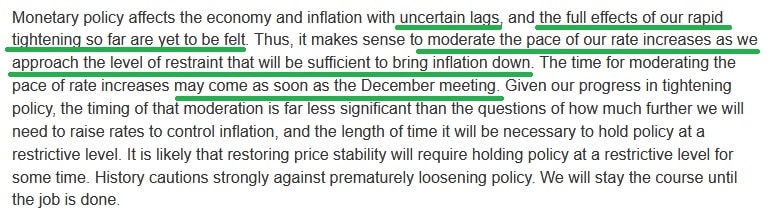
Investors should remain cautious as the “pig exits the python” over the next several months. The consequence must be that markets adjust to a world with less monetary accommodation. In such an environment, accelerated returns will no longer be possible.
In other words, disinflation risk is likely Wall Street’s most significant blind spot next year.
Not Getting The Bull Bear Report Each Week In Your Mailbox? Subscribe Here For Free.
How We Are Trading It
So far, Santa has failed to visit “Broad and Wall,” providing little incentive to try and chase the rally into the year-end. For now, we continue to hold very reduced exposure to the market, remain overweight in cash, and underweight in our bond duration. That allocation has provided us with a cushion this year. However, the prospects for 2023 remain less than optimistic.
As is always the case, things can and will change. When they do, we will adapt accordingly. Risk controls continue to be our biggest beneficiary this year as market volatility has made directional bets, long or short, extremely difficult to time. Passive investing has also not worked well this year, as traditional market hedges all became correlated this year, with both stocks and bonds under pressure.
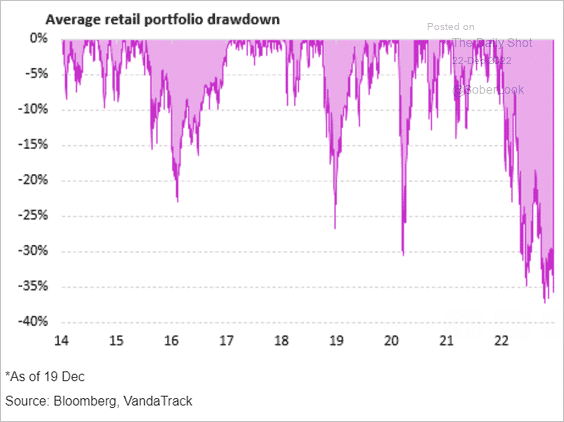
A good example was recent data showing the average investor down 35% this year. Such is interesting, considering the overall market is down less than 20% this year.
We have repeated our core risk management principles for the last couple of months which have helped navigate the overall market. However, since we are heading into year-end, I thought it might be helpful to give you all 15 rules we follow to apply to your risk management protocols.
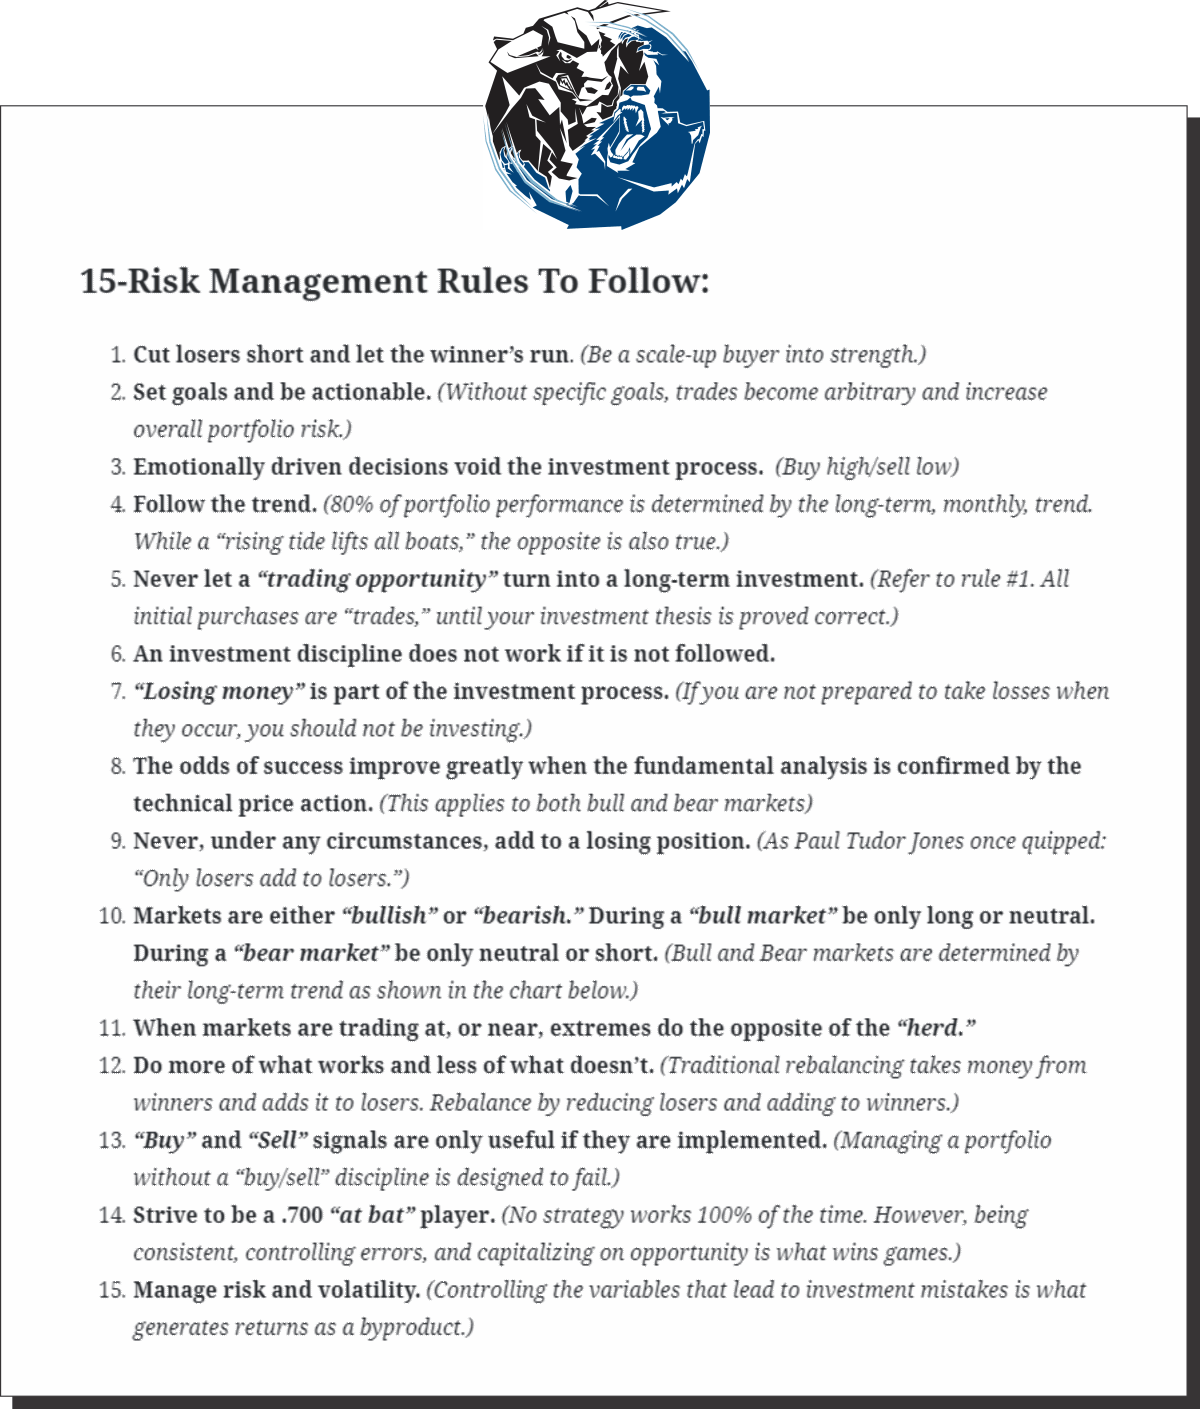
These won’t guarantee you absolute success in the markets, but they will at least keep you from getting crushed.
Or, if your portfolio looks like the above, you can keep doing it your way and hope to get back to even.
Merry Christmas And Many Blessings To You And Your Families.
See you next week.
Research Report

Weekly Market Recap With Adam Taggart
Subscribe To Our Youtube Channel To Get Notified Of All Our Videos
Stock Of The Week In Review
Will Return In Janauary
Here is a link to the full SimpleVisor Article For Step-By-Step Screening Instructions.
Login to Simplevisor.com to read the full 5-For-Friday report.
Daily Commentary Bits
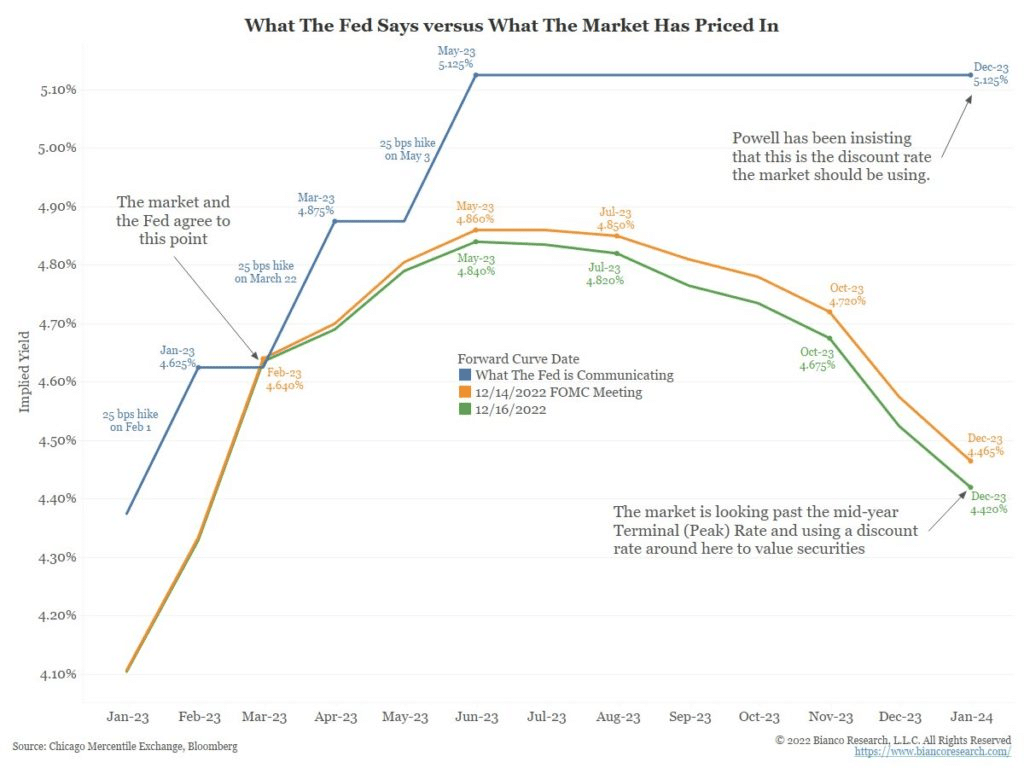
The road map for 2023 may continue to depend heavily on the Fed’s monetary policy stance. In January 2022, we warned readers not to fight the Fed. The Fed was going to raise rates more aggressively than was being acknowledged. The road map for 2023 is different with Fed Funds over 4%, QT is in full operation, and the terminal Fed Funds rate is in sight. The graph below, from Jim Bianco, helps appreciate the road map for 2023. If Powell sticks with the blue line, as he avows, keeping Fed Funds at 5% or greater for the year, the market is underestimating the Fed’s resolve. Therefore, equity weakness will likely continue as investors price in a more restrictive monetary policy. Conversely, if the green line showing the market-implied Fed Funds rate turns out to be the correct road map, 2023 may be a friendlier year for investors.
Our concern is there is a third route not shown in the graphic. If financial instability crops up or the economy weakens much more than expected, both paths in the graph may overestimate where Fed Funds will be in 2023. In the “something breaks” scenario, an aggressively easing Fed may not be the panacea for the weak market investors are hoping for.
Click Here To Read The Latest Daily Market Commentary (Subscribe For Pre-Market Email)
Bull Bear Report Market Statistics & Screens

SimpleVisor Top & Bottom Performers By Sector

S&P 500 Tear Sheet
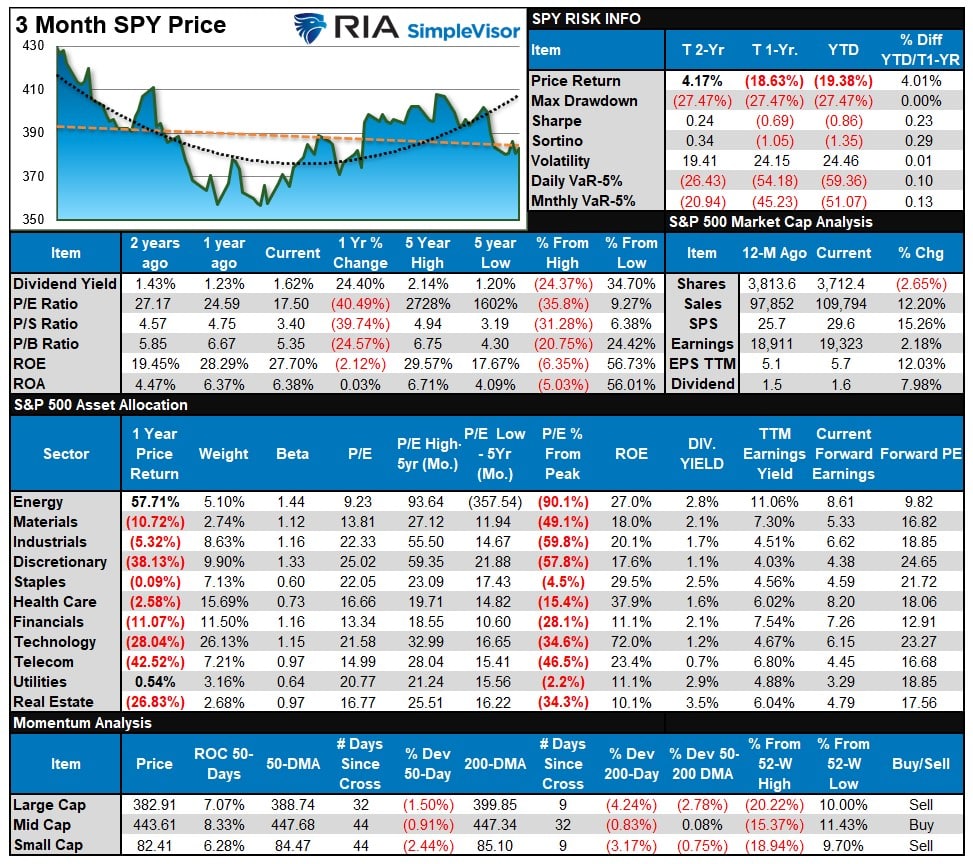
Relative Performance Analysis
Last week we stated:
“With the market is back to extreme oversold levels on major markets and sectors. Such sets the base for a tradeable “Santa Rally” into year-end.
The rally started a bit sluggish, but the official rally period is next week and the first two days of January. That extremely oversold level from last week is beginning to reverse, but there is still potential upside next week. Markets and sectors are not trading at the extreme deviations seen previously, except Energy, so it is possible to see a decent rally to start the year. The advice remains to sell the rally and reduce and rebalance risk accordingly.

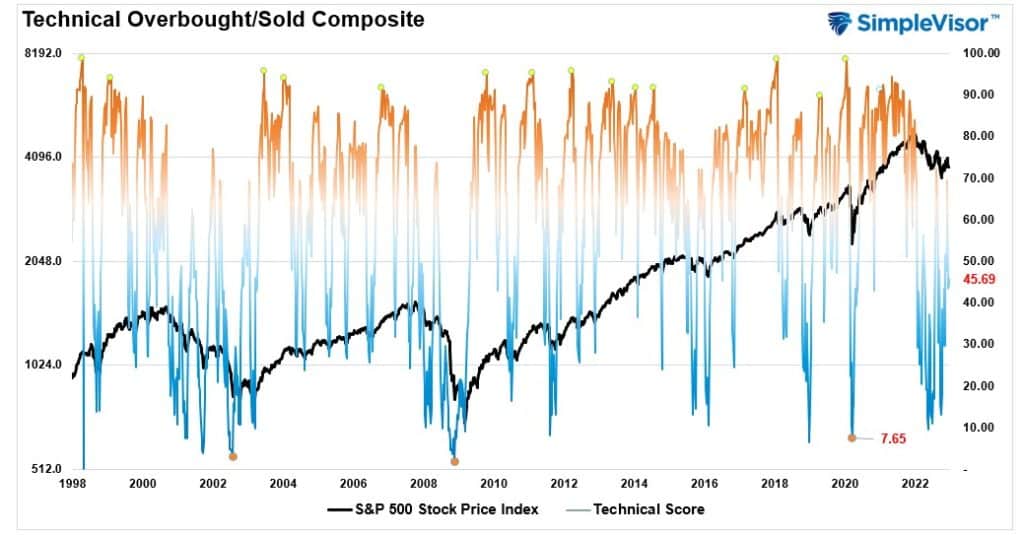
Technical Composite
The technical overbought/sold gauge comprises several price indicators (RSI, Williams %R, etc.), measured using “weekly” closing price data. Readings above “80” are considered overbought, and below “20” are oversold. Markets tend to peak when those readings are at 80 or above, which suggests profit-taking and risk management are prudent. The best buying opportunities exist when those readings are 20 or below.
The current reading is 45.69 out of a possible 100 and rising. Remain long equities for now.
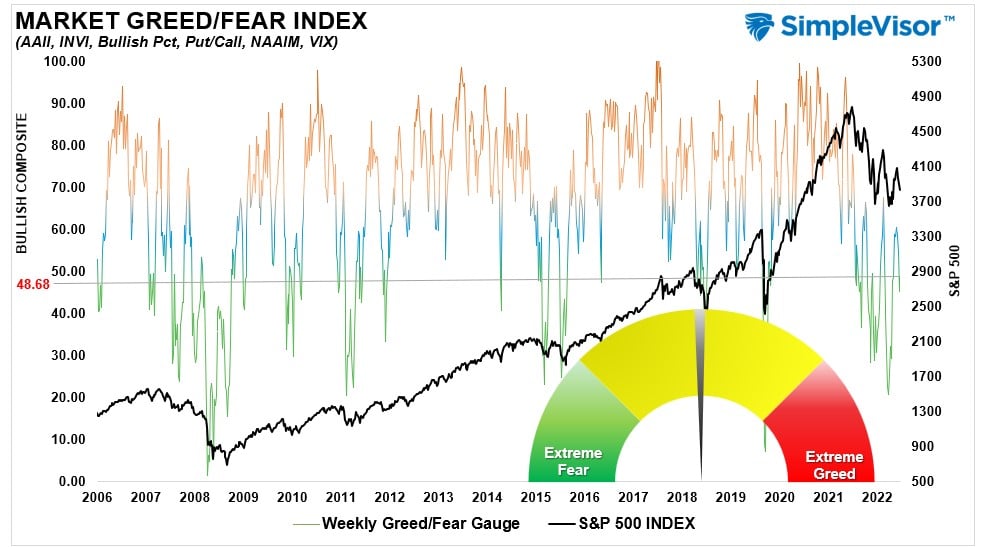
Portfolio Positioning “Fear / Greed” Gauge
The “Fear/Greed” Gauge is how individual and professional investors are “positioning” themselves in the market based on their equity exposure. From a contrarian position, the higher the allocation to equities, the more likely the market is closer to a correction than not. The gauge uses weekly closing data.
NOTE: The Fear/Greed Index measures risk from 0 to 100. It is a rarity that it reaches levels above 90. The current reading is 48.68 out of a possible 100.
Sector Model Analysis & Risk Ranges
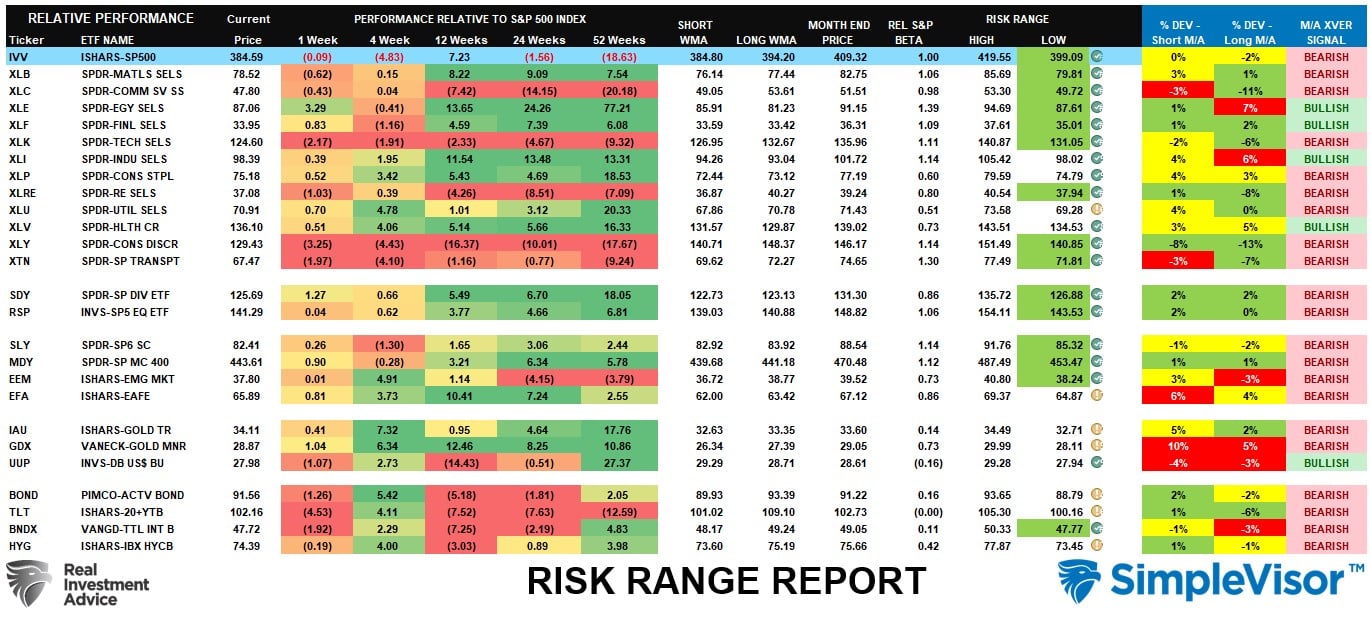
How To Read This Table
- The table compares the relative performance of each sector and market to the S&P 500 index.
- “M” XVER” “Moving Average Cross Over) is determined by the short-term weekly moving average crossing positively or negatively with the long-term weekly moving average.
- The risk range is a function of the month-end closing price and the “beta” of the sector or market. (Ranges reset on the 1st of each month)
- The table shows the price deviation above and below the weekly moving averages.
As noted last week, Bonds were extremely extended after their recent run, and the sell-off last week on the equity side took several sectors and markets below their monthly risk ranges. Such remains the case this week, with the S&P 500, Materials, Communications, Energy, Financials, Technology, Real Estate, Discretionary, Transports, and Small and Mid-cap stocks trading below their normal ranges. Deviations from the long-term moving averages have improved markedly and suggest an improvement in the underly market health. There are now bullish moving average crossovers for Energy, Financials, Industrials, and Utilities.
Weekly SimpleVisor Stock Screens
Each week we will provide three different stock screens generated from SimpleVisor: (RIAPro.net subscribers use your current credentials to log in.)
This week we are scanning for the Top 20:
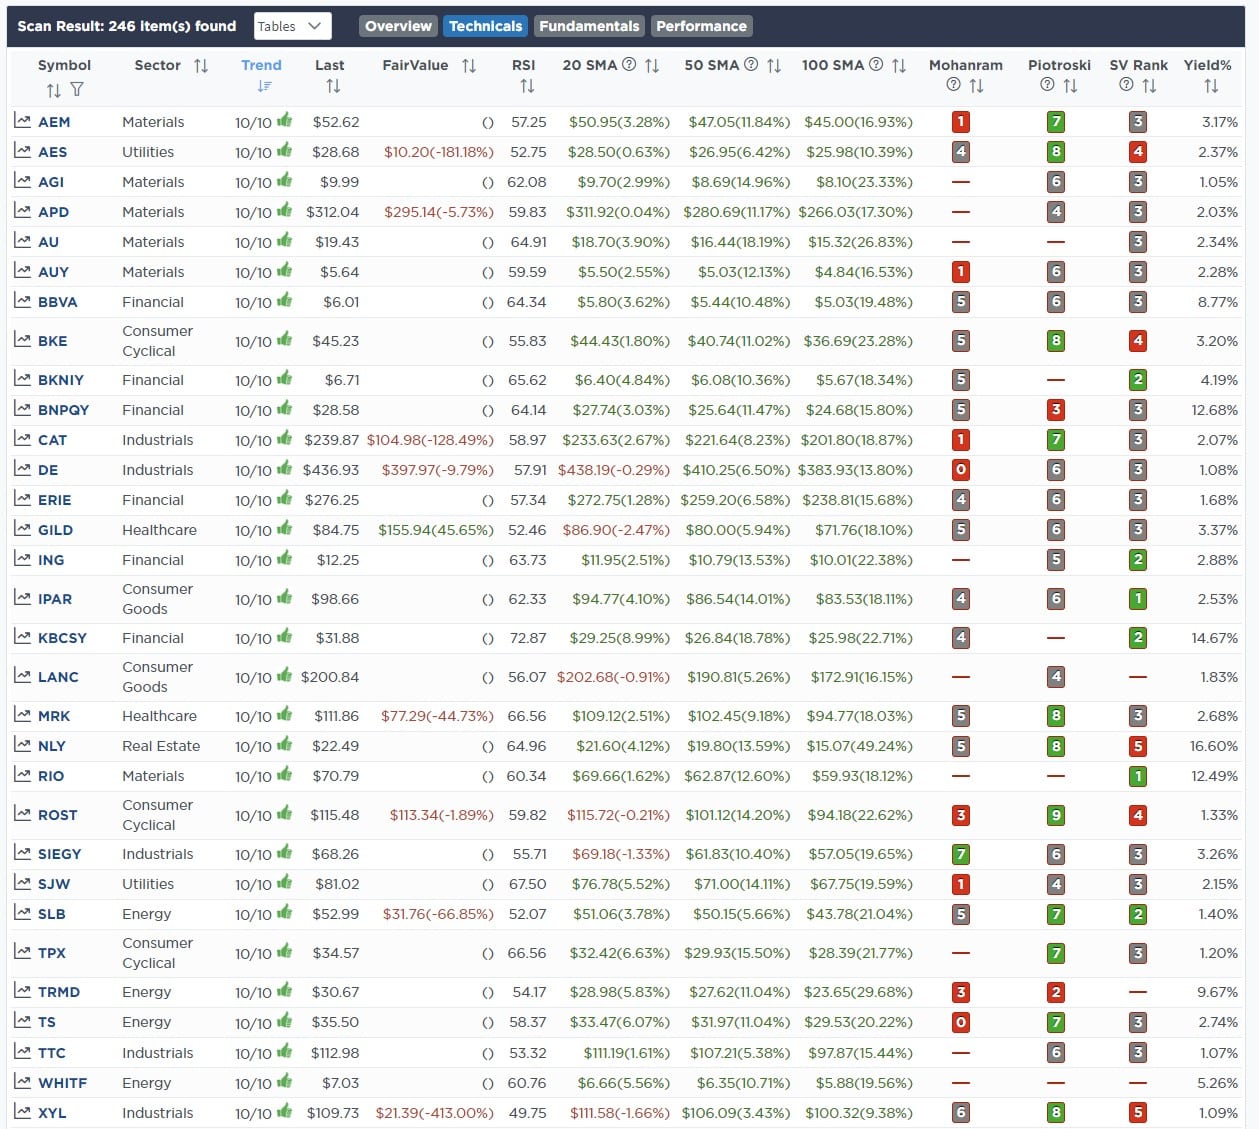
- Relative Strength Stocks
- Momentum Stocks
- Highest Rated Stocks With Dividends
These screens generate portfolio ideas and serve as the starting point for further research.
(Click Images To Enlarge)
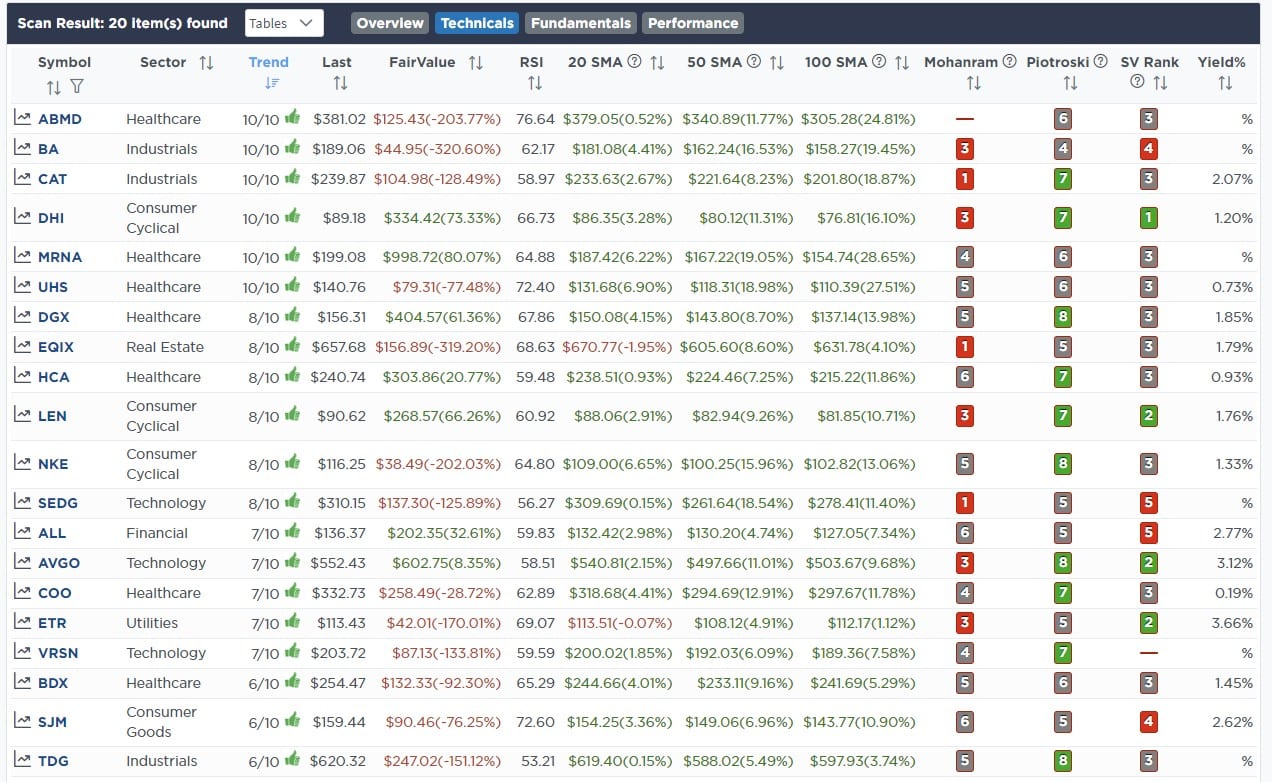
RSI Screen

Momentum Screen
Highest Rated Stocks With Dividends
SimpleVisor Portfolio Changes
We post all of our portfolio changes as they occur at SimpleVisor:
We made no trades in the portfolios this past week.
The equity model is now at 35% equity exposure, and the ETF model is at 40.5%.

Lance Roberts, CIO
Have a great week!


