
Inside This Week’s Bull Bear Report
- Market Review & Update
- Sentiment Index Increases As Stock Prices Rise
- How We Are Trading It
- Research Report – Signs, But No Recession – Yet
- Youtube – Before The Bell
- Stock Of The Week
- Daily Commentary Bits
- Market Statistics
- Stock Screens
- Portfolio Trades This Week
Market Review & Update
As stock prices continue to push higher, investor and consumer sentiment indexes have also risen. As we will discuss in today’s commentary, such should be expected. However, that increase in the sentiment index is also working against the Fed. Such is something Jerome Powell noted this past week during his testimony before Congress. Combined with the Fed’s comments that more rate hikes are likely coming, continued weak economic data and persistent inflationary pressures weighed on the markets this week. As noted last week, such was unsurprising.
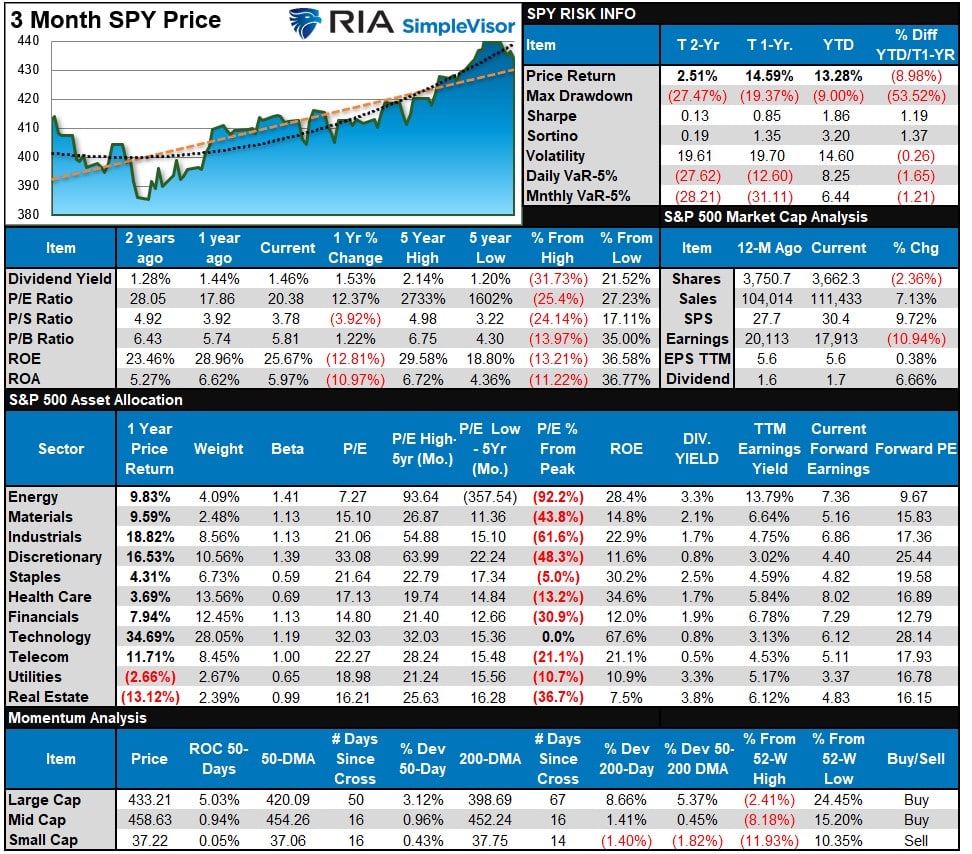
“This past week, the market pushed well past our previous price target and is moving well into 3-standard deviations above the 50-DMA. Furthermore, the market is very overbought on multiple levels. Lastly, the volatility index is at extremely low levels, which has almost uniformly preceded corrections of 5-10% during both bull and bear markets.“
This is the attendant chart from last week. Specifically, take note of the more extreme reading of the top and bottom indicators.
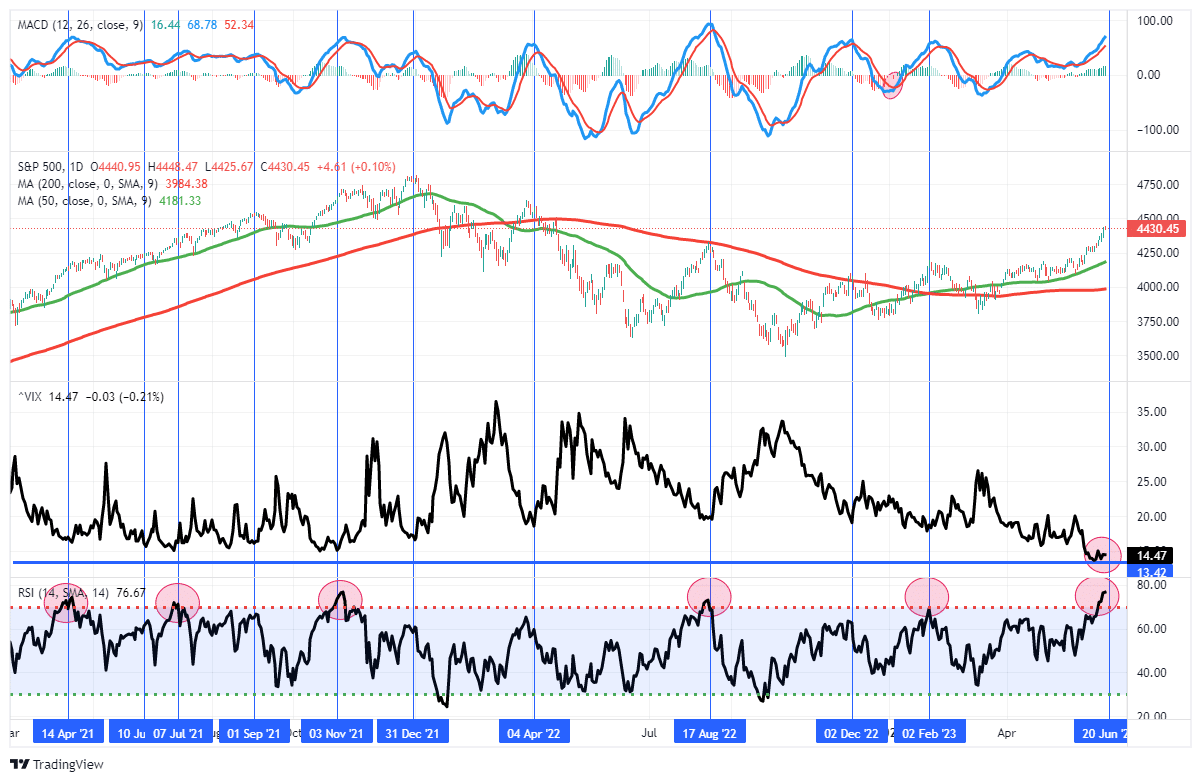
This week’s correction has pushed our buy signals close to confirmed sell signals. Notably, should these sell signals trigger, such will occur from fairly elevated levels suggesting a more protracted correction or consolidation ahead.
Another concern we have about the current rally is the collapse in market volatility. While there is strong momentum, and bullish psychology, behind the rally, extremely low volatility readings tend to align with short-term market peaks and corrections.
With bullish sentiment pushing into “extreme greed” territory, this past week’s correction did little to resolve the bullish, overbought, and deviated conditions. With the end of the quarter approaching, we could see additional selling pressure this coming week as managers rebalance portfolios for second-quarter reporting. Furthermore, July tends to be one of the weaker trading months of the year, and following a strong May and June, a respite should be expected.
However, corrections to previous support levels should be used to add equity exposure opportunistically. With sentiment indexes improving, such continues to suggest the October lows were the bottom of the correction. That is until something changes.
Need Help With Your Investing Strategy?
Are you looking for complete financial, insurance, and estate planning? Need a risk-managed portfolio management strategy to grow and protect your savings? Whatever your needs are, we are here to help.

Recessionus Terribulus
“A funny thing happened on the way to the Coliseum” is a hysterical play by Craig Sodaro. In the play, Simplcuss, a naive Swiss farmer, heads for Rome to follow his dream of becoming a stand-up comedian; little does he know what adventures are in store for him. Stumbling into the house of General Spurius Sillius in search of food and water, he’s mistaken for the dreaded gladiator, Terribilus, who is due to fight in the Colosseum the following day. Simplcuss has to figure out how to save himself, and he overhears the General’s wife, Drusilla, and Senator Publius Piscious plotting to kill the Emperor’s daughter and the Emperor himself!
Without telling you the ending, there are many similarities to the market currently. Over the last several months, the media headlines have been filled with stories of “Recessionus Terribulus,” as the Fed engaged in the most aggressive rate hiking campaign in history. As we noted in Friday’s #MacroView blog, the recession indicators are still abundant.
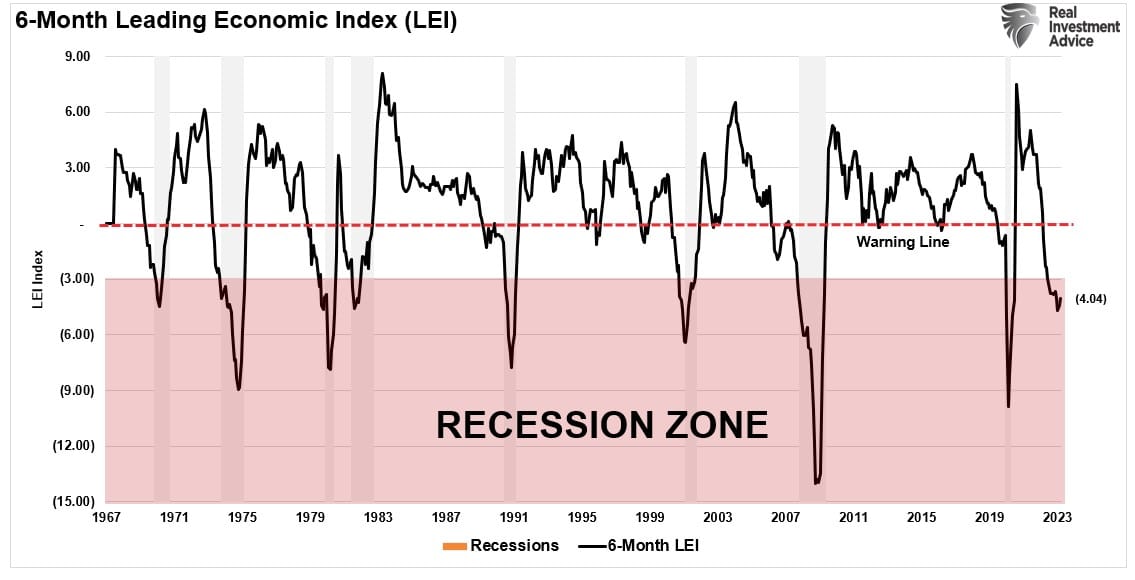
“The 6-month rate of change (ROC) in the Conference Boards Leading Economic Index (LEI) further supports that recession warning from the ISM composite index. Since 1967, a recession has occurred when the 6-month ROC fell below -3%. This indicator has the most infallible record of all the recession indicators we track.”
“Furthermore, our Economic Output Composite Index (EOCI), which comprises more than 100 different leading, lagging, services, and manufacturing data points, also warns of a recession. Like the LEI, the index has a strong track record of predicting recessions.”
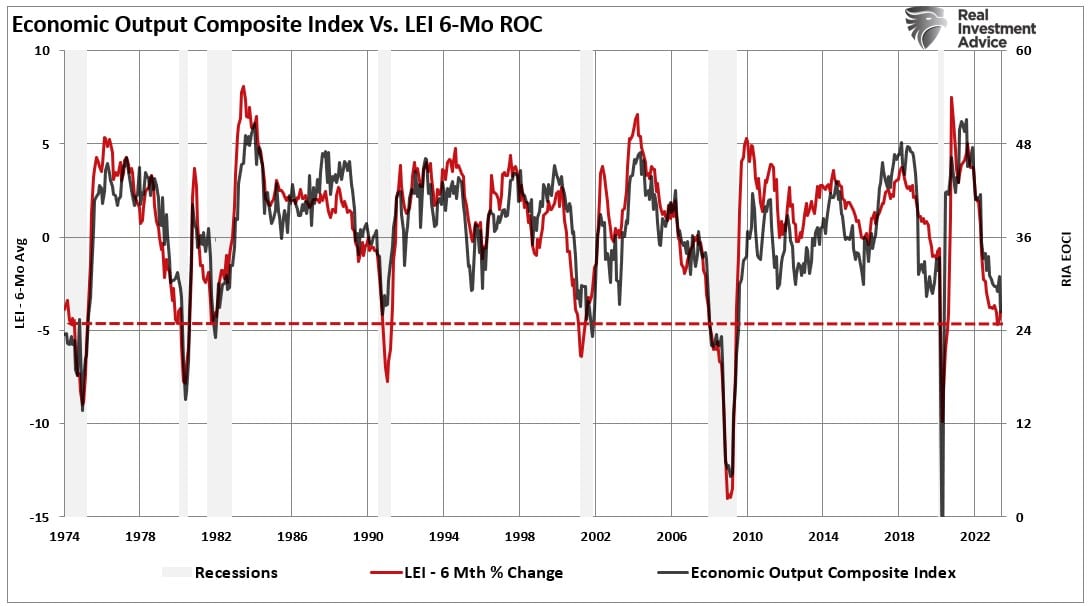
“Given the weight of the evidence, a recession seems assured. Yet employment remains robust and economic activity, in terms of GDP, remains in positive territory. This has led many analysts and economists to hope that “this time is different” and that a recession may be avoided entirely.”
However, what is interesting, is that despite these and several other indicators clearly suggesting recessionary risk, the financial markets are currently putting in one of the best return years seen in the last decade. More importantly, investor sentiment, which was highly bearish last year, has become aggressively bullish.
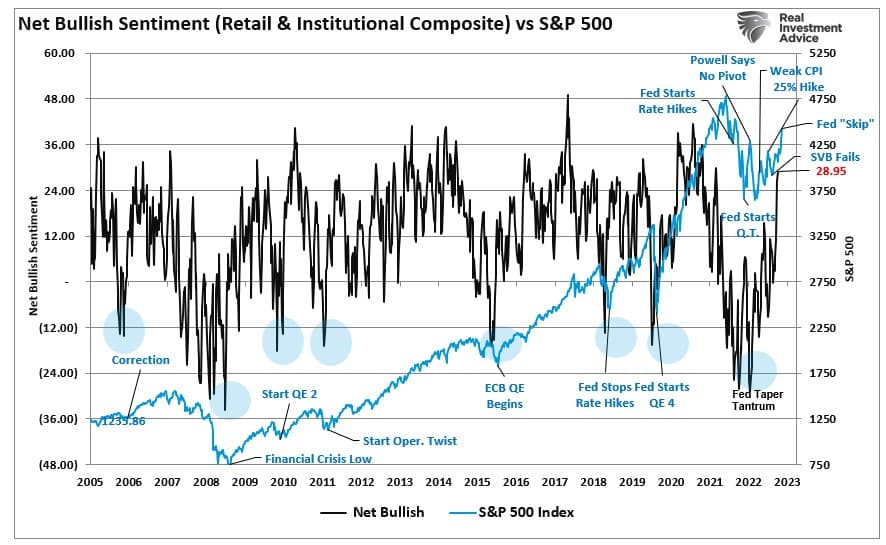
More notably, it isn’t just investors becoming more optimistic. The consumer sentiment index is also increasing.
Consumer Sentiment Follows Suit
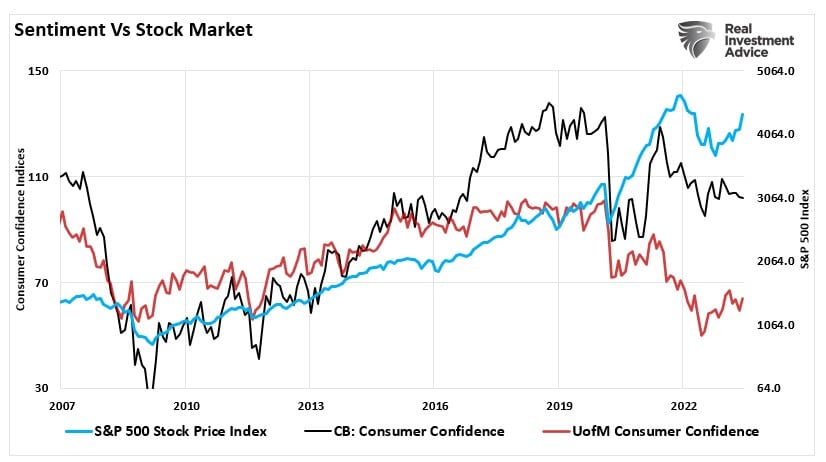
Both economists and market analysts use two different primary consumer sentiment indexes. The first consumer sentiment index is provided by the University of Michigan. The second sentiment index is from the Conference Board.
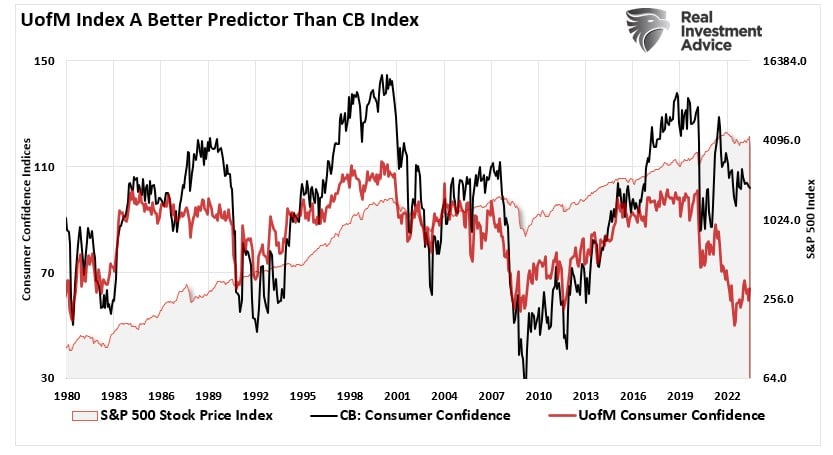
As you can see, while the two indices track each other over time, significant divergences tend to occur. To remove those divergences, we created a composite sentiment index that combines the two measures, as shown below.
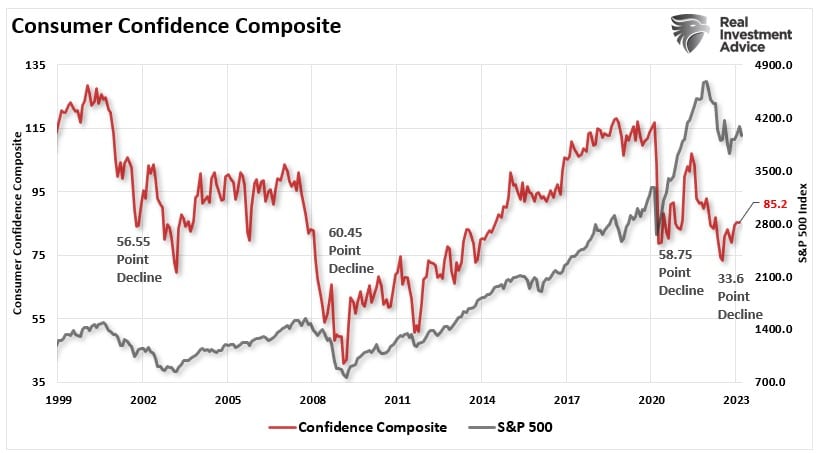
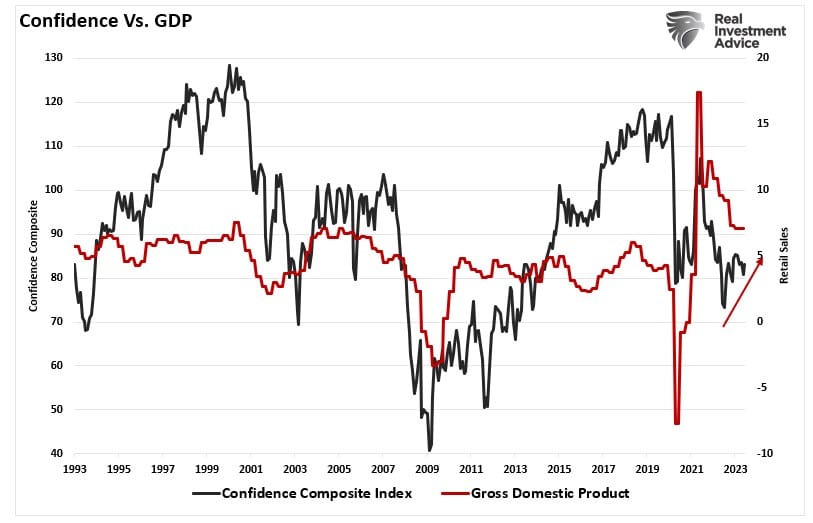
When looking at the composite index, we see declines in the composite sentiment index correlate to financial market declines. The opposite is also apparent. Such makes sense when you consider that changes to financial wealth affect consumer psychology. When wealth declines, consumer spending contracts, slowing economic growth and earnings. As such, financial market declines are logical. When financial wealth rises, consumers “feel wealthier” and are more willing to make expenditures.
Ben Bernanke popularized this “wealth effect” in 2010 when he launched the second round of “Quantitative Easing.”
“This approach eased financial conditions in the past and, so far, looks to be effective again. Stock prices rose, and long-term interest rates fell when investors began to anticipate this additional action. Easier financial conditions will promote economic growth. For example, lower mortgage rates will make housing more affordable and allow more homeowners to refinance. Lower corporate bond rates will encourage investment. And higher stock prices will boost consumer wealth and help increase confidence, which can also spur spending. Increased spending will lead to higher incomes and profits that, in a virtuous circle, will further support economic expansion.” – Ben Bernanke, Washington Post Op-Ed, November, 2010.
As shown, there is a very high correlation between the Fed’s balance sheet expansion and the financial markets.
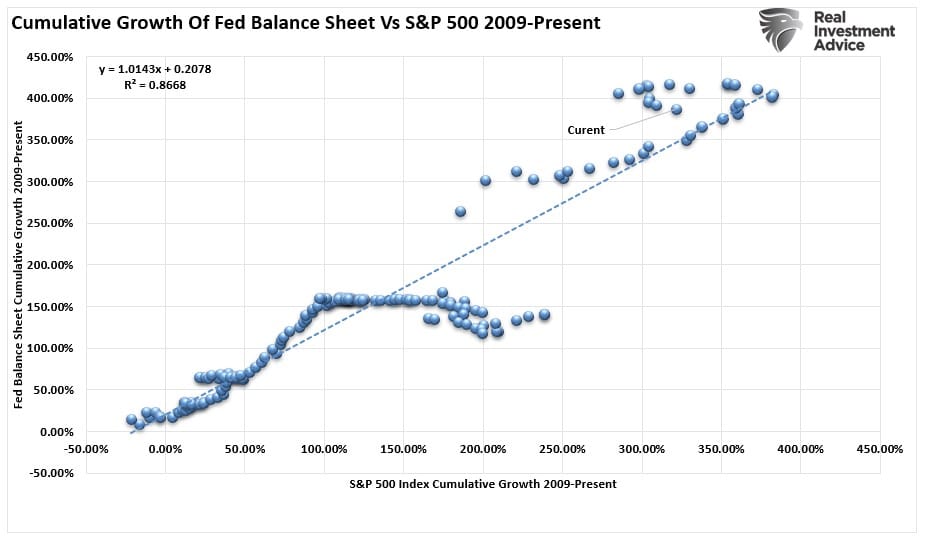
The correlation is not surprising.
Classical conditioning (also known as Pavlovian or respondent conditioning) refers to a learning procedure in which a potent stimulus (e.g., food) becomes paired with a previously neutral stimulus (e.g., a bell). Pavlov discovered that when he introduced the neutral stimulus, the dogs would begin to salivate in anticipation of the potent stimulus, even though it was not currently present. This learning process results from the psychological “pairing” of the stimuli.
This conditioning is what happened to investors over the last decade.
Undermining The Fed
Notably, for conditioning to work, the “neutral stimulus,” when introduced, must get followed by the “potent stimulus” for the “pairing” to complete. For investors, as the Fed introduced each round of “Quantitative Easing,” the “neutral stimulus,” the stock market rose, the “potent stimulus.”
That linkage is now complete, and as shown, the rally from the October lows corresponds to the increased liquidity in the financial markets.
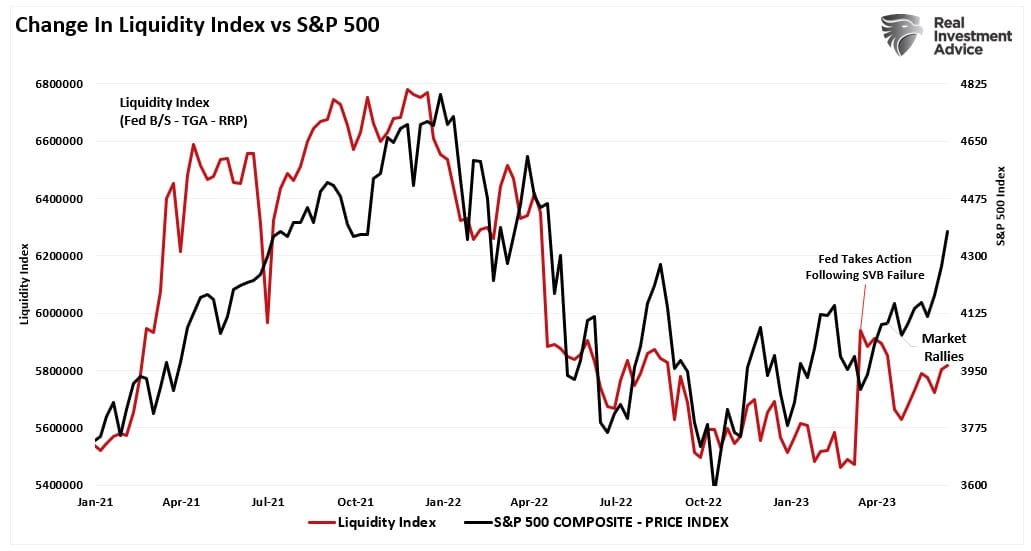
With the “wealth effect” now well entrenched over the last decade, the rally in the stock market is now feeding into both consumer sentiment indexes, which bottomed in October.
As shown, improving consumer sentiment does suggest more robust economic growth in the quarters ahead. However, that growth undermines the Fed’s mission of combatting inflation.
Furthermore, higher asset prices represent a looser, not tighter, monetary policy. Rising asset prices boost consumer confidence and act to ease the very financial conditions the Fed is trying to tighten. Such is why it was hardly surprising to see Jerome Powell strike back at the markets at this week’s Congressional testimony.
“Inflation pressures continue to run high, and the process of getting inflation back down to 2 percent has a long way to go. Nearly all [officials] expect that it will be appropriate to raise interest rates somewhat further by the end of the year.”
Critically, reducing inflation will require slower economic growth and “softening of labor market conditions.” Such will also translate into weaker corporate earnings as consumer spending contracts. Such will be in response to higher levels of unemployment.
“The economy is facing headwinds from tighter credit conditions for households and businesses, which are likely to weigh on economic activity, hiring, and inflation though the extent to which remains uncertain.”
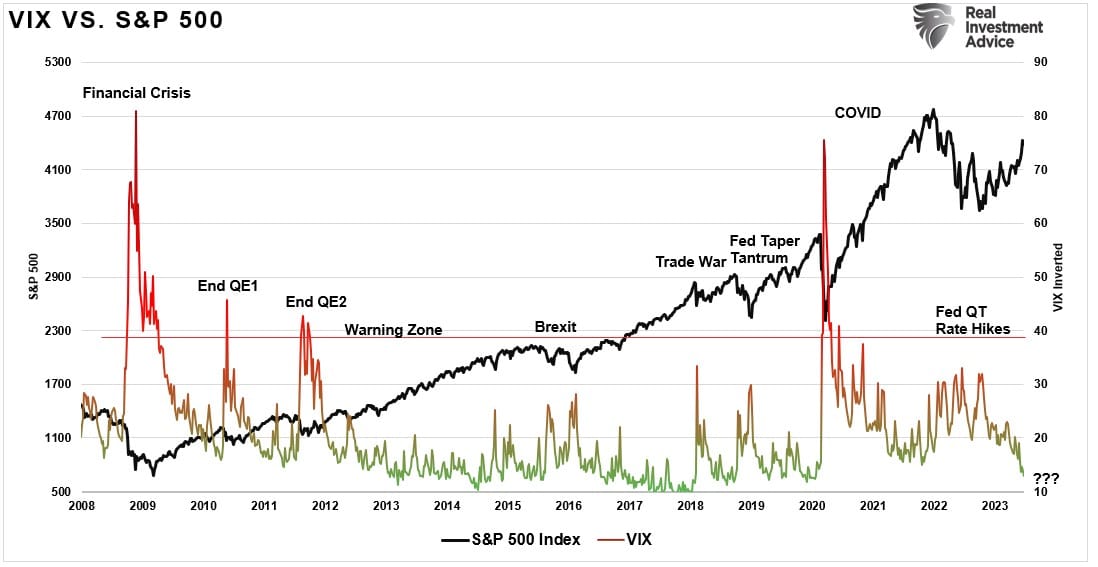
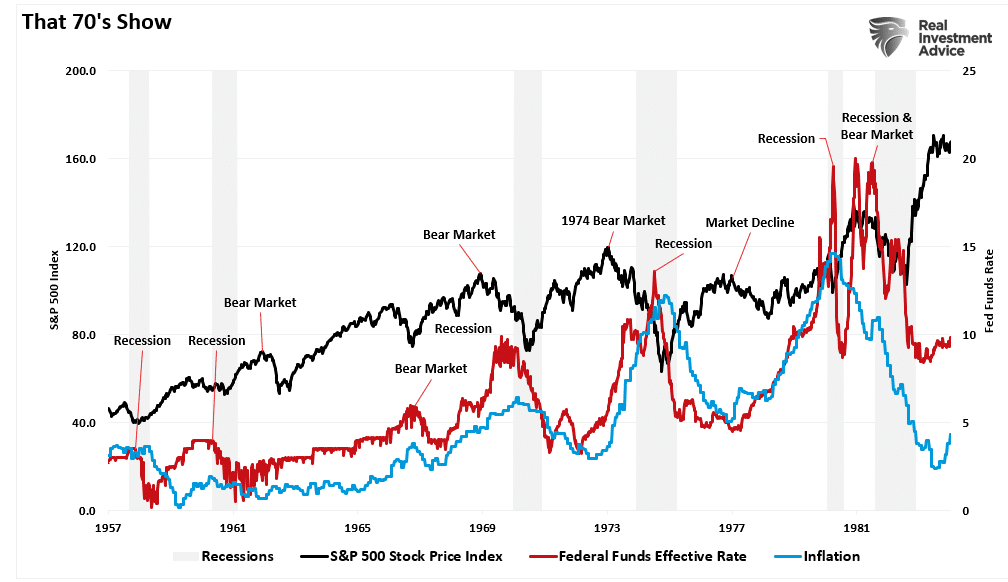
For the Federal Reserve, their primary concern remains a resurgence of inflation, as was seen in the 1970s. As shown, repeated bouts of inflationary pressures spurred repeated market events and recessions. If the Fed eases monetary conditions too soon, they run the risk of another inflation surge in the economy.
If consumer sentiment continues to improve and asset prices increase, consumer demand will follow. That increased demand is inflationary as it will stabilize prices at higher levels.
Such will keep the Fed focused on quelling inflation at the expense of the market.
How We Are Trading It
While investors and consumers ignore the Fed, there can only be one “winner” in this contest. While we are certainly more bullishly positioned near term, the risk of “something breaking” has not been entirely resolved.
Statistically, mounting evidence shows that October marked the low of the current market cycle. However, such does not mean that a meaningful decline can’t occur within the context of a “new bull market” if Fed resumes a more aggressive stance. As such, we continue to make tiny moves to align the risk profile of portfolios to the market. Given the recent buy signals from our indicators, we increased exposure but are looking for pullbacks to support providing better risk/reward entry points for further additions.
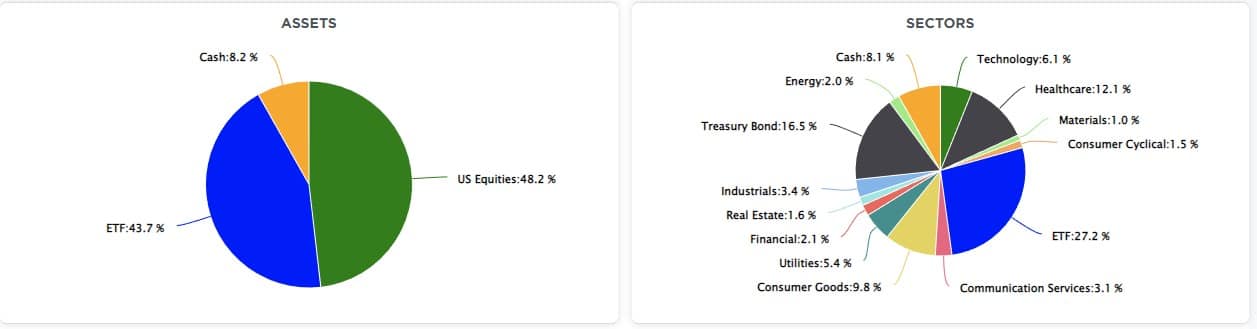
We remain underweight in overall equity exposure and overweight in defensive, value-oriented positions. Such will protect the portfolio from any short-term market declines, at which time we will use our existing cash holdings to increase our cyclical exposure accordingly.
While this has been a tough market to navigate this year, the risks remain prevalent despite the broader market seemingly ignoring them. We suggest focusing on risk management over chasing market returns for now.
- Tighten up stop-loss levels to current support levels for each position.
- Hedge portfolios against potential market declines.
- Take profits in positions that have been big winners
- Sell laggards and losers.
- Raise cash and rebalance portfolios to target weightings.
Have a great week.
Research Report
Subscribe To “Before The Bell” For Daily Trading Updates (Formerly 3-Minutes)
We have set up a separate channel JUST for our short daily market updates. Please subscribe to THIS CHANNEL to receive daily notifications before the market opens.
Click Here And Then Click The SUBSCRIBE Button
Subscribe To Our Youtube Channel To Get Notified Of All Our Videos
Bull Bear Report Market Statistics & Screens

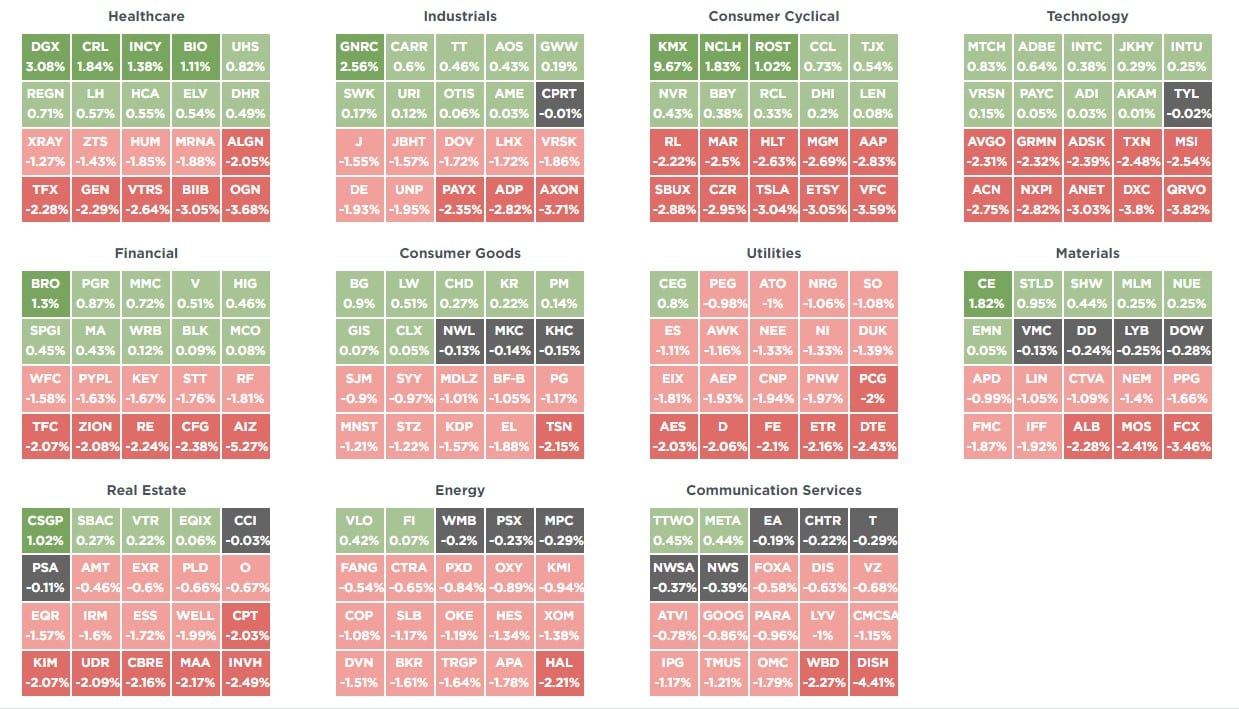
SimpleVisor Top & Bottom Performers By Sector
S&P 500 Weekly Tear Sheet
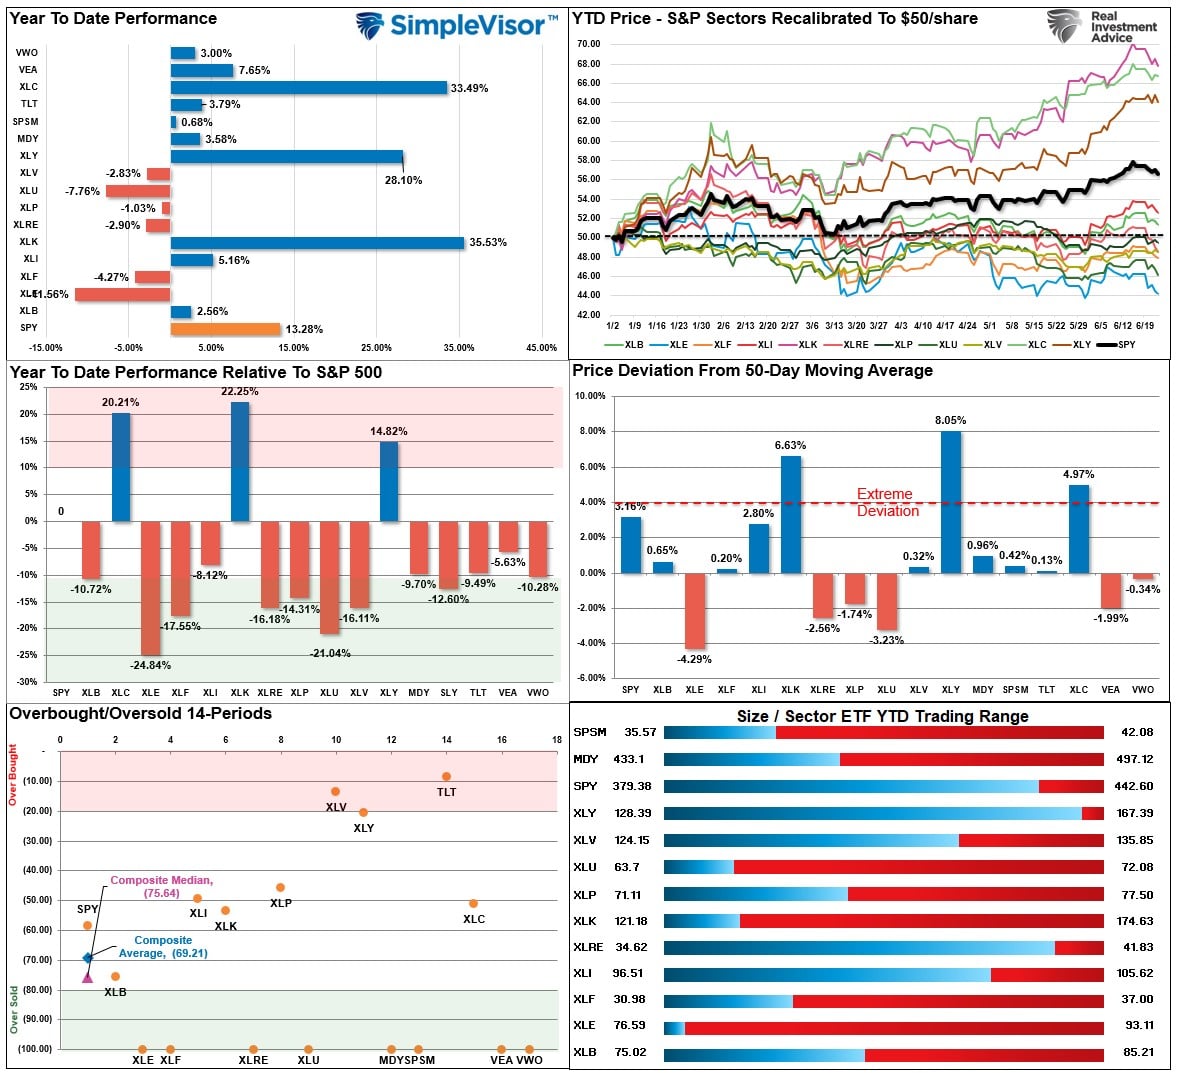
Relative Performance Analysis
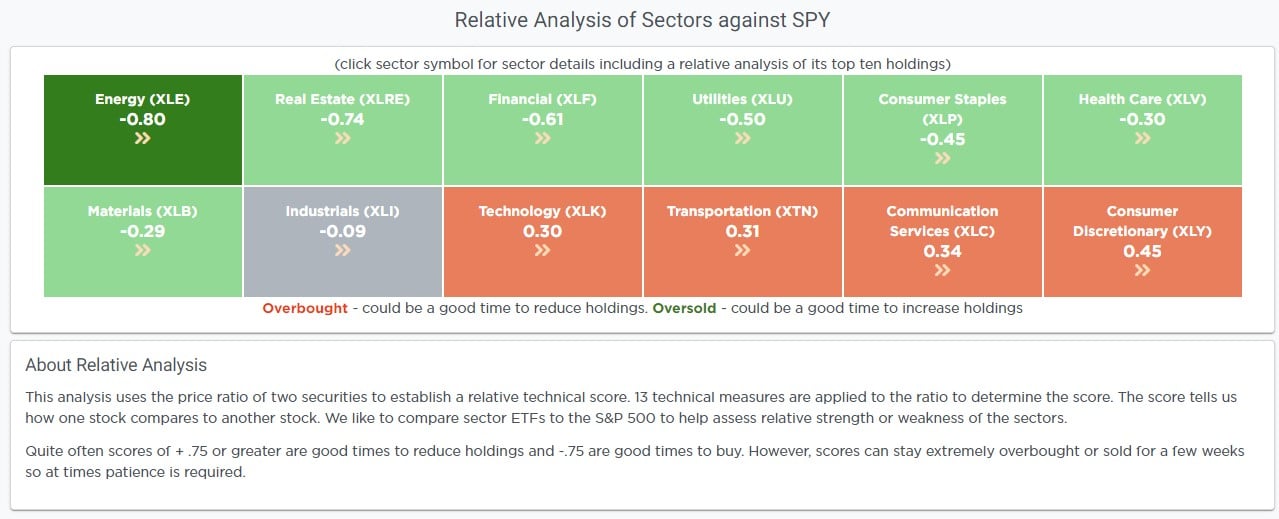
Last week we noted that “the market is broadly overbought and needs a pullback after last week’s surge, and most sectors are now stretched above their moving averages. Performance is still highly bifurcated between Technology, Communications, Discretionary, and everything else.“
This past week, the expected correction began to correct some of the more extreme short-term overbought conditions. While some sectors and markets are now oversold, there is still more work to do short-term, so while a bounce is likely next week, prices likely have to work themselves lower.
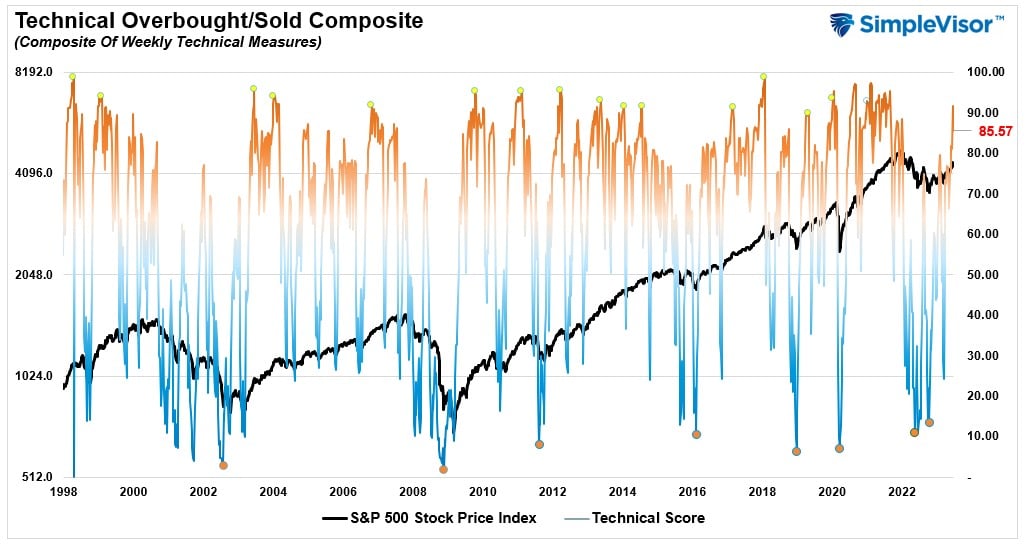
Technical Composite
The technical overbought/sold gauge comprises several price indicators (R.S.I., Williams %R, etc.), measured using “weekly” closing price data. Readings above “80” are considered overbought, and below “20” are oversold. The market peaks when those readings are 80 or above, suggesting prudent profit-taking and risk management. The best buying opportunities exist when those readings are 20 or below.
The current reading is 85.57 out of a possible 100.
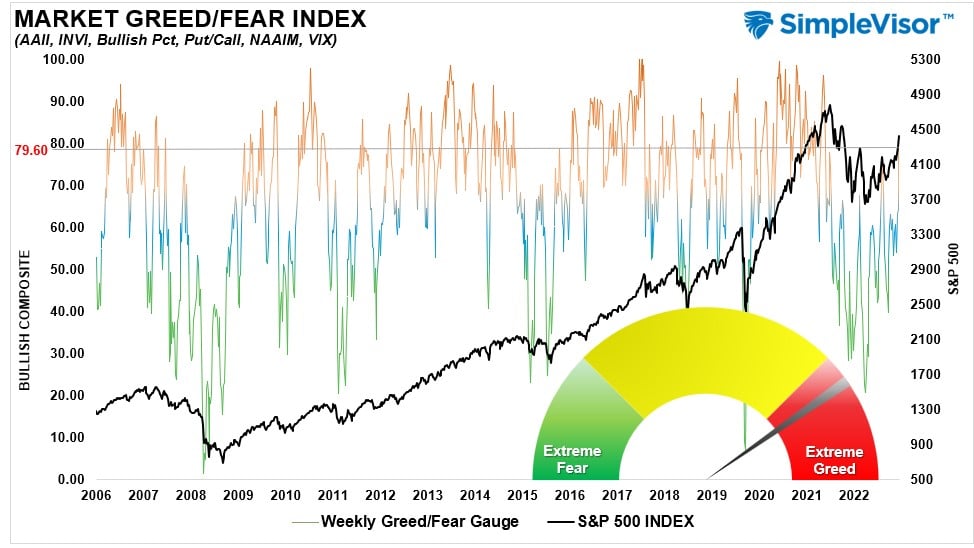
Portfolio Positioning “Fear / Greed” Gauge
The “Fear/Greed” gauge is how individual and professional investors are “positioning” themselves in the market based on their equity exposure. From a contrarian position, the higher the allocation to equities, the more likely the market is closer to a correction than not. The gauge uses weekly closing data.
NOTE: The Fear/Greed Index measures risk from 0 to 100. It is a rarity that it reaches levels above 90. The current reading is 79.60 out of a possible 100.
Relative Sector Analysis
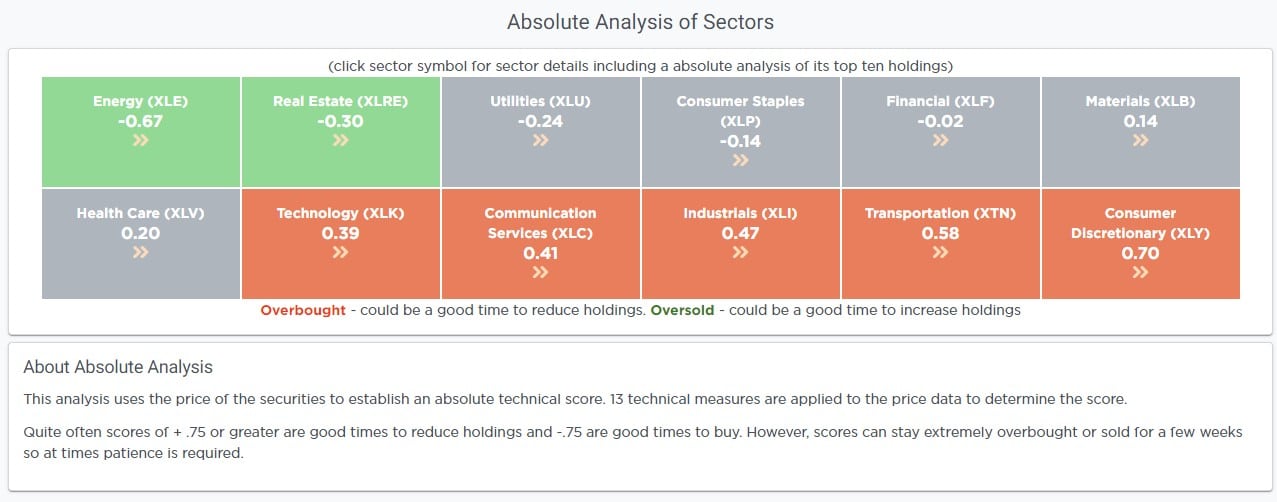
Absolute Sector Analysis
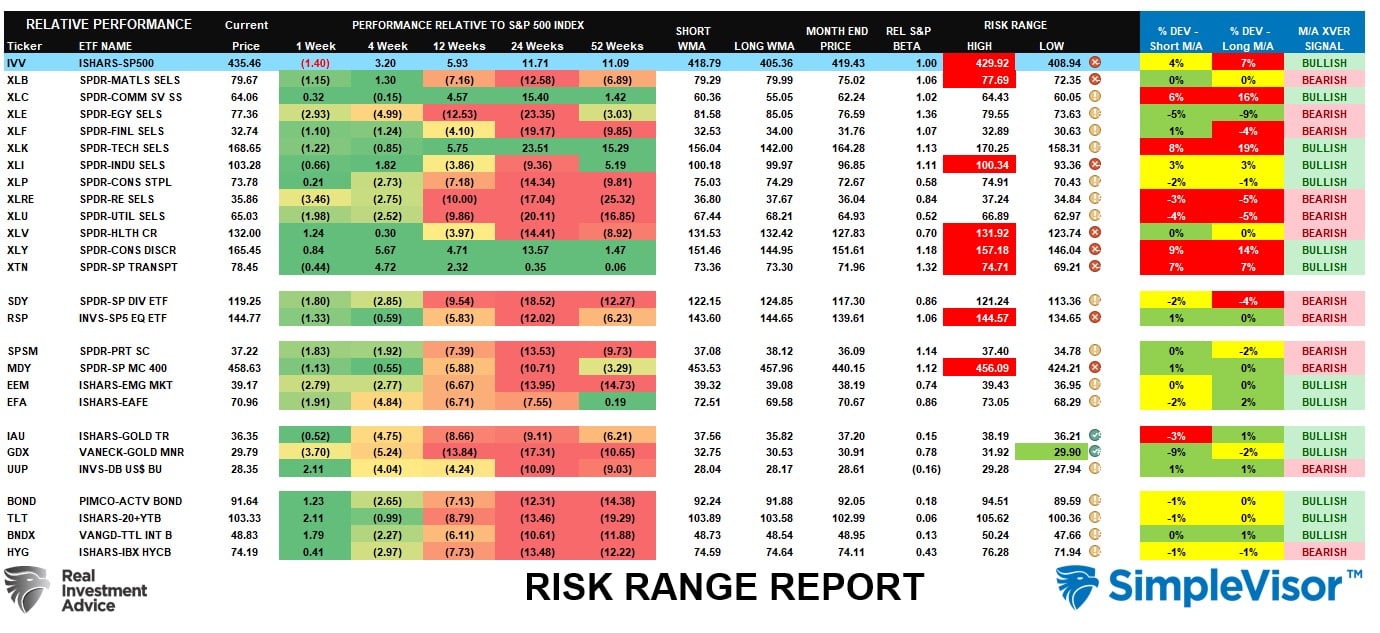
Sector Model Analysis & Risk Ranges
How To Read This Table
- The table compares the relative performance of each sector and market to the S&P 500 index.
- “MA XVER” (Moving Average Cross Over) is determined by the short-term weekly moving average crossing positively or negatively with the long-term weekly moving average.
- The risk range is a function of the month-end closing price and the “beta” of the sector or market. (Ranges reset on the 1st of each month)
- The table shows the price deviation above and below the weekly moving averages.
As stated last week, “The push to 4400 has pushed most sectors into more extreme overbought levels for the month. Combined with very overbought readings in our technical gauge above, the market is due for a pullback.” Some of that deviation has been corrected, but there is still more work to do in the broad market. Notably, as shown by the S&P Equal Weight Index now above normal ranges, the market rally broadened as expected.
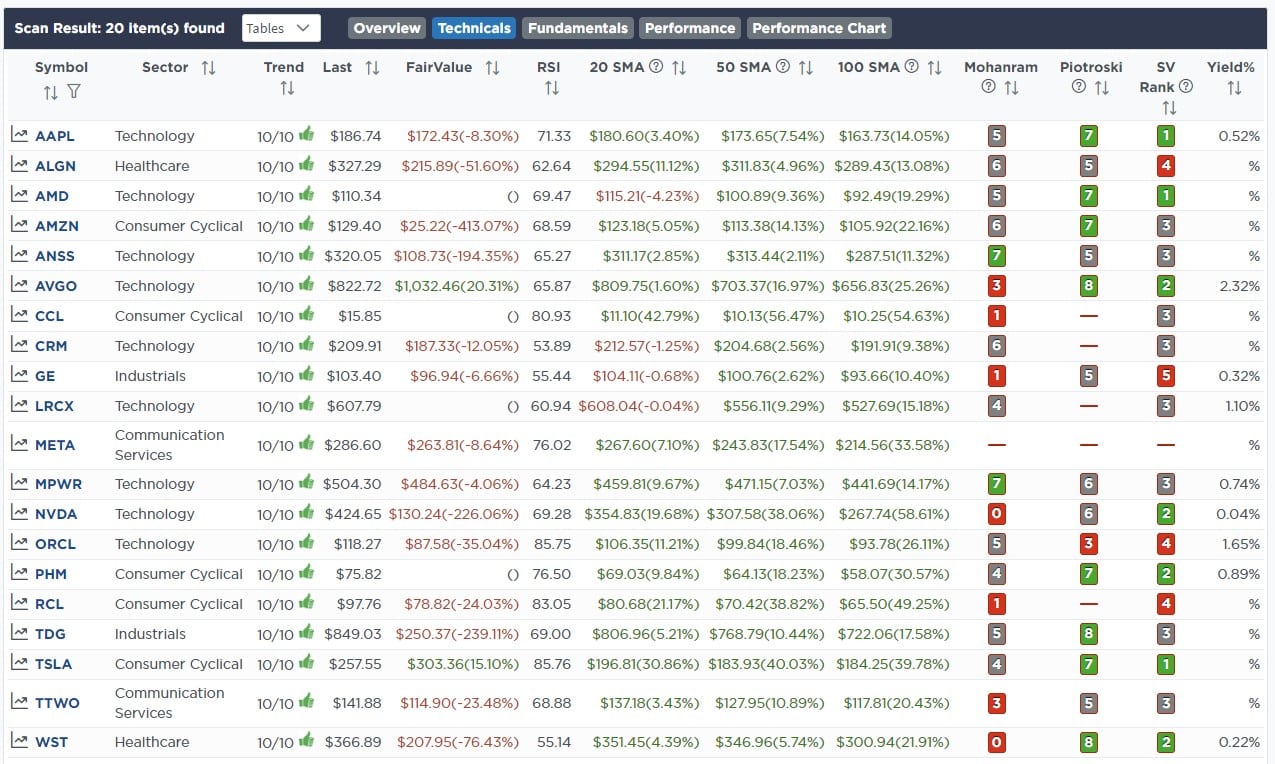
Weekly SimpleVisor Stock Screens
We provide three stock screens each week from SimpleVisor.
This week we are searching for the Top 20:
- Relative Strength Stocks
- Momentum Stocks
- Technically Strong Stocks With Dividends
(Click Images To Enlarge)
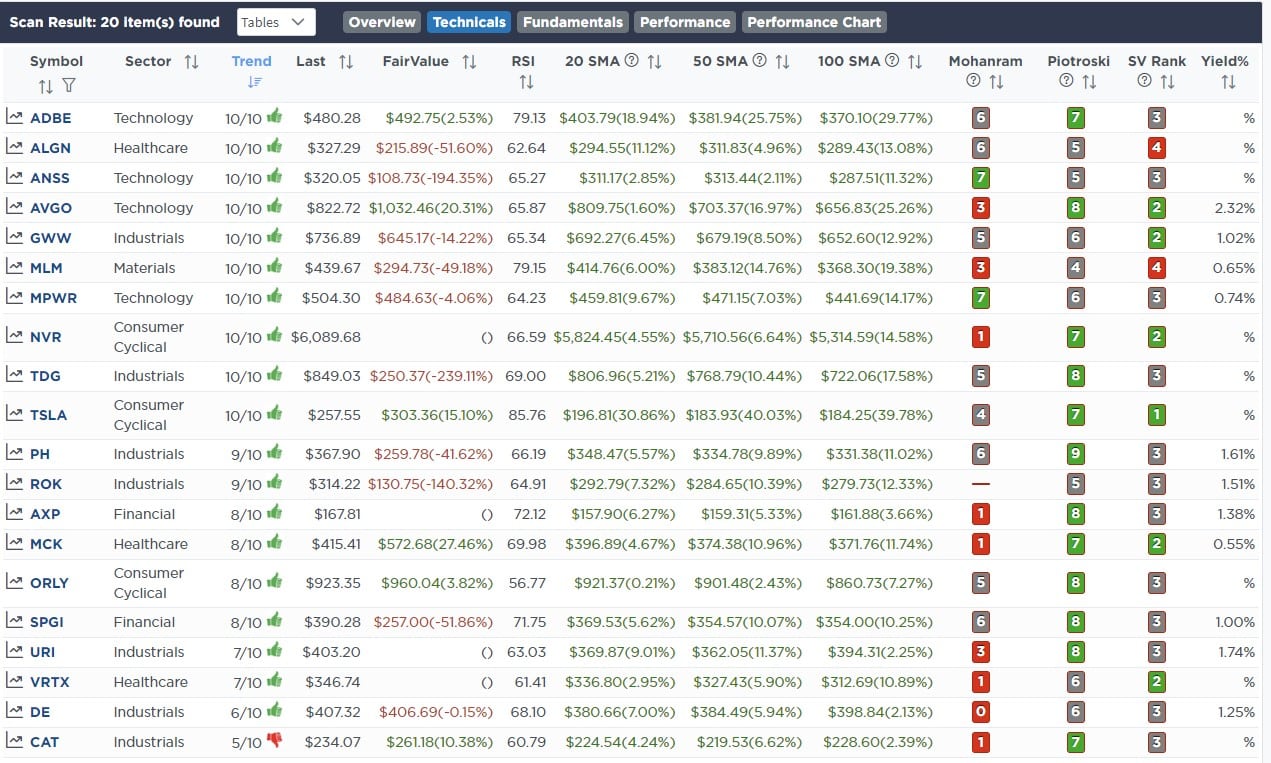
R.S.I. Screen
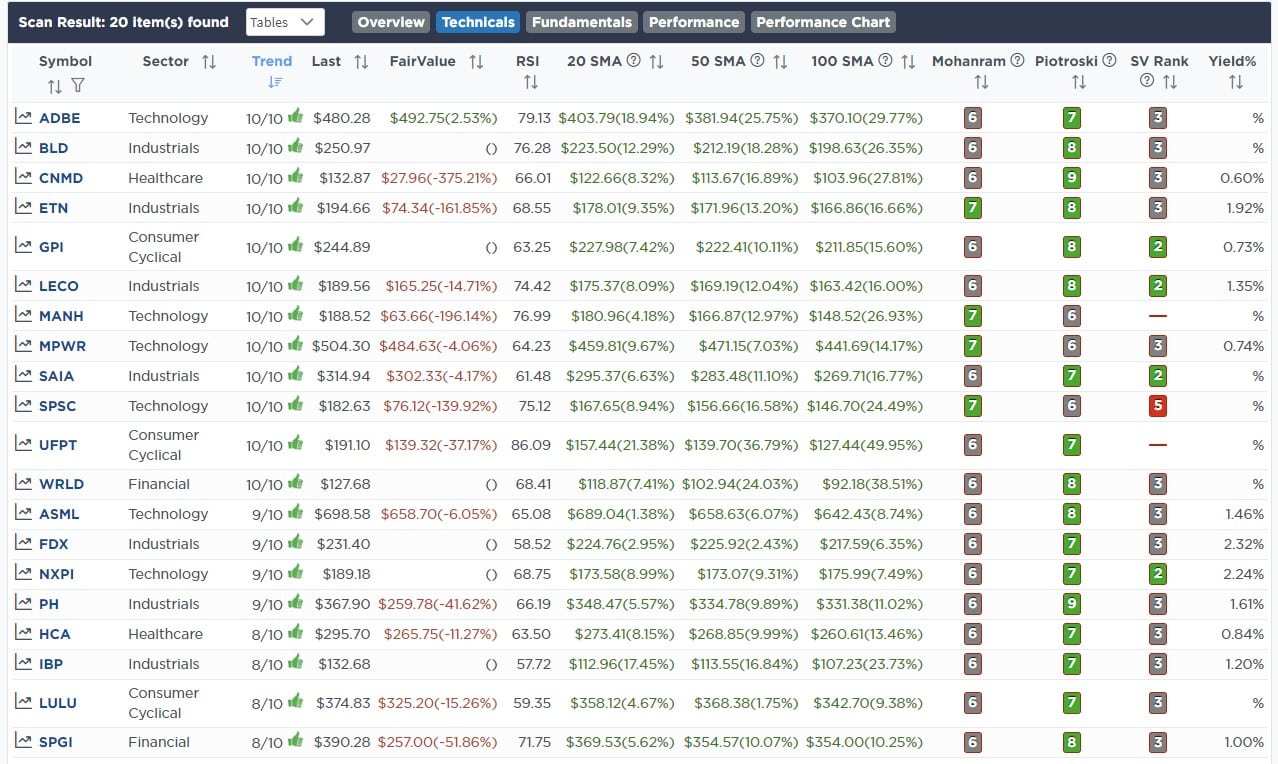
Momentum Screen
Technically Strong With Dividends
SimpleVisor Portfolio Changes
We post all of our portfolio changes as they occur at SimpleVisor:
No Trades This Week

Lance Roberts, C.I.O.
Have a great week!

