
Inside This Week’s Bull Bear Report
- Bulls Betting On No Recession
- Bulls Struggle Ignore The Fed
- How We Are Trading It
- Research Report – Bullish Investors Continue To Fight The Fed
- Youtube – Before The Bell
- Stock Of The Week
- Daily Commentary Bits
- Market Statistics
- Stock Screens
- Portfolio Trades This Week
Bulls Betting On No Recession
In last week’s message, we discussed the bulls were ignoring the Fed’s continued hawkish stance on monetary policy. We were also concerned that the correction had likely started in the short term as our MACD sell signal had triggered. To wit:
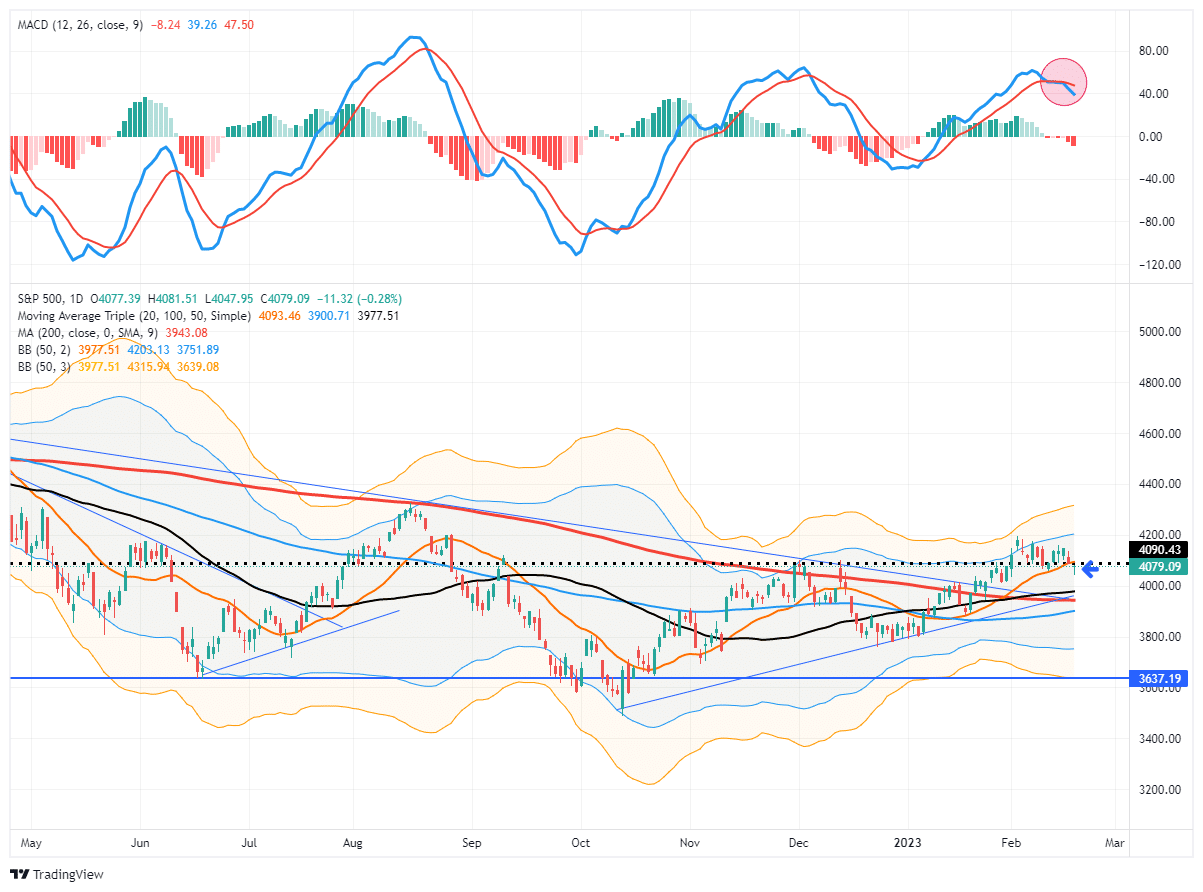
“The commentary remains vital to this week’s analysis as our primary short-term “sell” indicator has been triggered for the first time since early December. While that sell signal does NOT mean the market is about to crash, it does suggest that over the next couple of weeks to months, the market will likely consolidate or trade lower. Such is why we reduced our equity risk last week ahead of the Fed meeting.”
As shown, the bullish action of the market was evident all week as markets would open lower and then rally into the day’s close. With the market hugging the 20-DMA, that initial support level remained consistent all week. However, as shown, it is not uncommon for the market to hold up initially when the “sell signal” is triggered. Much like a car rolling downhill when the brakes are applied, it takes time to slow the previous momentum to a stop. The “sell signal” suggests that momentum is slowing, and it is likely that sellers will overtake buyers soon.
However, on Friday, the market cracked that initial support at the 20-DMA as the MACD signal deepened. While the market did rally into Friday’s close, suggesting the bullish bias remains, this is the first sign of a potential retest of the multiple support levels clustered around the 3950-4000. If the market can hold those levels, such will be an opportunity to increase equity exposure. A failure of that support will suggest a deeper correction is at work.
As we will discuss in today’s newsletter, the economic data has supported the bullish case of a “no landing” scenario. That scenario assumes the economy avoids a recession entirely, allowing earnings to start growing again in the second half of the year. That somewhat optimistic scenario is heavily at odds with a Federal Reserve focused on slowing inflation which is only achieved by reducing economic demand through tighter monetary policy.
No Recession Bet Seems Unlikely
While markets are rallying short-term, history suggests that equities will not be able to fend off higher rates indefinitely. Such is particularly the case with the 2-year Treasury rate, which correlates with changes to Fed policy. It also suggests that interest servicing on consumer debt will become more problematic over the next several quarters as individuals run out of savings.
While the bulls are betting on a “no recession” scenario, history suggests such an outcome is unlikely to be the case. However, for now, the bulls continue to ignore the Fed.
Need Help With Your Investing Strategy?
Are you looking for complete financial, insurance, and estate planning? Need a risk-managed portfolio management strategy to grow and protect your savings? Whatever your needs are, we are here to help.

The Bulls Ignore The Fed
We recently discussed that market bulls continue to fight the Fed.
“It is not surprising that stocks came under pressure last year as the Fed started hiking interest rates aggressively and the process of reducing its previous influx of monetary support.
Yet, instead of bullish investors sticking with their mantra of “Don’t Fight The Fed,” it is now a standoff between the bulls and the Fed. After a tough year in the markets, the hope for 2023 is that the Fed will “pivot” in its monetary policy campaign and begin to ease by mid-year. As Tom Lee of FundStrat noted;
‘Historical data shows there is a high chance that the U.S. stock market may record a return of 20% or more this year after the three major indexes closed 2022 with their worst annual losses since 2008.’
While the bulls cling to historical statistics about market returns, the problem is the Fed remains clear that it will not back off its current inflation fight.”
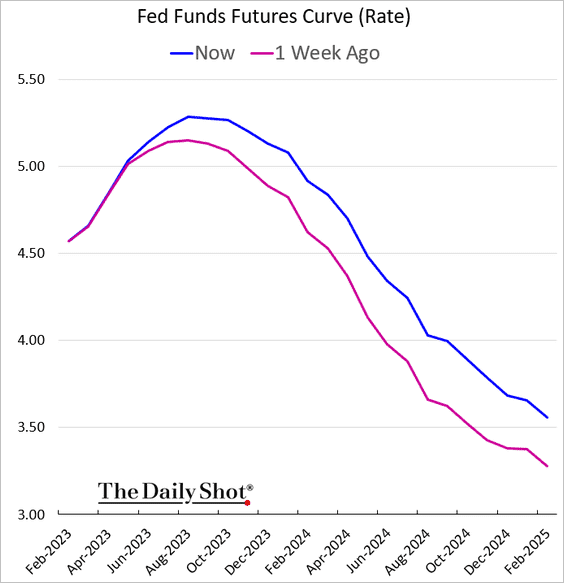
As we have noted previously, the bulls seemingly have a rather misplaced confidence in the Fed cutting rates. But that is what the Fed funds futures currently show as the market expects rate cuts to start by mid-year. While the expectation of the terminal rate shifted with the recent inflation report, the back of the year is a steep rate-cutting cycle.
However, here is the question the bulls should be asking:
What would cause the Fed to cut rates?
- If the market advance continues and the economy avoids recession, there is no need for the Fed to reduce rates.
- More importantly, there is also no reason for the Fed to stop reducing liquidity via its balance sheet.
- Also, a soft-landing scenario gives Congress no reason to provide fiscal support providing no boost to the money supply.
See the problem with the “pivot” scenario?
However, given the recent spate of economic data from the strong jobs report in January, a 0.5% increase in inflation and a solid retail sales report continue to give the Fed no reason to pause anytime soon. If this environment continues, the Fed will continue reducing its balance sheet and maintain interest rates a the terminal rate of 5-5.25%.
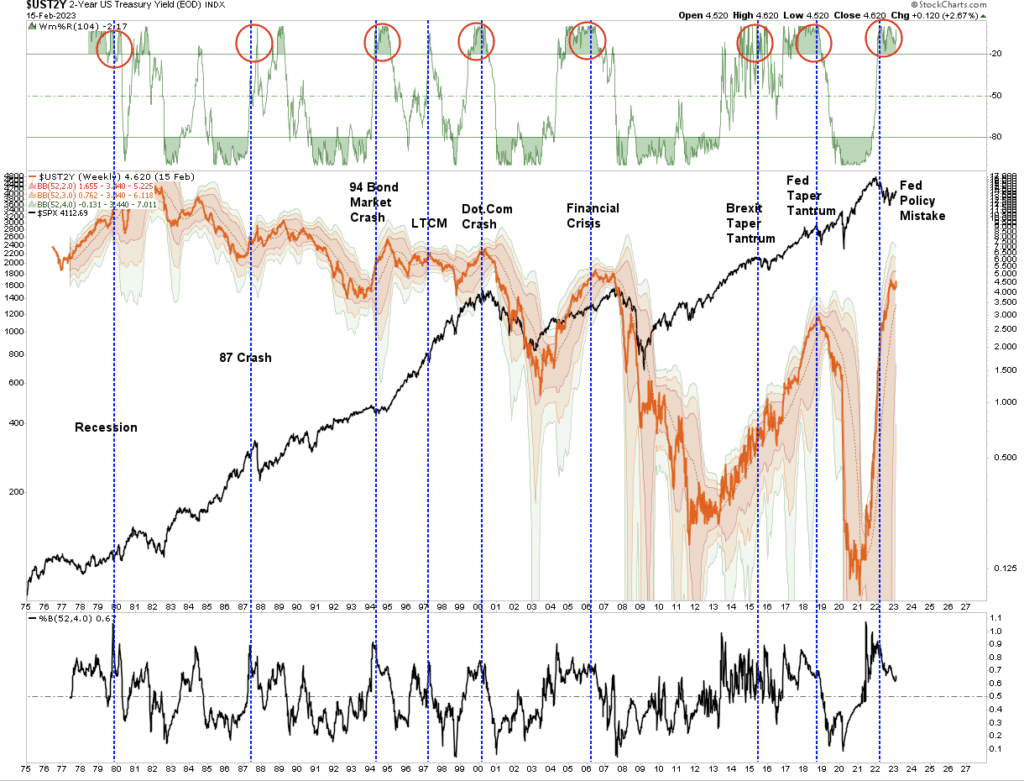
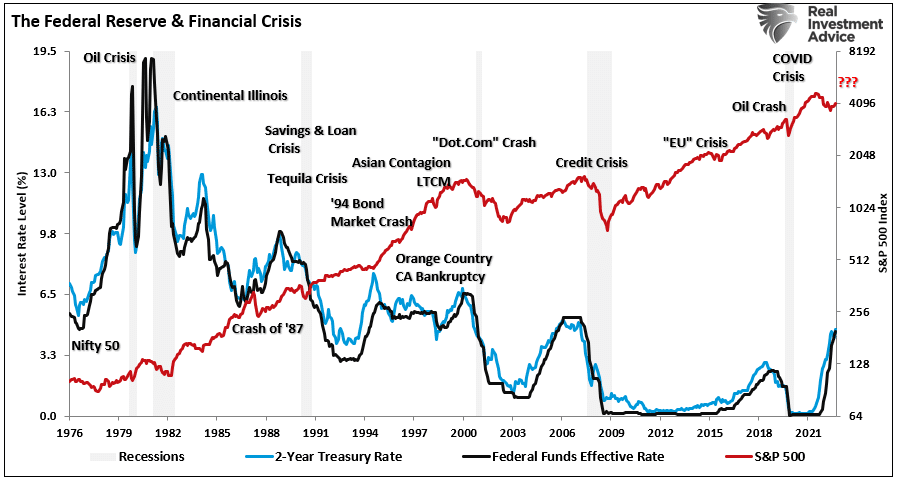
The only reason for rate cuts is a recession or financial event that requires monetary policy to offset rising risks. This is shown in the chart below, where rate reductions occur as a recession sets in.
Of course, the risk of the bulls ignoring the Fed is that there are problems with the solid economic data that will likely become more obvious in the months ahead.
Economic Data Is Strong But Is Weakening
While the bulls and the mainstream media focus on the monthly economic data points, myopic observations often overlook the larger picture. As with investing, when it comes to economic data, the “trend is your friend.”
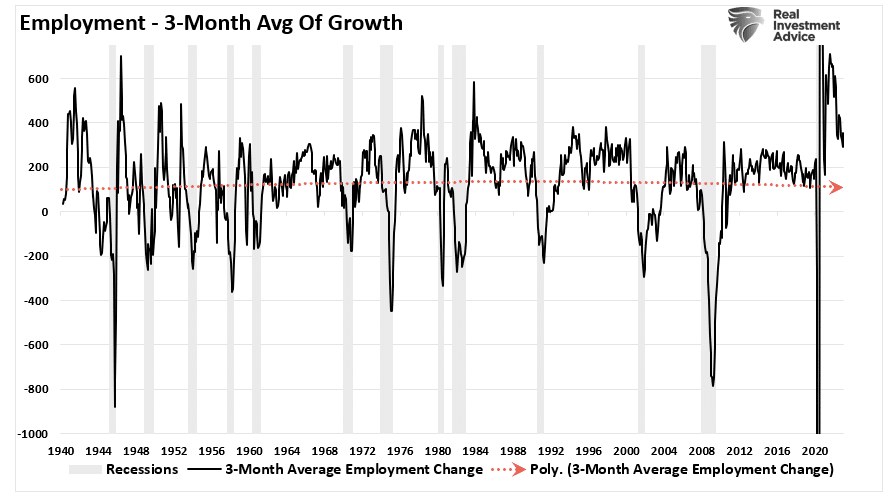
For example, that strong employment report in January certainly gives the Fed plenty of reasons to continue tightening monetary policy. If its goal is to reduce inflation by slowing economic demand, job growth must reverse. However, if we look at employment growth, it is indeed slowing. As shown, the 3-month average of employment growth has turned lower. While employment is still gaining, the trend suggests that employment growth will likely turn negative over the next several months.
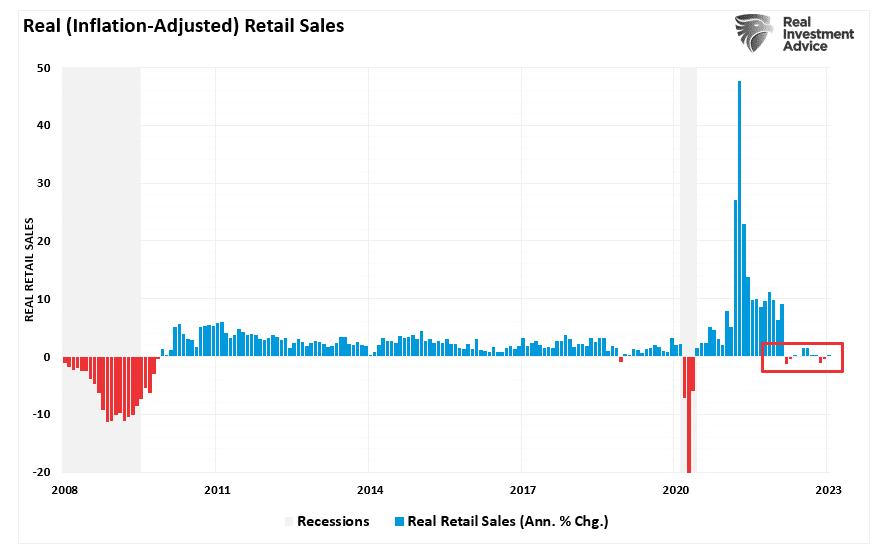
Retail sales data for January is also showing deterioration. This past week, retail sales showed a 3% monthly increase in January, the most significant jump since March of 2021 when Biden’s stimulus checks hit households. However, this is all on a nominal basis. In other words, even though consumers didn’t have a “stimmy check” to boost spending, they “spent more to buy less” stuff on an inflation-adjusted basis. Over the last 11 months, as the stimulus money ran out, real retail sales have flatlined.
While most of the jobs recovery was hiring back employees that were let go, the surge in stimulus-fueled retail sales will ultimately revert to employment growth. The reason is that people can ultimately only spend what they earn. As shown, the disconnect between retail sales and employment is unsustainable.
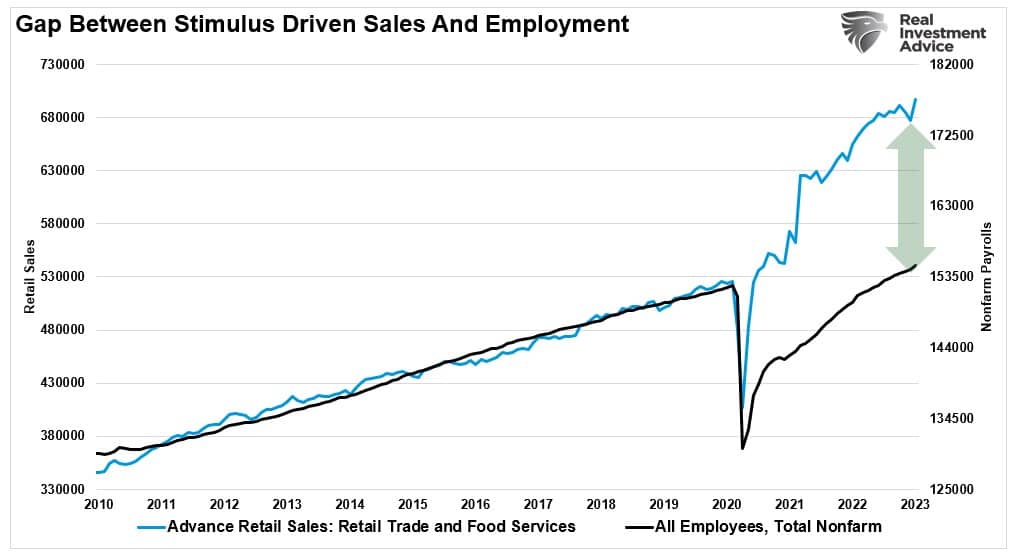
The eventual reversion of the data to economic normality will ultimately result in weaker economic growth and an eventual recession.
The Bulls Won’t Like The Pivot
However, again, this is where the bulls are misreading the “tea leaves” once again. At the same time, the bulls are correct that the Fed will be cutting rates to offset the impact of a recessionary drag, which does NOT equate to higher prices, at least initially.
The problem with the bulls frontrunning the “Fed pivot” is that historically the initial “pivot” is NOT equity friendly. The reasoning is logical as the Fed is now acting to “fix something” either economically or financially. As shown above, the chart of the two-year Treasury rate versus economic and financial events is quite telling.
While not every rate hike cycle ended in a recession, each did have an impact that eventually led to a rapid unwinding of the previous rate increases.
Notably, most “bear markets” occur AFTER the Fed’s “policy pivot.”
Whatever event occurs from an overtightening of monetary policy, the market will reprice lower as expectations of economic and earnings declines are forecasted. Currently, forward estimates for earnings and profit margins remain elevated despite a 17.5% decline from their previous peaks. As I noted in Technical vs. Fundamentals, earnings have declined 17.5% from the May 2022 peak, but analysts remain optimistic about a near-term economic recovery story.
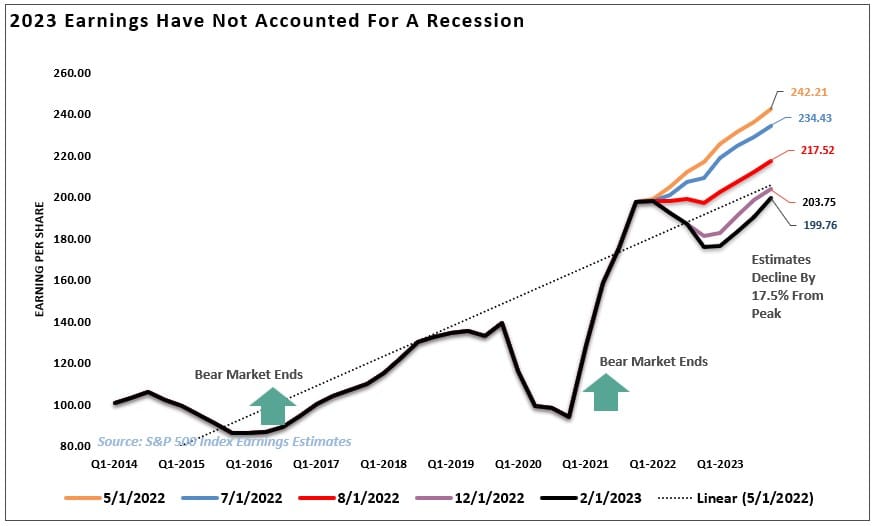
If a recession does occur, those expectations for a rebound in earnings growth will decline. While analysts are hoping for 2023 to end at $199 per share, a recession would suggest an earnings reversion to its long-term growth trend, or lower, of $158.

Assuming that the market can maintain a valuation multiple of 17x earnings, such would suggest a market priced at roughly 2,670. Or, rather, an approximately 30% decline from current levels. While such a significant correction seems unlikely, given the recent turn in the bullish technical underpinnings, that is just what the math of valuations suggests.
Bull Now, Bear Later
However, this highlights the current divergence between the bulls and the Fed.
The Fed remains intent on hiking rates to combat inflationary pressures, and their efforts so far have only had minimal impact. Crucially, even if the Fed does pause its current rate hiking campaign, a reversal of rate hikes remains highly unlikely. Therefore, the longer those higher rates remain, the more significant the impact on the functioning of a debt-laden economy will become.
Likely, the Fed has already hiked rates too much, and the lag effect of that tightening has yet to impact the data.
However, that impact is coming, and likely much sooner than the bulls expect.
In the near term, the bulls remain in control of the market; as such, we must have exposure to participate. However, we continue to think the bulls ultimately have it wrong. As such, one more market decline will likely occur before this bearish period is resolved. That is just what the historical data tells us. However, as is always the case when managing money, we need to remain focused on what the market is telling us.
As discussed on Tuesday, the market is likely beginning a correction process after the run from the October lows.
“Our primary short-term ‘sell’ indicator has triggered for the first time since early December. Such has previously provided excellent signals of corrections and rallies. The chart below is courtesy of SimpleVisor.com and shows our proprietary money-flow indicator and the Moving Average Convergence Divergence (MACD) signal.“

While the bulls remain in control of the market, we must trade it accordingly.
There are plenty of reasons to be very concerned about the market over the next few months. Given the market leads the economy, we must respect the market’s action today for potentially what it is telling us about tomorrow.
However, while we should not discount the improving technicals, we can not entirely dismiss the recession forecasts either. History is exceptionally clear about the impact of higher interest rates on economic growth, employment, and personal incomes.
How We Are Trading It
Could this time be different? Absolutely,
The bullish formations in the market indeed show investors are hopeful of such an outcome.
Unfortunately, there is a lot of history that suggests otherwise.
As we concluded last week, it is essential to set aside the idea of being either “bullish” or “bearish.” Once you pick a side, you lose objectivity to what is occurring within the market.
What is evident from the data is that an economic slowdown, or a recession at worst, is coming. However, the bulls continue to ignore the data and the Fed. While we suspect that will turn out to be a wrong view, there is no guarantee that will be the case.
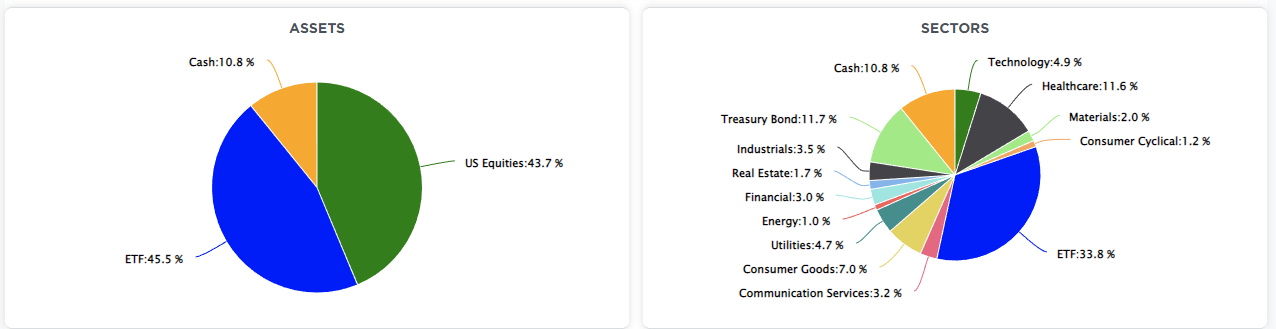
From an allocation standpoint, we remain underweight in stocks and bonds and overweight cash and short-term Treasuries. (The ETF allocation comprises short-duration Treasury bonds and floating rate Treasuries, with a lesser allocation to long-dated Treasuries. You can view our models in real-time at SimpleVisor.com)
On a pullback to support, we will bring our allocations up to full weightings and raise stops accordingly.
But that doesn’t mean we won’t eventually return to being net sellers.
While this market rally could have some legs, we suspect it is not THE return of the bull market yet. As such, continue working to rebalance portfolios for now.
- Tighten up stop-loss levels to current support levels for each position.
- Hedge portfolios against significant market declines.
- Take profits in positions that have been big winners
- Sell laggards and losers.
- Raise cash and rebalance portfolios to target weightings.
Have a great week.
Research Report
Subscribe To “Before The Bell” For Daily Trading Updates (Formerly 3-Minutes)
We have set up a separate channel JUST for our short daily market updates. Be sure and subscribe to THIS CHANNEL to receive daily notifications before the market opens.
Click Here And Then Click The SUBSCRIBE Button
Subscribe To Our Youtube Channel To Get Notified Of All Our Videos
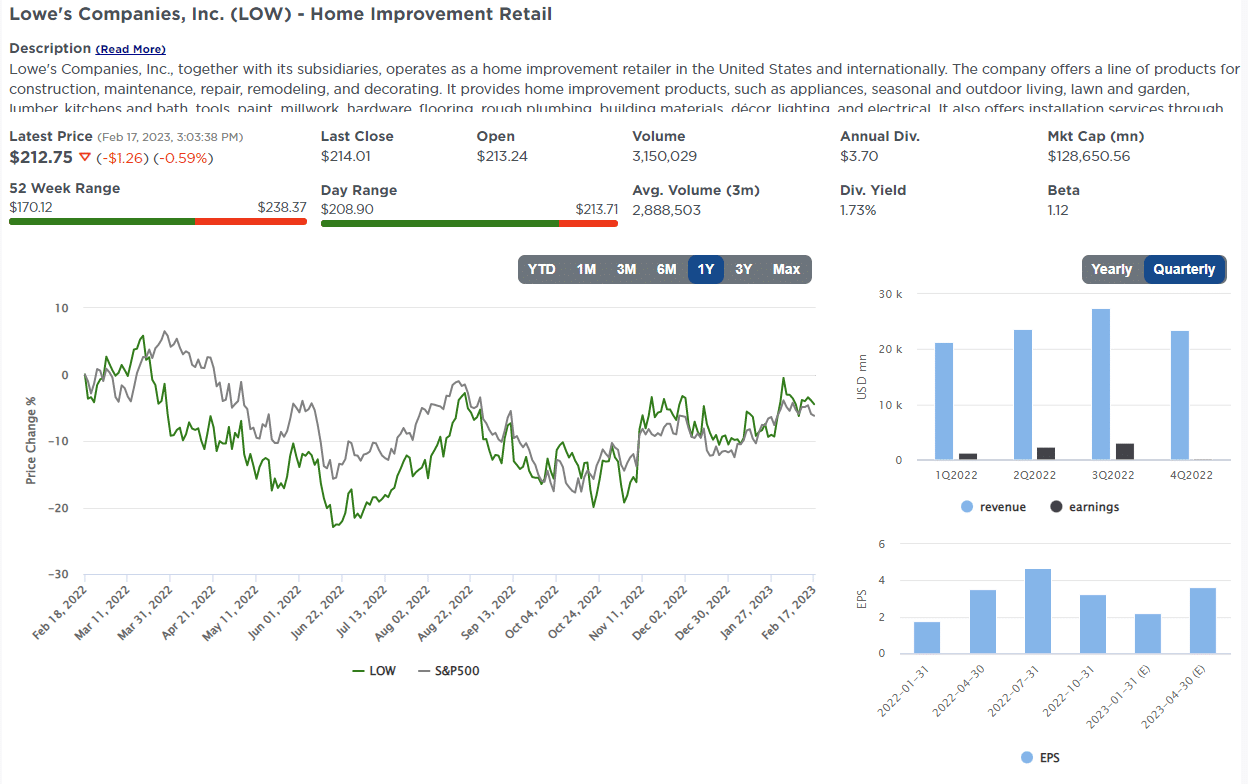
Stock Of The Week In Review
After two weeks of growth-oriented screens, we revert to value and earnings quality. We take a unique approach, using two screens to find companies with very dependable earnings and revenue growth trading at cheap valuations.
The scan started with 53 stocks Zacks includes in its Large Cap Earnings & Dividend Quality select list. These companies are predominantly household names with long histories of earnings growth and dividends.
Here is a link to the full SimpleVisor Article For Step-By-Step Screening Instructions.
Here is one of the companies we screened.
Login to Simplevisor.com to read the full 5-For-Friday report.
Daily Commentary Tidbits
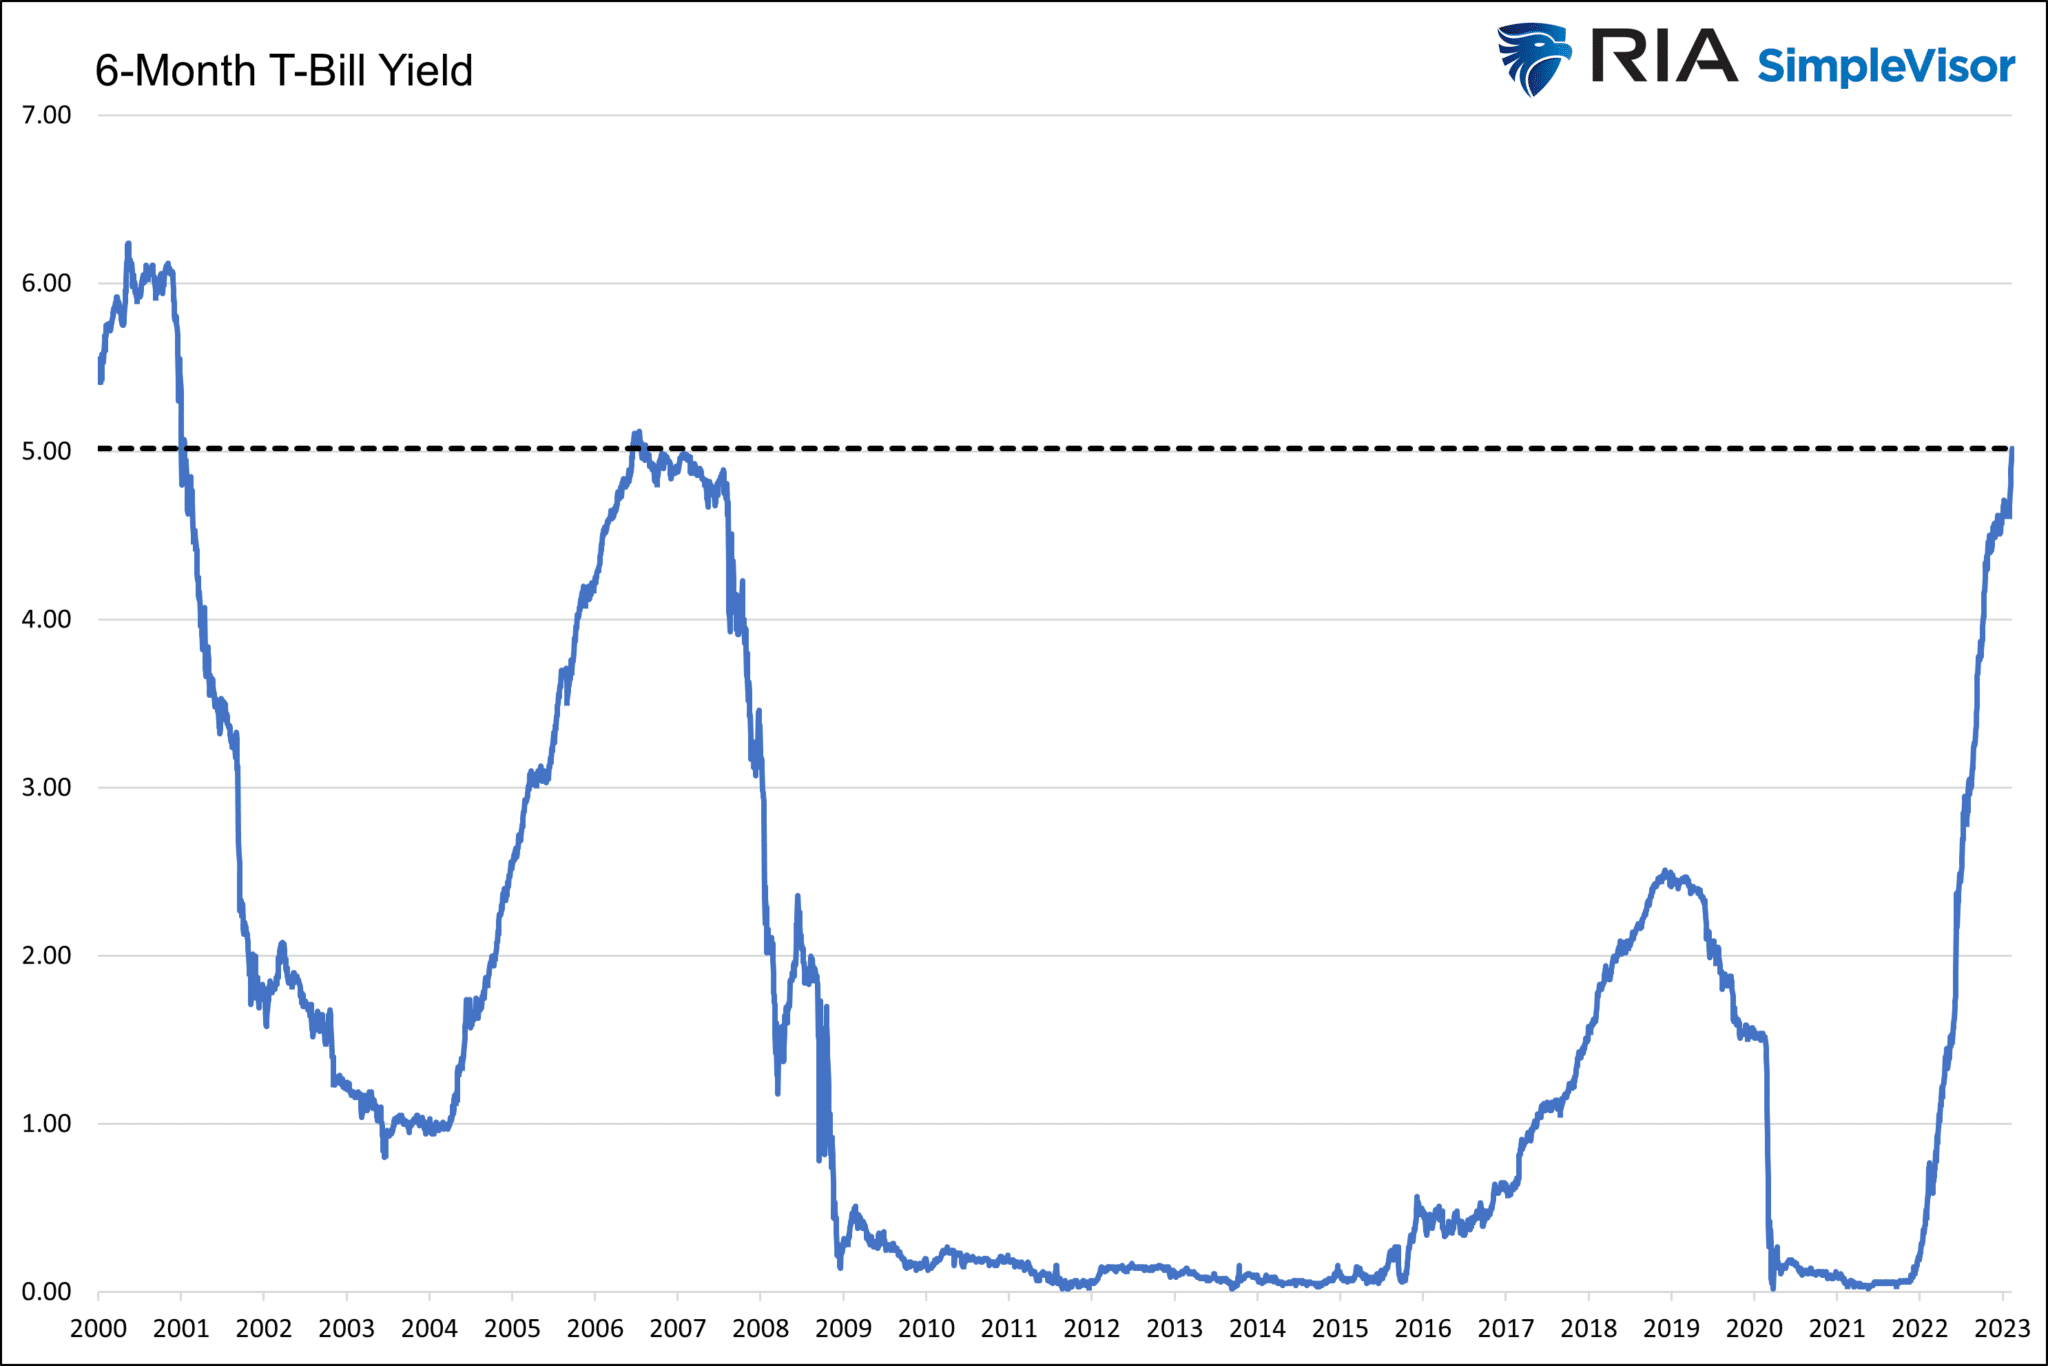
5 Percent Yields Incentive Cash Allocations
6-month and 1-year Treasury bills yields are above 5 percent, marking the first time a Treasury yield was over 5% since 2006. Savers are enthused at the prospect of earning a historically excellent risk-free return. On the other side of the coin are stock investors. Their decision-making is becoming more complex. Are they willing to bet that stocks will post a return of greater than 5 percent? Since 1970, the average annualized return on the S&P 500 is 7.39%, and about two-thirds of the annual returns were above 5%.
Statistically speaking, the logic of chasing stocks appears to make sense even when you can invest at a 5% risk-free rate. But we must consider that the Fed is raising rates and purposely trying to slow economic growth. Since 1970, the average annual returns were 3.9% and 5.0% in years in which the Fed increased or decreased rates by more than 50bps. Years in which the Fed was inactive averaged 11.8%. If the Fed increases rates at least one more time or pivots and lowers them considerably later this year, odds argue the risk-free 5 percent bond is a better option than stocks.
Further, consider risk-free yields at levels where professional money managers can over-allocate to cash or short-term Treasuries and earn competitive yields with potential equity returns. Such an environment will lead some to sell stocks and move to Treasuries.
Click Here To Read The Latest Daily Market Commentary (Subscribe For Pre-Market Email)
Bull Bear Report Market Statistics & Screens

SimpleVisor Top & Bottom Performers By Sector

S&P 500 Weekly Tear Sheet
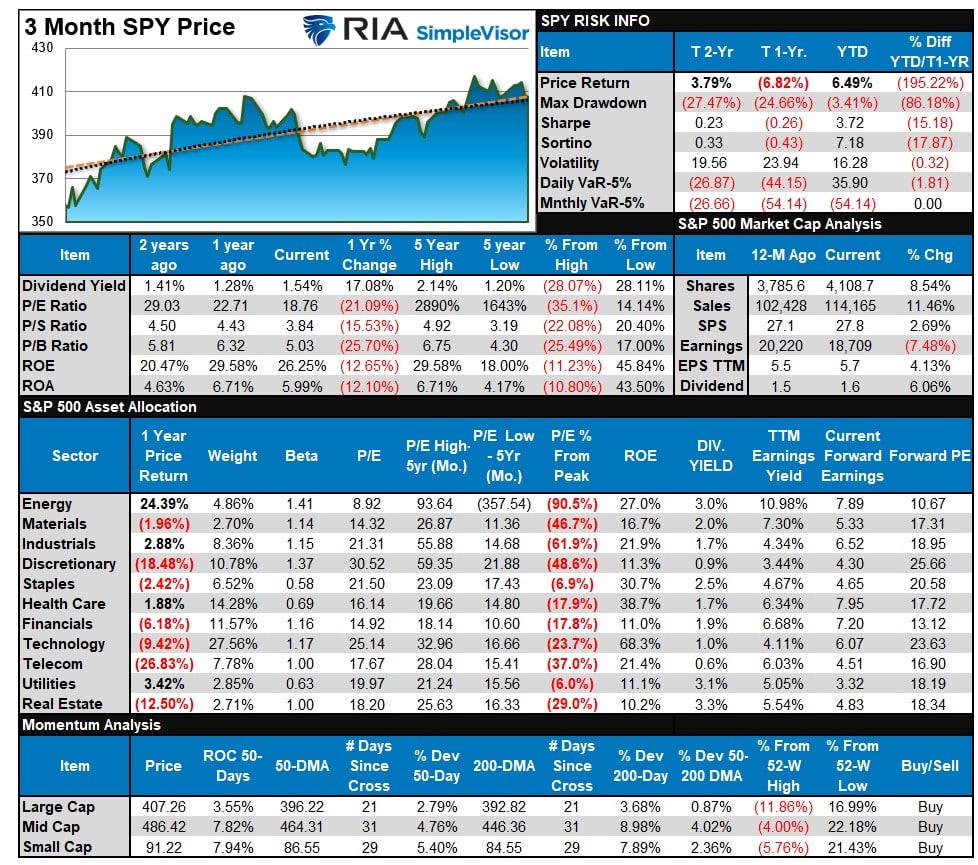
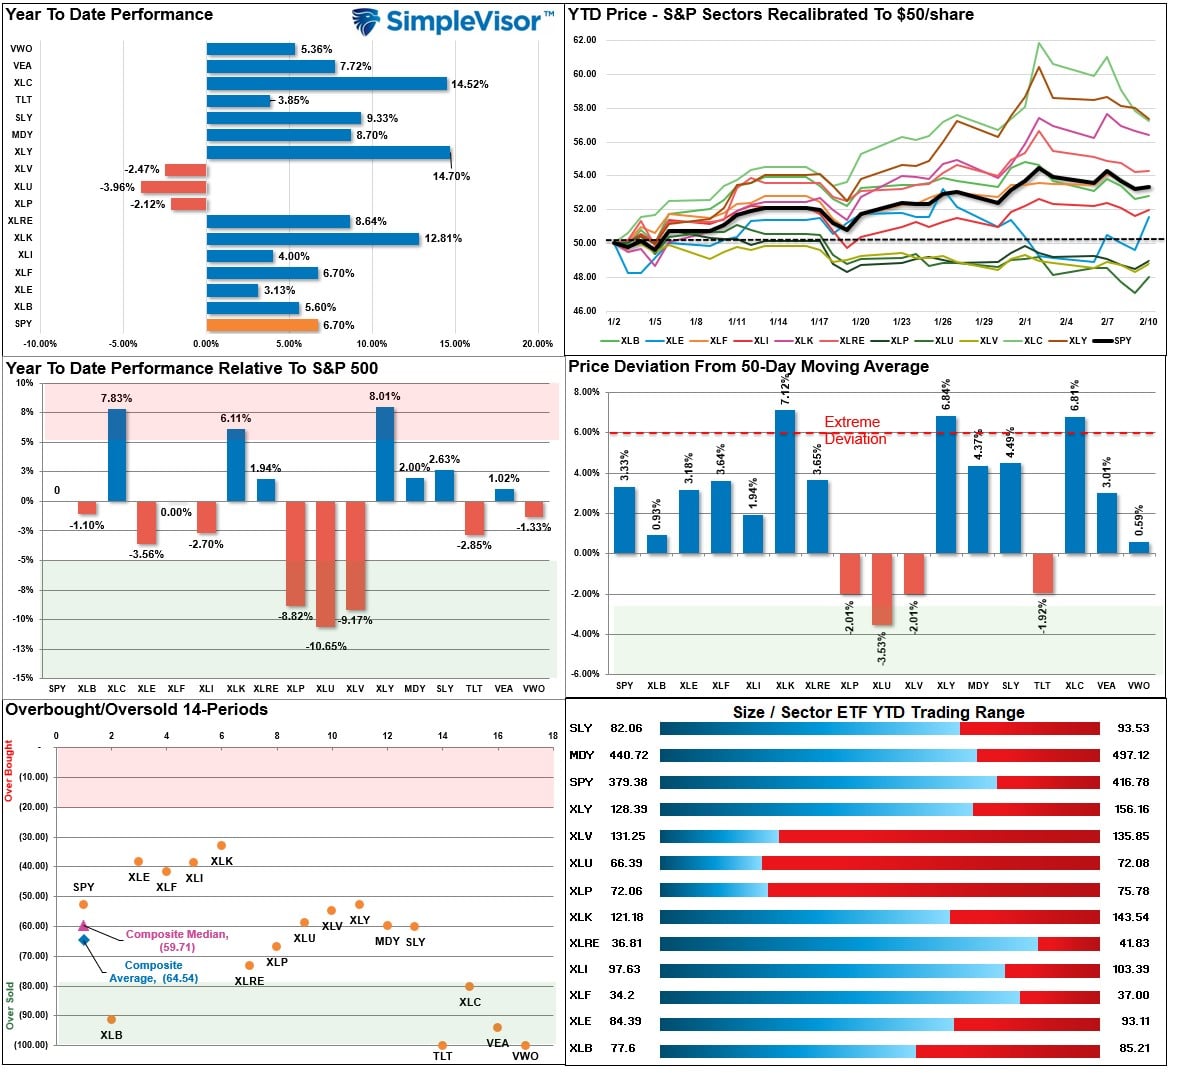
Relative Performance Analysis
Last week we stated that:
“That correction started this past week with our MACD ‘sell signal’ triggering, and a clear rotation began from leaders to laggards. Communications, Technology, and Discretionary remain well deviated above the 50-DMA, suggesting there is more work to be done, which gives Staples, Utilities, and Healthcare an opportunity to gain as money seeks relative safety. The market is NOT oversold yet, so I expect this correction to continue next week.”
That rotation did occur this week as the correction continued. Technology was the most under pressure after a solid year-to-date run, and the laggards improved. We suspect we are not through the corrective process yet and will likely see that battle between the bears and the bulls continue this week.
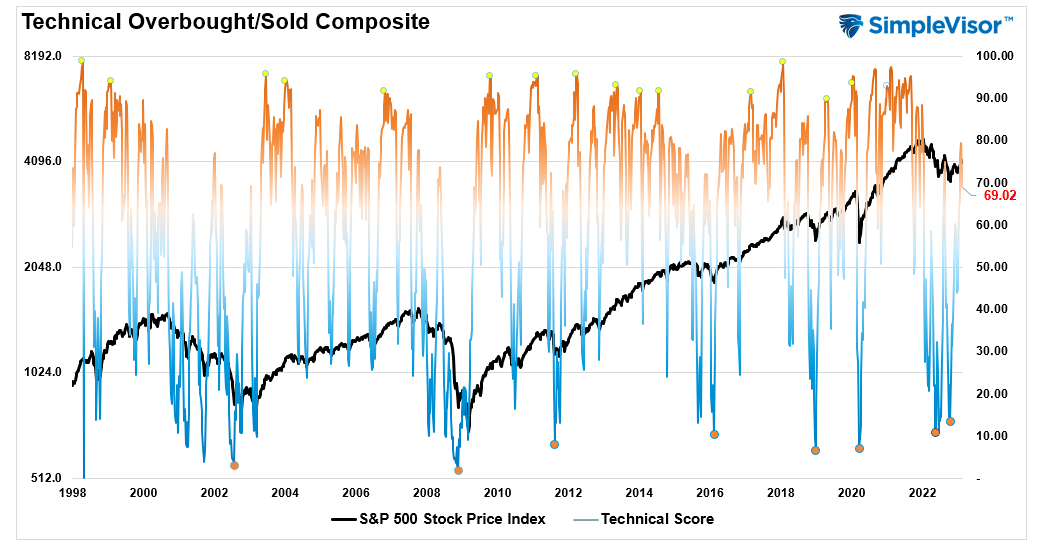
Technical Composite
The technical overbought/sold gauge comprises several price indicators (RSI, Williams %R, etc.), measured using “weekly” closing price data. Readings above “80” are considered overbought, and below “20” are oversold. Markets tend to peak when those readings are at 80 or above, which suggests profit-taking and risk management are prudent. The best buying opportunities exist when those readings are 20 or below.
The current reading is 69.02 out of a possible 100 and rising. Remain long equities for now.
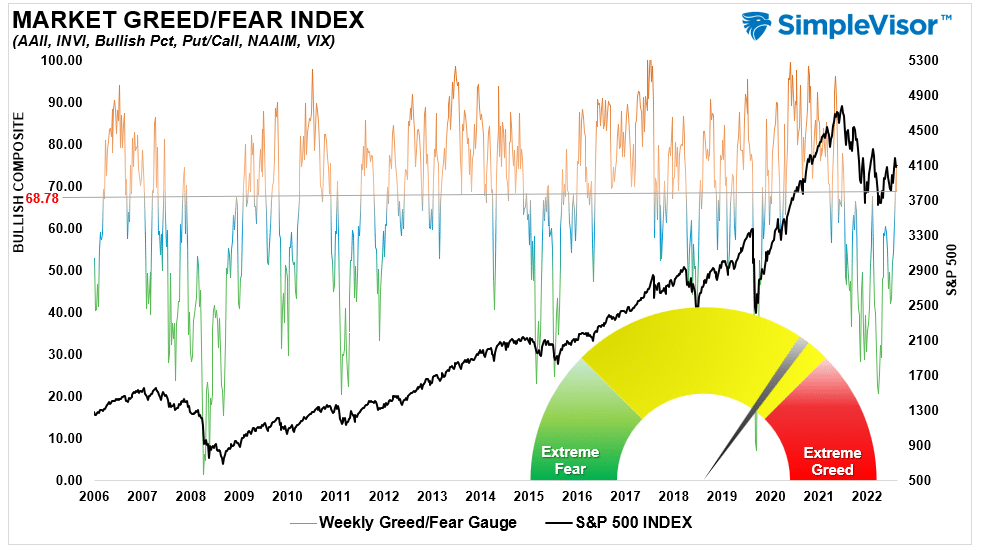
Portfolio Positioning “Fear / Greed” Gauge
The “Fear/Greed” Gauge is how individual and professional investors are “positioning” themselves in the market based on their equity exposure. From a contrarian position, the higher the allocation to equities, the more likely the market is closer to a correction than not. The gauge uses weekly closing data.
NOTE: The Fear/Greed Index measures risk from 0 to 100. It is a rarity that it reaches levels above 90. The current reading is 68.78 out of a possible 100.
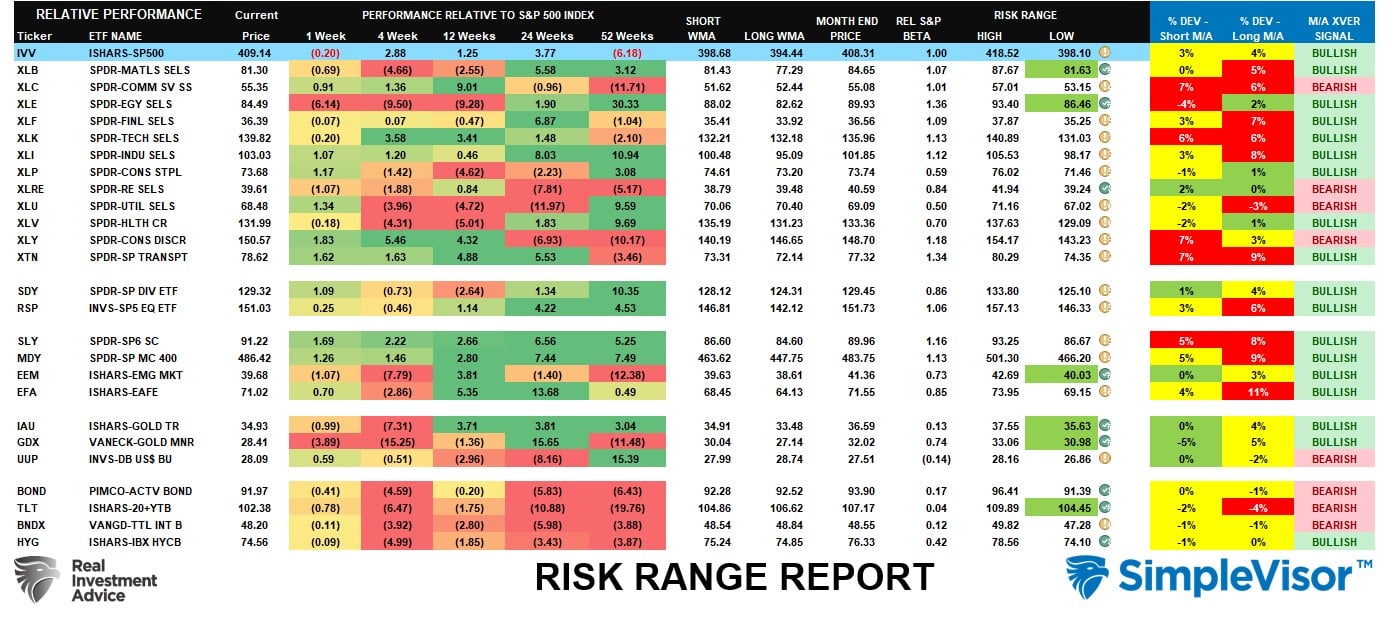
Sector Model Analysis & Risk Ranges
How To Read This Table
- The table compares the relative performance of each sector and market to the S&P 500 index.
- “M” XVER” “Moving Average Cross Over) is determined by the short-term weekly moving average crossing positively or negatively with the long-term weekly moving average.
- The risk range is a function of the month-end closing price and the “beta” of the sector or market. (Ranges reset on the 1st of each month)
- The table shows the price deviation above and below the weekly moving averages.
As noted last week, “Look to add exposure to sectors that are strengthening in terms of relative performance (moving from red bands towards green over the previous weekly periods) and are on bullish buy signals.” We continued to see the correction in the market continue this week, with the rotation from overbought to oversold sectors continuing. Bonds are very oversold currently with the recent run in rates, and Staples, Discretionary, Communications, and Industrials are showing better relative performance. We likely have more work with the current correction before a more solid buying opportunity presents itself. Remaining cautious currently is advisable.
Weekly SimpleVisor Stock Screens
Each week we will provide three different stock screens generated from SimpleVisor: (RIAPro.net subscribers use your current credentials to log in.)
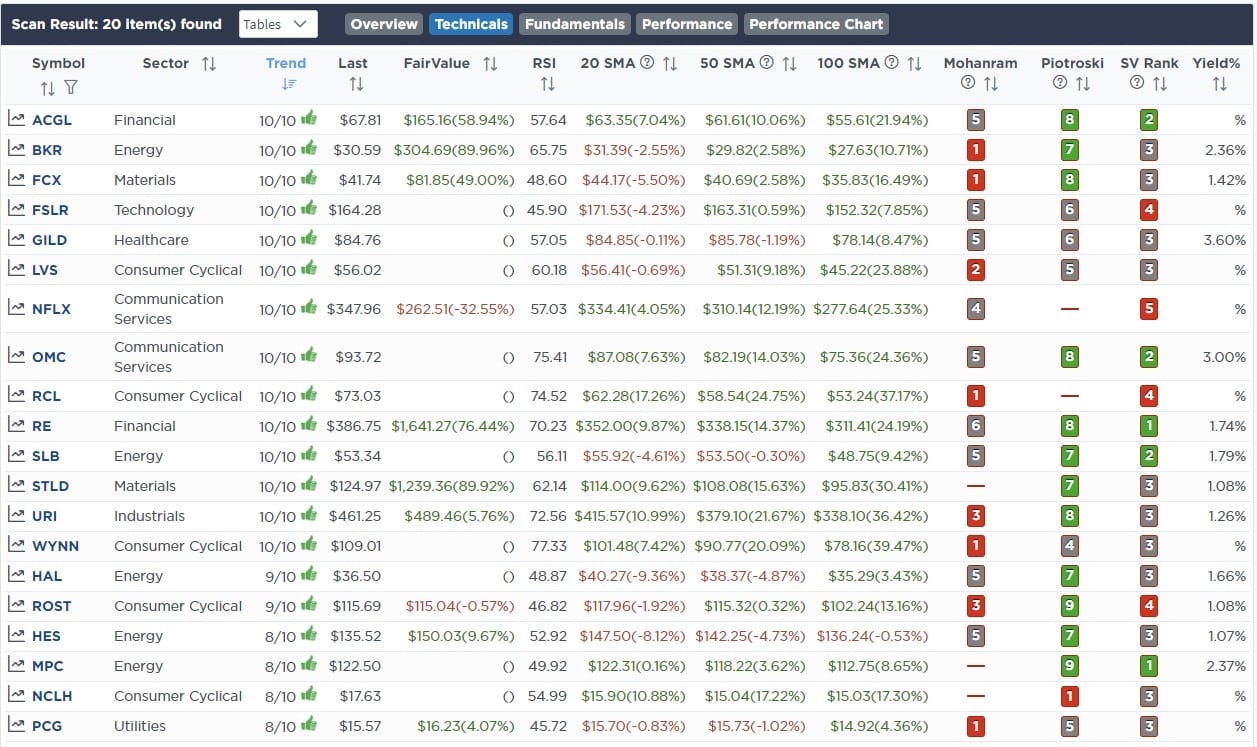
This week we are scanning for the Top 20:
- Relative Strength Stocks
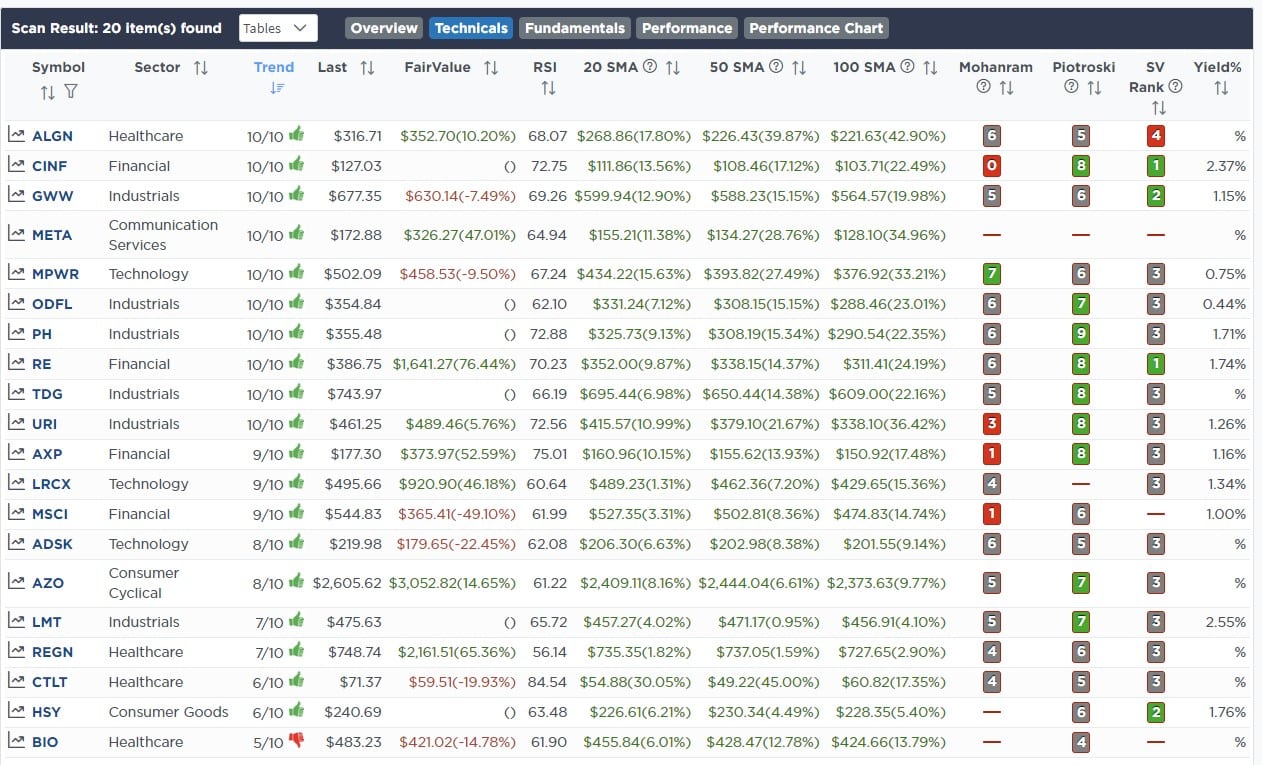
- Momentum Stocks
- Highest Rated Stocks With Dividends
These screens generate portfolio ideas and serve as the starting point for further research.
(Click Images To Enlarge)
RSI Screen
Momentum Screen
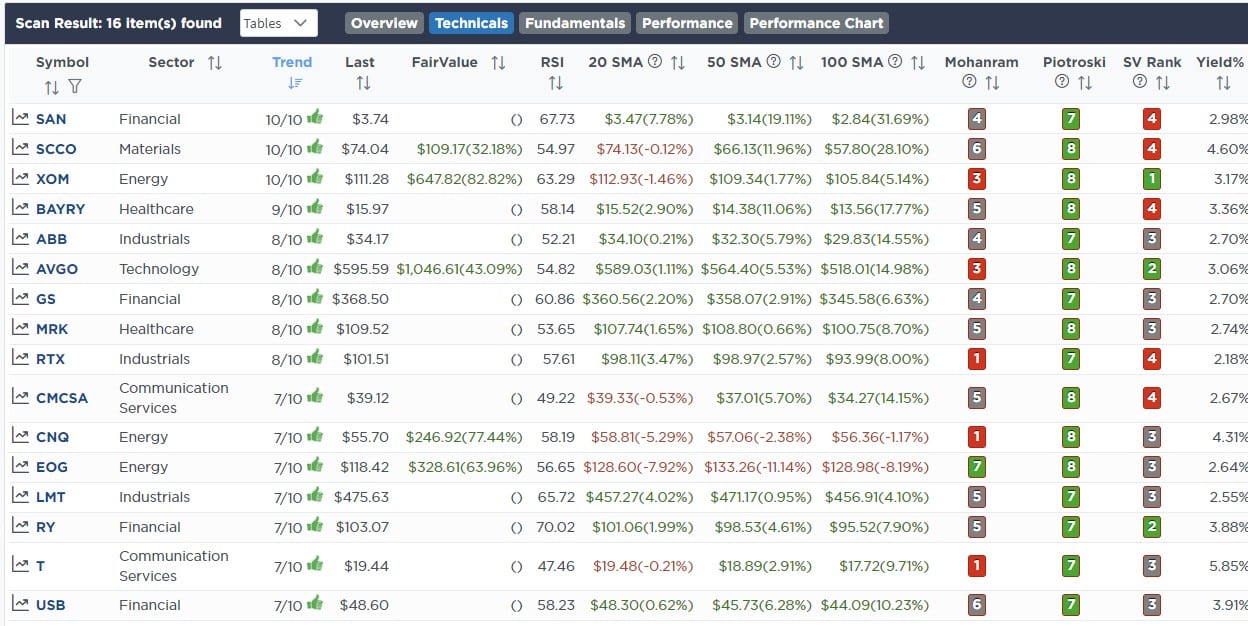
Highest Rated Stocks With Dividends
SimpleVisor Portfolio Changes
We post all of our portfolio changes as they occur at SimpleVisor:
No Trades This Week

Lance Roberts, CIO
Have a great week!

