Economic Downturn Still A Risk To Stocks


Inside This Week’s Bull Bear Report
- Economic Downturn Still A Risk To Stocks
- How We Are Trading It
- Research Report – A Recession Is Coming, Or Is It?
- Youtube – Before The Bell
- Market Statistics
- Stock Screens
- Portfolio Trades This Week
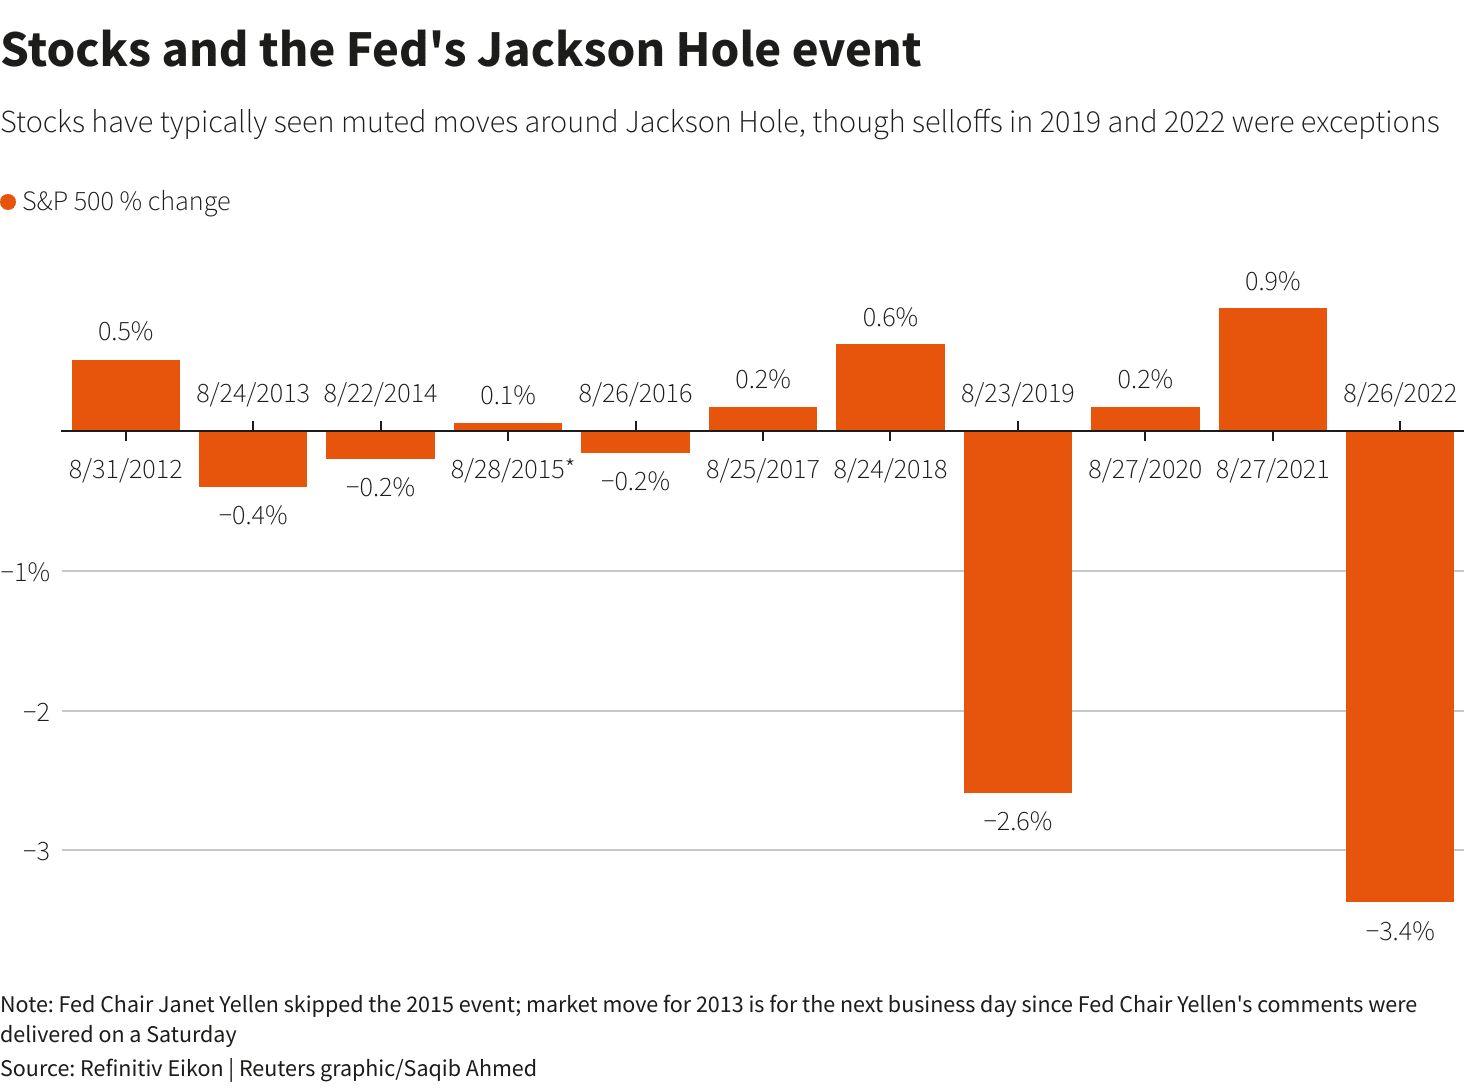
Jackson Hole Sparks A Rally
An economic downturn remains one of the most significant risks to the stock market, along with interest rates. However, on Friday, Jerome Powell spoke from the Jackson Hole Summit. He delivered, as expected, a “down the middle” speech suggesting the Fed will remain focused on incoming data for any upcoming policy changes. Over the last several years, market reactions to Jackson Hole Summit speeches have been relatively normal, with the exceptions of 2019 and 2022.
As Jerome Powell noted, the Fed’s primary concern remains inflation. To wit:
“Although inflation has moved down from its peak — a welcome development — it remains too high. We are prepared to raise rates further if appropriate and intend to hold policy at a restrictive level until we are confident that inflation is moving sustainably down toward our objective.
At upcoming meetings, we will assess our progress based on the totality of the data and the evolving outlook and risks. Based on this assessment, we will proceed carefully as we decide whether to tighten further or, instead, to hold the policy rate constant and await further data.”
Notably, Powell steered clear of the recent debate on the “neutral rate.”
“We see the current stance of policy as restrictive, putting downward pressure on economic activity, hiring, and inflation. But we cannot identify with certainty the neutral rate of interest, and thus there is always uncertainty about the precise level of monetary policy restraint.”
Powell’s speech was primarily a “nothing burger” with no real change to the overall stance discussed over the past several meetings.
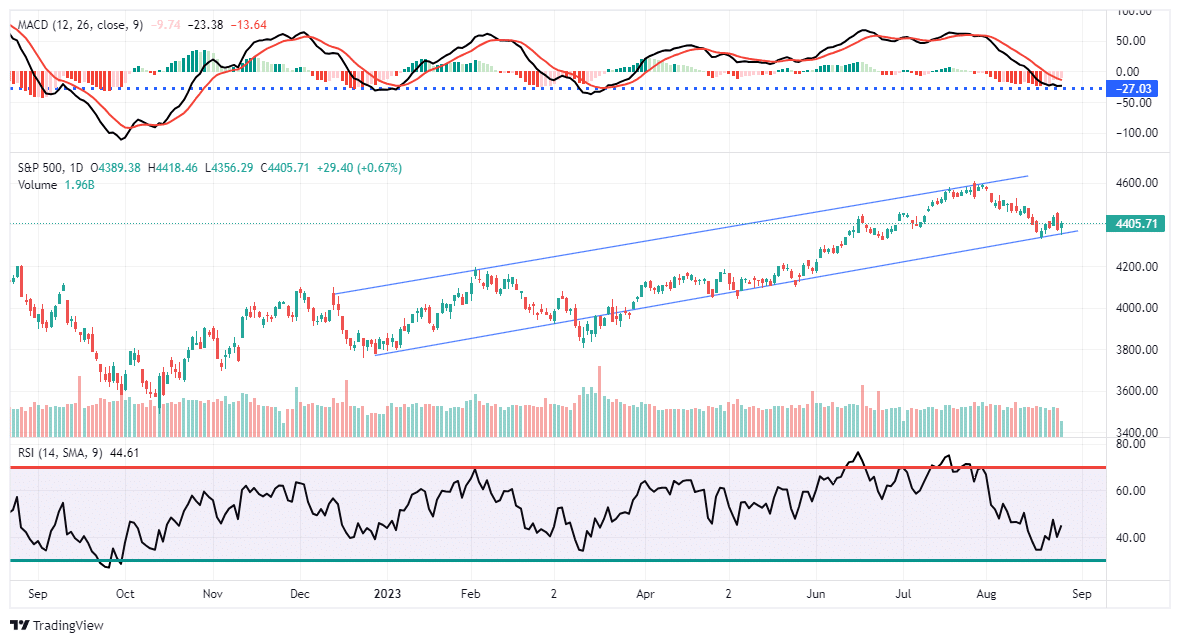
From a market perspective, the market remains in a continued August-September correction period, which follows five straight months of accelerated gains. A correction was needed, given the market was up more than 15% in the year’s first half. Nonetheless, the market continues to trade within its bullish trend and tested and rallied off that level on Friday for a second time. It also remains above critical support levels for now. With the MACD “sell signal” beginning to turn and the RSI index improving, we could see a further rally next week.
In last week’s missive, we stated:
“As long as nothing ‘breaks,’ when this corrective cycle completes, we expect a rally into year-end. Such will be a function of performance chasing as portfolio managers play catch up into year-end.”
There are certainly risks to the market that should not be ignored. As discussed in today’s article, economic growth and interest rates are crucial and concerning factors. However, in the short term, momentum and psychology drive stock prices. In the longer term, it is earnings and valuations.
Need Help With Your Investing Strategy?
Are you looking for complete financial, insurance, and estate planning? Need a risk-managed portfolio management strategy to grow and protect your savings? Whatever your needs are, we are here to help.

Economic Downturn Still A Risk
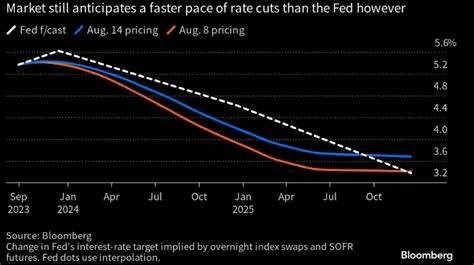
As previously discussed, the most considerable support for the bullish story behind the stock market rally is avoiding a recession or the “No Landing Scenario.”
“One sign the markets are pricing in the ‘no landing’ scenario is the disconnect between the Fed and the market. The Fed funds futures show the market expects rate cuts to start by mid-year even though the terminal rate has shifted higher.”
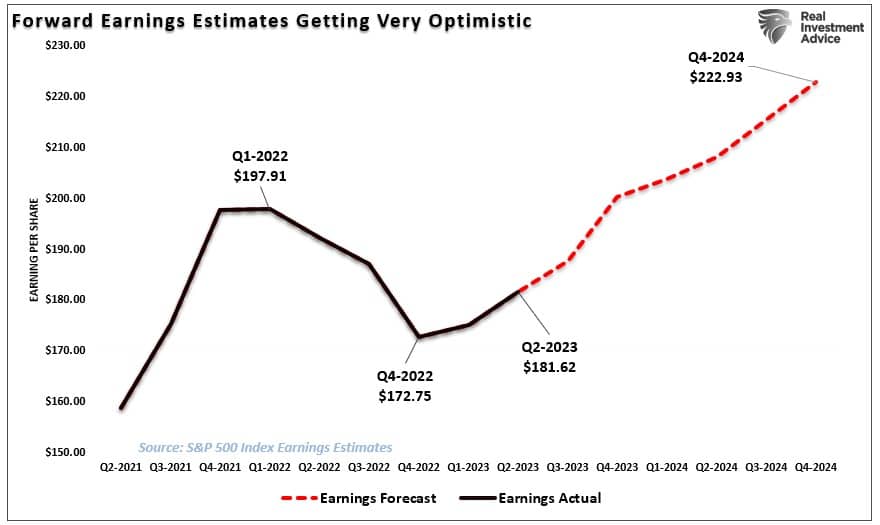
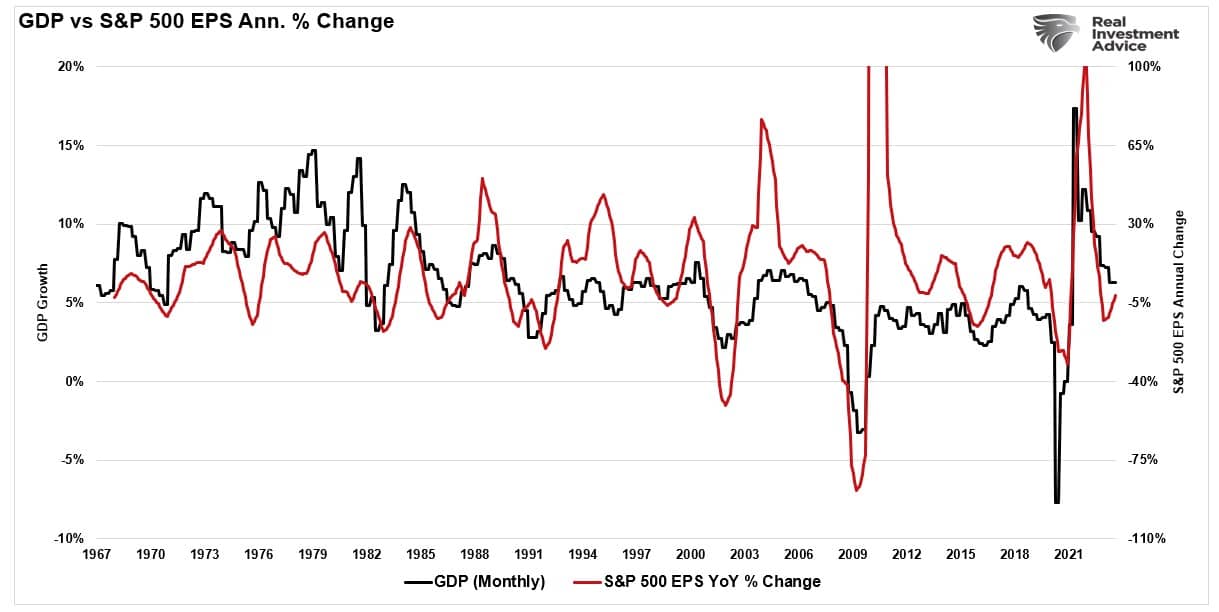
For the bulls, avoiding an economic downturn supports expectations for increased earnings and profit margins to support elevated valuations. As shown, analysts currently expect corporate earnings to surge into 2024.
However, given that earnings are derived from economic activity, any economic downturn would lead to reduced revenue and earnings. Such is seen in the annual rate of change in GDP and earnings.
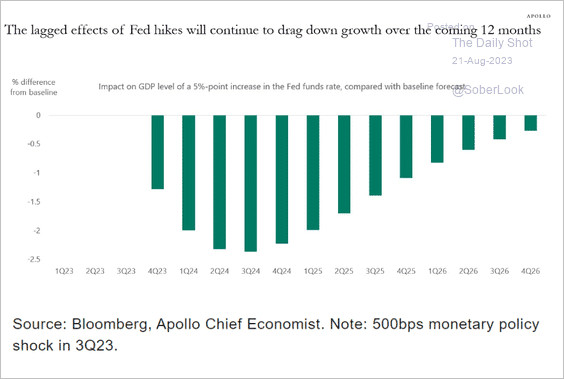
While that is logical, the economic downturn has yet to occur, lifting hopes that a recession will be avoided. But is that the case, or will the “lag effect” of the Fed’s aggressive rate hiking campaign still come home to roost? As shown, the bulk of the rate hikes from 2022 will continue to weigh on economic growth over the next 12 months.
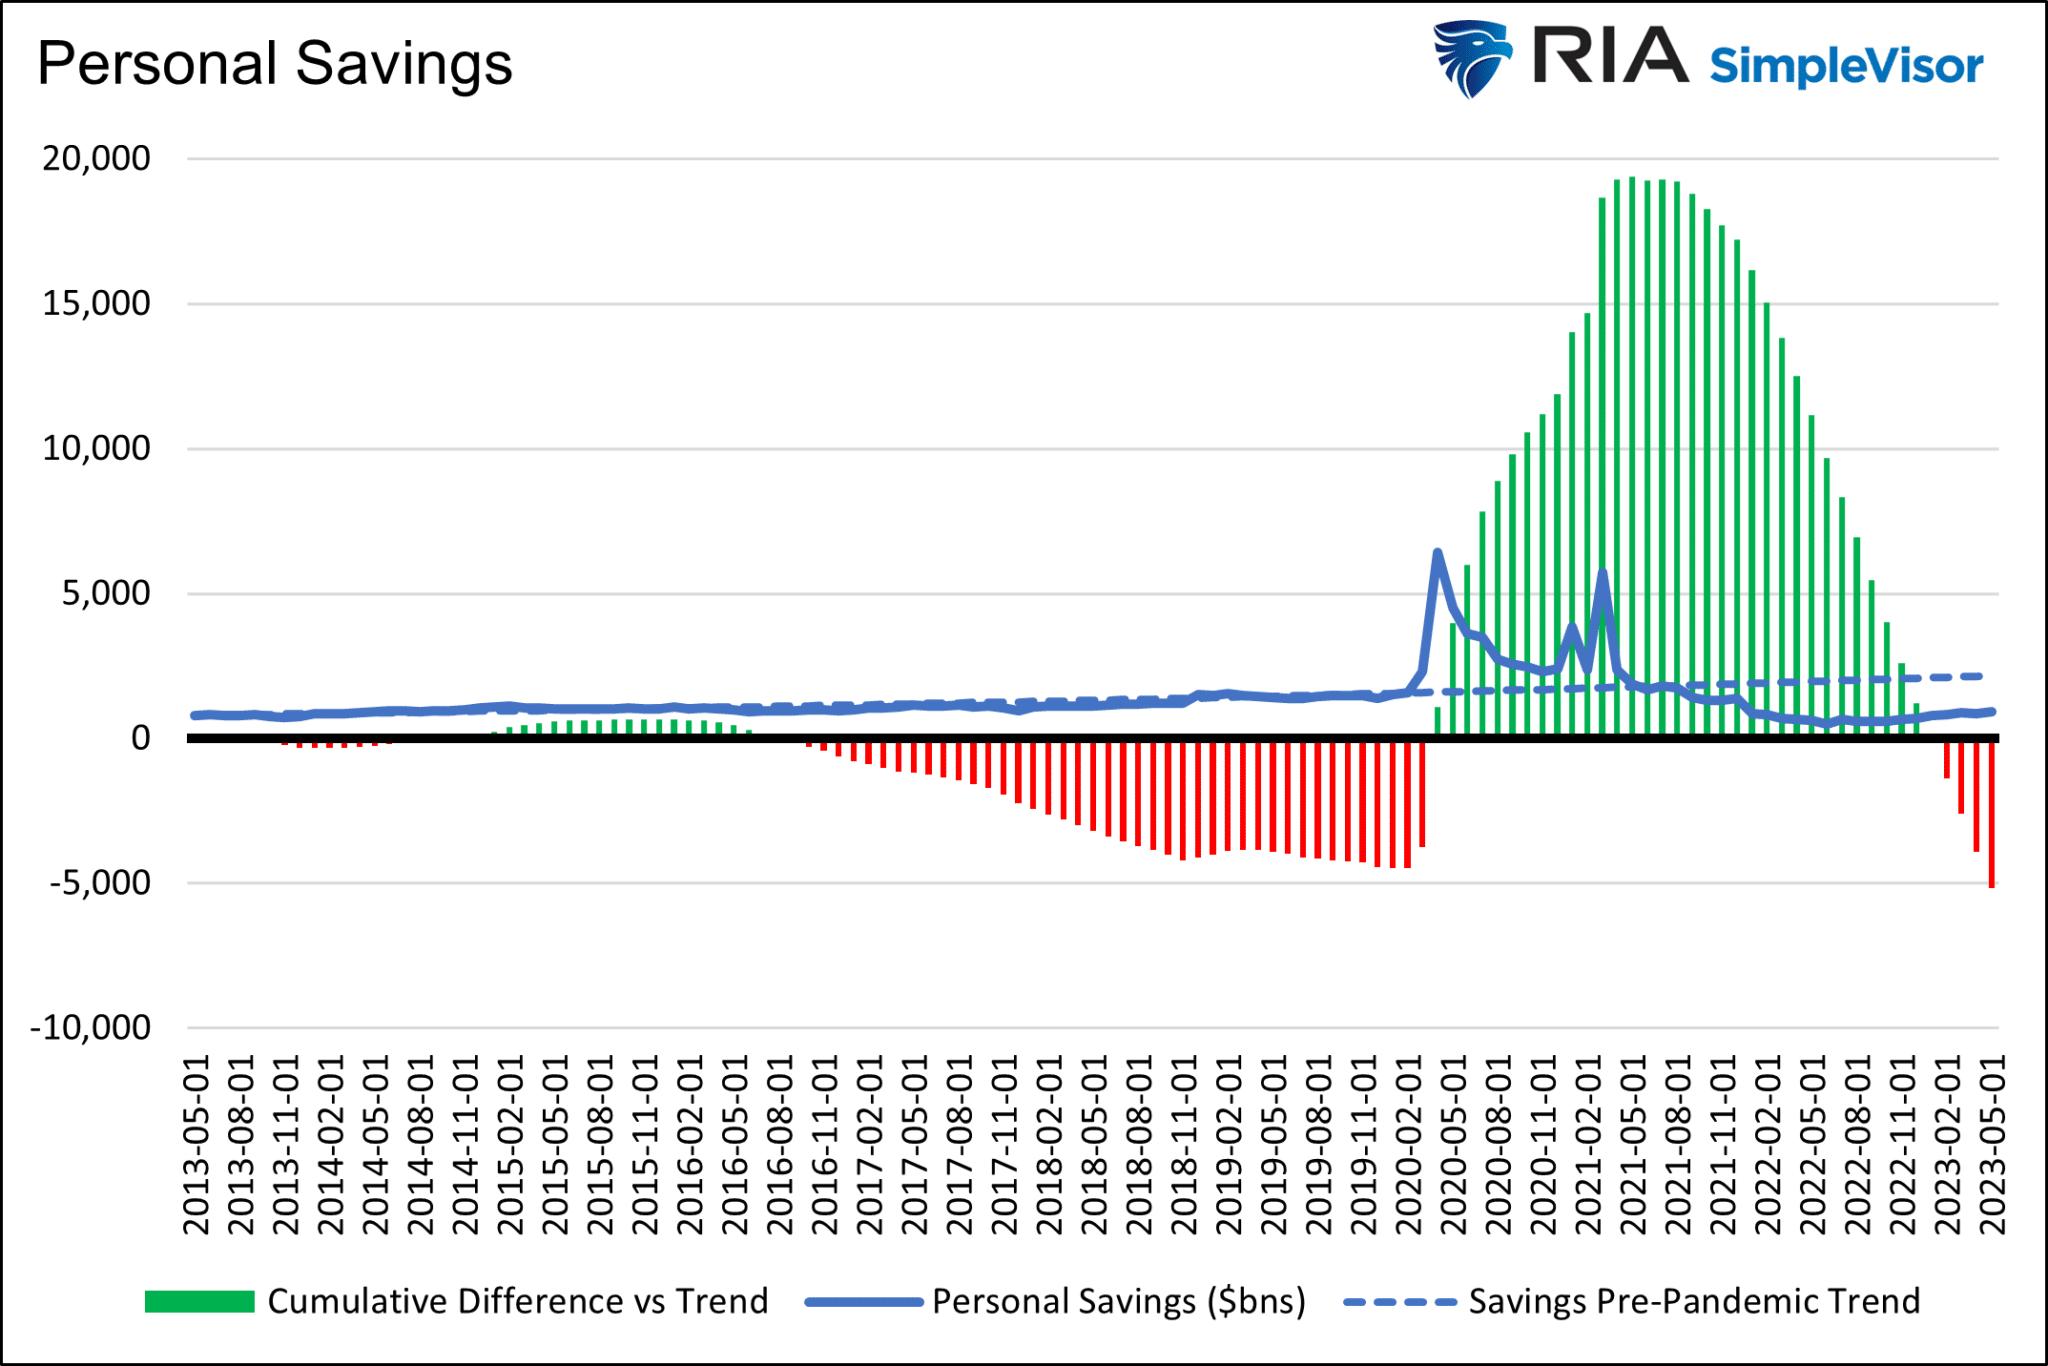
At the same time, the liquidity effect of the pandemic-spending spree will continue to reverse as excess savings balances run dry. Such was a point that Michael Lebowitz noted recently.
“The following graph shows the jump in savings commensurate with stimulus. The chart highlights that consumers saved less than average after the two giant government stimulus checks were distributed and drew down on elevated savings to consume. However, and this is important, cumulative personal savings are now below the longer-term trend.”
While the economic data has defied the effects of gravity so far, there is a risk that it won’t indefinitely. As such, an economic downturn remains a risk to stocks.
Long-Term GDP Growth Rates Are Lower
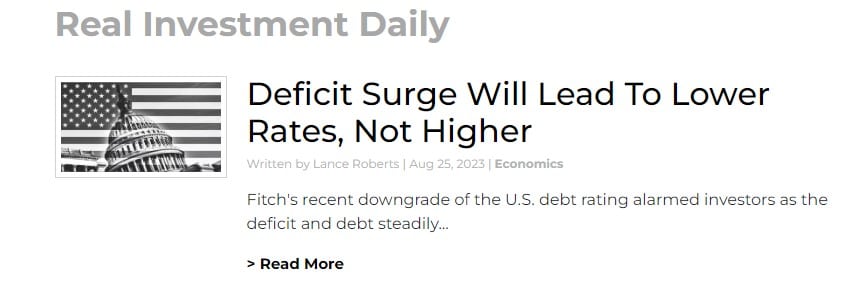
As we discussed in yesterday’s #MacroView, the continuing rise of debts and deficits will drag on economic growth in the future.
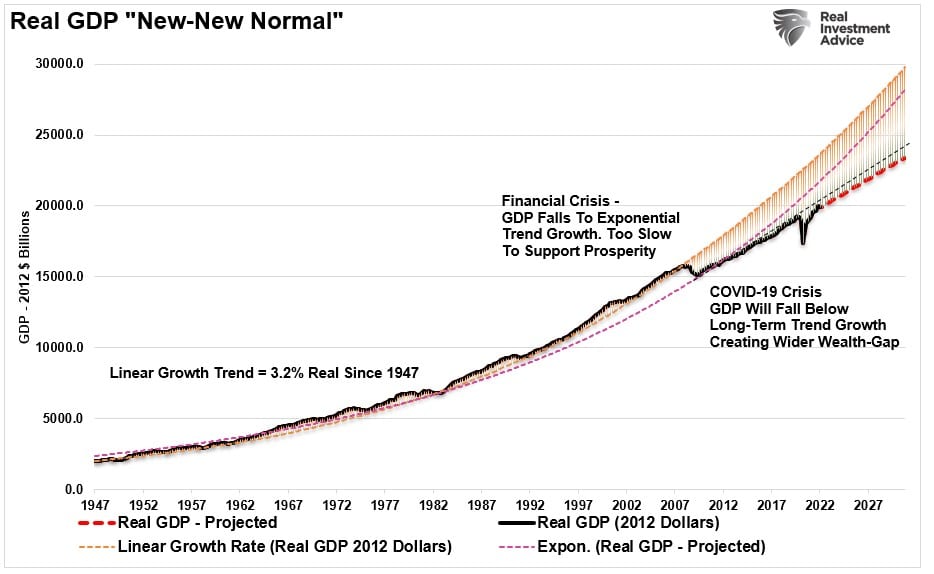
“What should not surprise you is that non-productive debt does not create economic growth. Since 1977, the 10-year average GDP growth rate has steadily declined as debt increased. Thus, using the historical growth trend of GDP, the increase in debt will lead to slower economic growth rates in the future.”
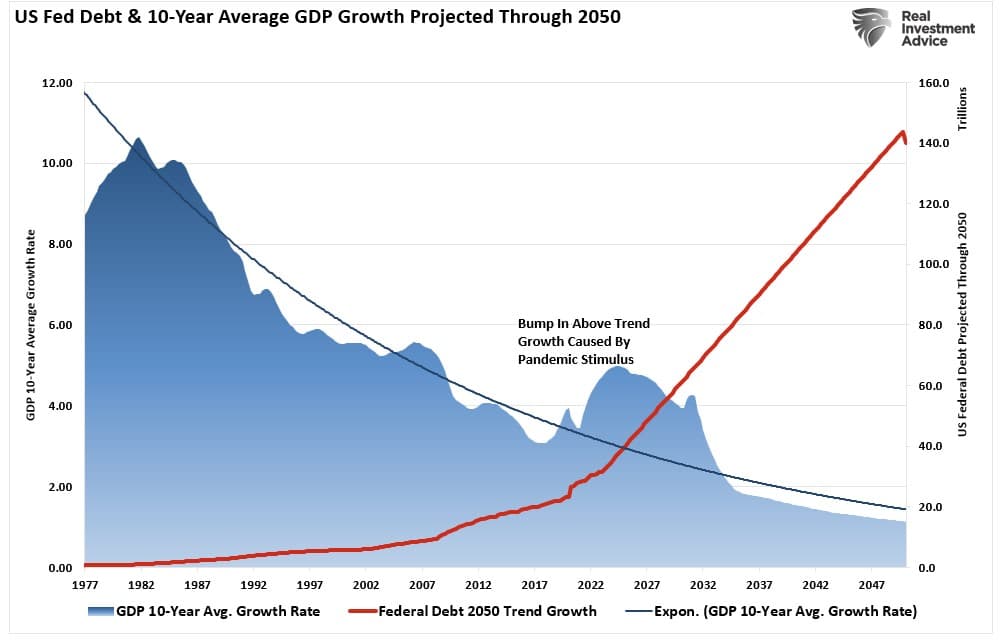
You will note that in the chart above, economic growth rates downshifted as debt and deficits began to accelerate following the “Dot.com” crash. If we analyze the long-term growth trend of the economy, we see that from 1947-2000, the economy grew at 3.2% annually. Following the “Dot.com” crash, the growth rate began to slow as total debt and deficits increased, diverting productive investments into debt service.
Note that post the “Financial Crisis,” and again following the “Pandemic-Era Shutdown,” the economic growth rate slowed from 3.2% annual growth to 2.3%. Given that both Central Banks and the Government are dependent on “debt” to support further economic growth, there is little ability for growth to increase from the current projected trend.
However, it isn’t just the data that suggests that economic growth rates will slow. The Federal Reserve also expects the same. To wit:
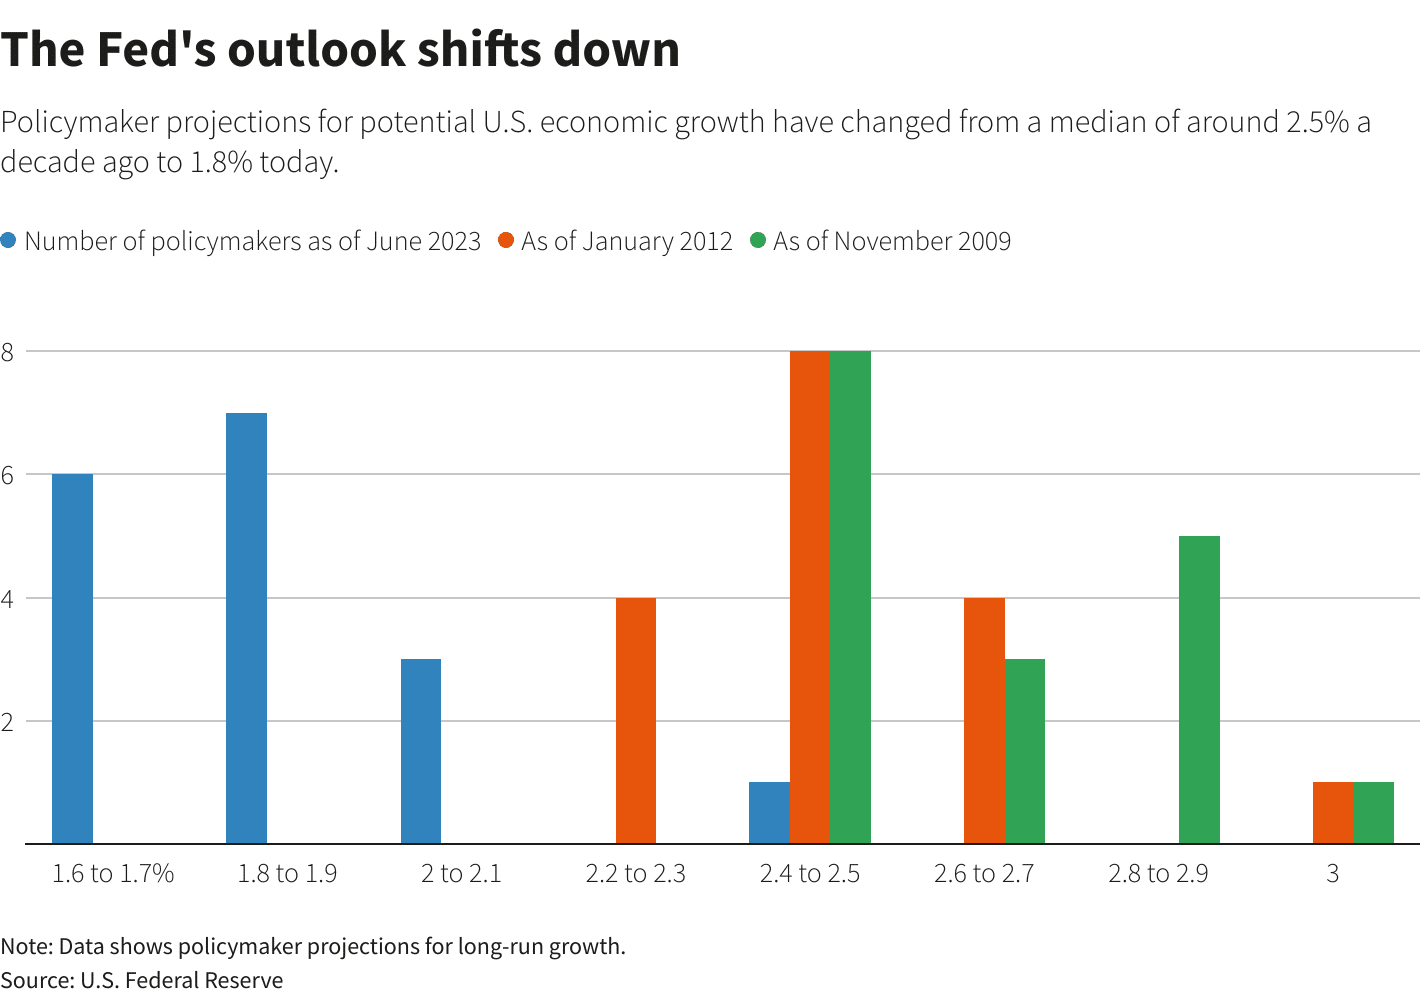
“The Fed has raised interest rates by 5.25 percentage points since March 2022 in its bid to tame the surge in inflation, but so far, it has not seen as much response from the economy as expected. U.S. output grew at a 2.4% annual pace in the second quarter and may also be poised for a strong third quarter. While many economists feel a slowdown is coming, the longer growth remains robust, the more the Fed may feel it needs to lean on the economy.
Median Fed policymaker projections of potential U.S. economic growth have slid from a level around 2.5% a decade ago to 1.8% as of June 2023, when the last projections were issued.
‘In the next six to 12 months, you probably have a recession, and that is a function of the Fed. After that, we will shift to a slower growth phase.'”
Notably, regarding the outlook for stocks, particularly at elevated valuations, an economic downturn will impact earnings, making valuations more challenging to justify. If economic growth returns to 2% or less over the longer term, then expected future stock returns will more likely be closer to 2-4% compared to the 12% over the last decade.
In the short term, interest rates are investors’ most significant risk.
Interest Rates Are Also A Risk To Stocks
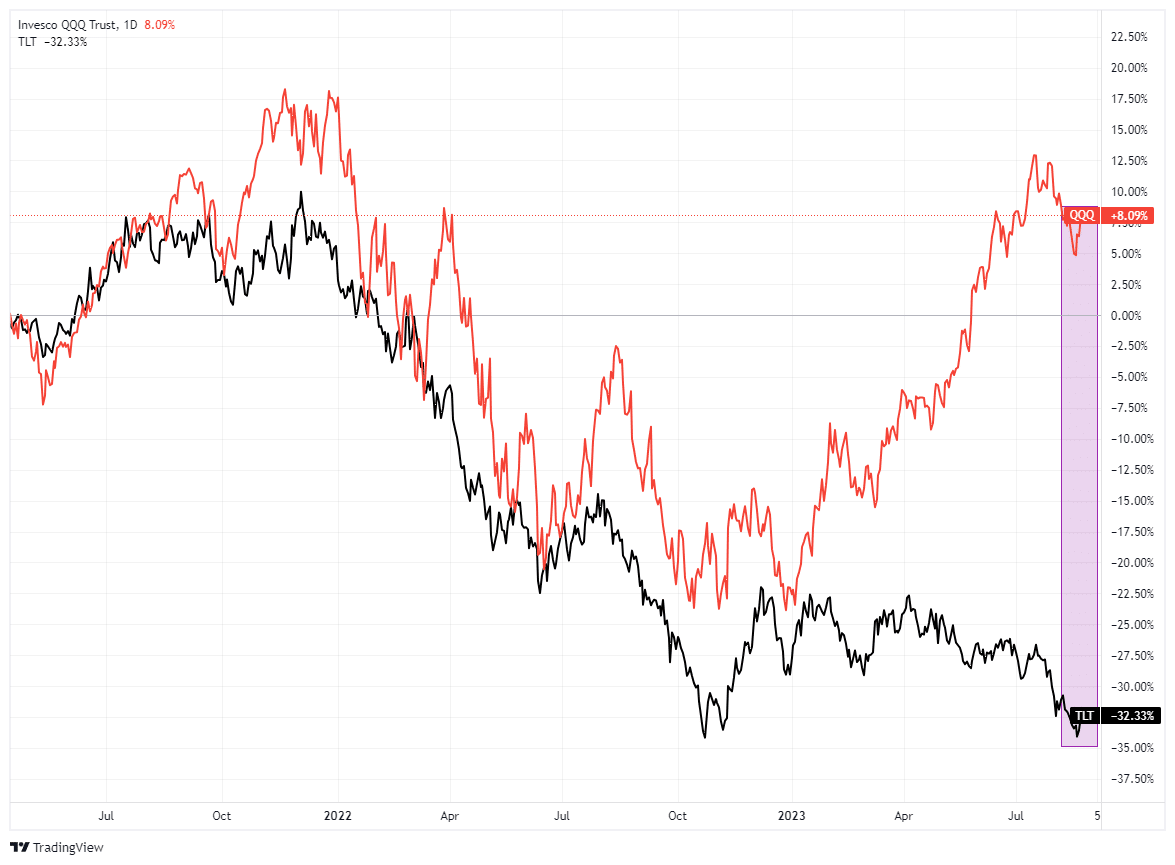
As we discussed, stocks have a problem that the markets have not yet recognized. That is the impact of interest rates on long-duration assets. As I explained previously:
“We discussed the deviation between long-duration assets (Technology stocks) and interest rates some months ago. That gap has continued to widen to one of the largest we have seen. In a heavily indebted economy, low-interest rate levels are required to finance new spending (including share buybacks) and refinance maturing debt. Furthermore, given that high-growth companies, like Technology stocks, depend on revenue growth to support valuations, high-interest rate environments put that growth at risk.
While interest rates remain high, the consumption drag becomes problematic as excess liquidity levels are drained from household savings accounts. While there seems to be no concern about a recession, or even a rather sharp economic slowdown, it only seems logical that, at some point, that gap will close.”
Such was a point made by Myles Udland recently for Yahoo Finance.
“For the stock market, higher interest rates mean lower stock prices, all else equal. In a note to clients on Sunday evening, Fundstrat’s Tom Lee clearly explained how his clients now see these dynamics weighing on markets.
‘Over our many conversations with institutional investors in the past week, the vast majority cite the rise in interest rates as the most concerning for equities. This makes sense. The rise in interest rates means the P/E multiple comes under pressure. The 50bp rise in the US 10-yr to 4.255% is a 7% hit to P/E’s and is about the hit to the S&P 500. And higher multiple stocks would disproportionately get hit, which explains why FAANG/Tech have been hit harder with Nasdaq 100 down -7%.'”
History is pretty clear about what happens with valuations when interest rates increase. As shown, since 1990, increases in interest rates inevitably lead to an economic slowdown, recession, or worse. Each of those events aligns with a revaluation of markets as earnings decline.
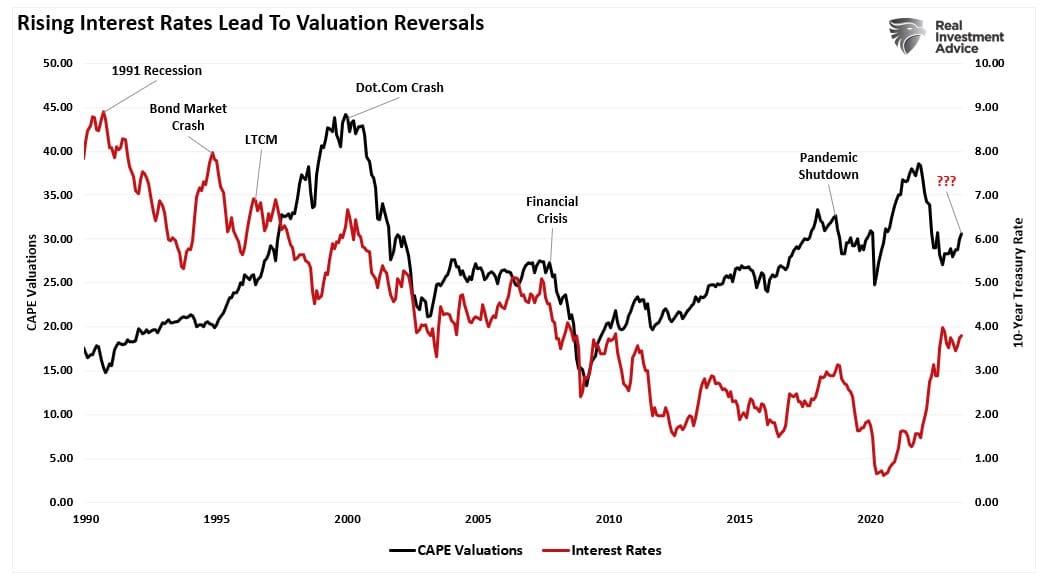
While Wall Street is scrambling to find excuses for why “this time is different,” it probably isn’t.
Timing is always an issue, but outcomes from aggressive rate increases have always been the same. More importantly, the drivers for more substantial economic growth in the future to support higher interest rates and inflation are absent. The current spat of economic resiliency remains a function of massive monetary injections still working their way through the economy. As we noted last week:
“This surge in money supply also explains why a recession remains so elusive. While the annual rate of change in the money supply has plunged, which is why inflation is contracting, the money injected into the economy is still in circulation. We know this by examining the money supply as a percentage of the economy.
Yes, M2 as a percentage of GDP spiked during the pandemic-driven spending frenzy, but notice that M2 has risen steadily since the “Financial Crisis.”
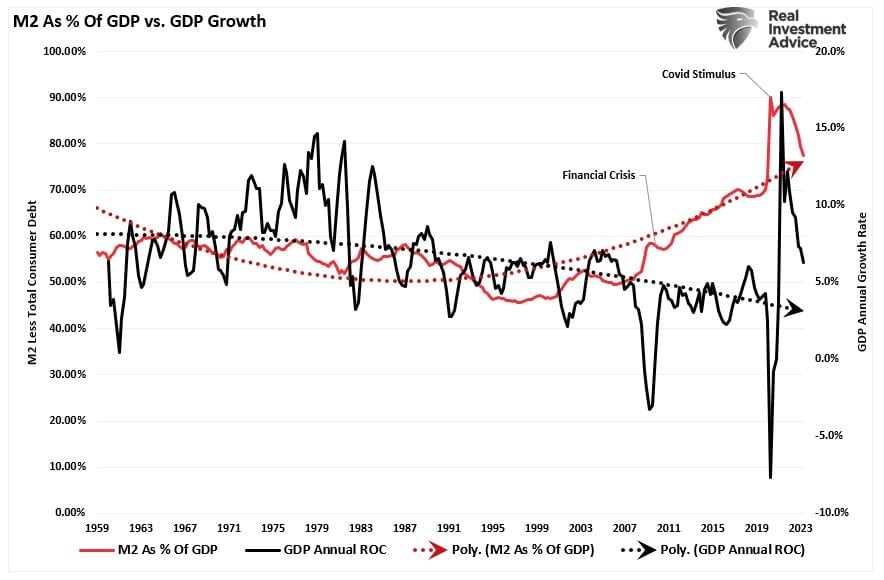
As that liquidity reverses, as Michael Lebowitz noted above, the impact of debt will begin to reverse the current economic growth trends.
The risk for the Federal Reserve is that it may well get its wish of slower economic growth to quell inflation. However, as has always been the case previously, it may well end up finding itself in a battle combatting a recession.
For stock investors, the risk is evident that interest rates and an economic slowdown will make current valuations challenging to sustain.
However, as discussed last week, such is a great environment to own long-dated Treasuries.
How We Are Trading It
Overall, bullish sentiment did reverse over the last couple of weeks as the correction ensued. Such is not surprising, but the good news is that the reversal of bullish sentiment supports the potential for the next rally. However, as noted above, many risks, such as interest rates, could continue to weigh on stock prices. However, the bullish trend that started this past October remains intact for now, so we must honor that trend for now.
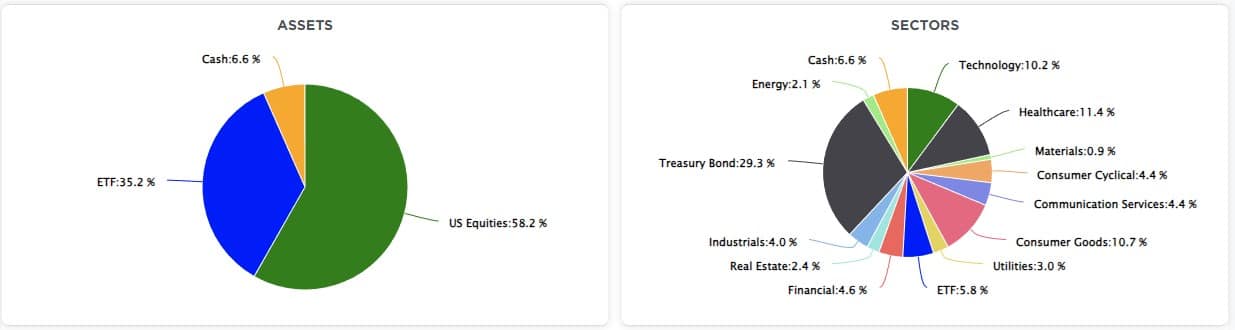
As noted over the last few weeks, we used the correction opportunistically to increase equity exposure overall and rebalance portfolio sectors closer to index weightings. We still expect a year-end push as portfolio managers chase performance to close the year. However, something else can always happen, so we remain risk-aware.
For now, remain cautious and rebalance portfolio risk accordingly until this corrective process is complete.
Have a great weekend.
Research Report
Subscribe To “Before The Bell” For Daily Trading Updates
We have set up a separate channel JUST for our short daily market updates. Please subscribe to THIS CHANNEL to receive daily notifications before the market opens.
Click Here And Then Click The SUBSCRIBE Button
Subscribe To Our YouTube Channel To Get Notified Of All Our Videos
Bull Bear Report Market Statistics & Screens

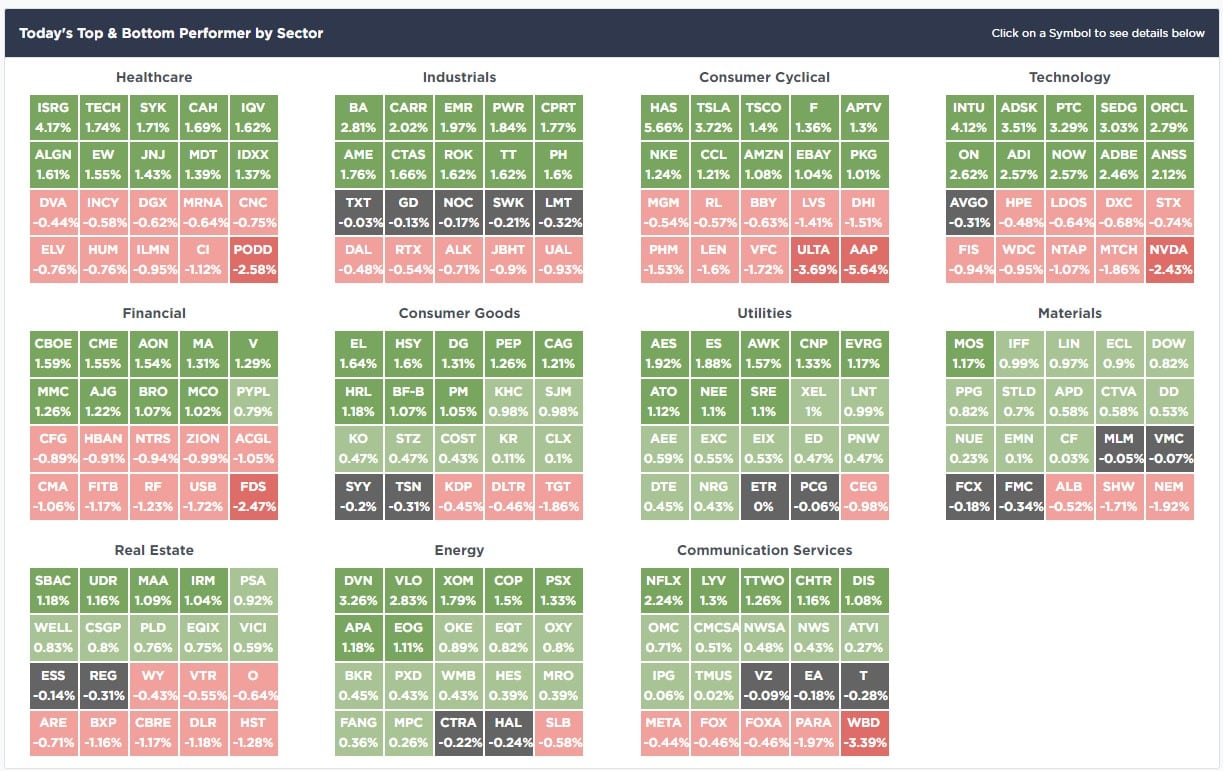
SimpleVisor Top & Bottom Performers By Sector
S&P 500 Weekly Tear Sheet
Relative Performance Analysis
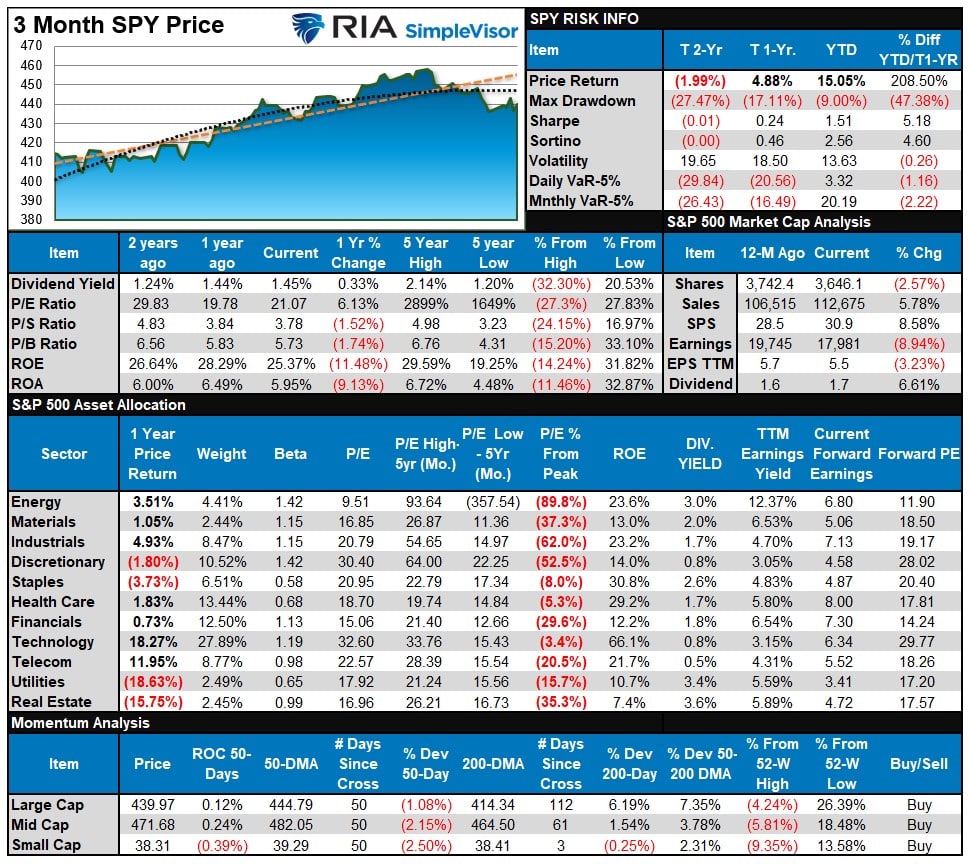
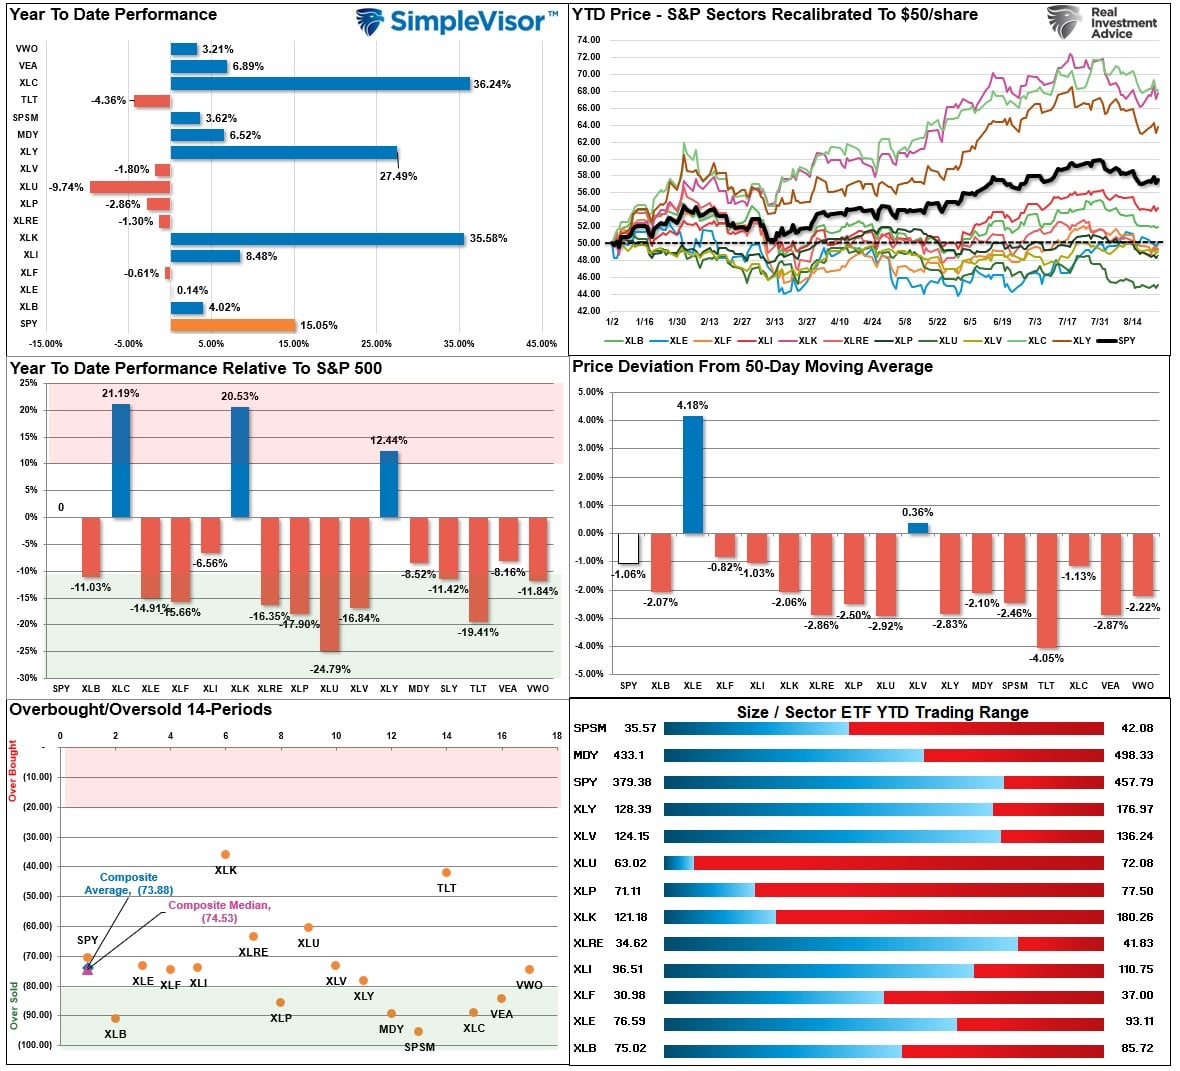
Last week, we suggested that investors “expect a rally this week, given that most sectors and markets are trading in short-term oversold conditions. The Risk/Range report shows that most sectors and markets have fallen outside their normal ranges, combined with short-term oversold conditions. Such will likely contribute to a short-term rally.”
While the market rallied on Friday following Powell’s speech, most markets and sectors remain more oversold than not, suggesting a likely continuation of the rally this week. Small and Mid-Cap markets remain the most oversold, with Bonds and Technology stocks midway through a reversal. Maintain positioning for now, we will look to rebalance exposures once back to more overbought short-term conditions.
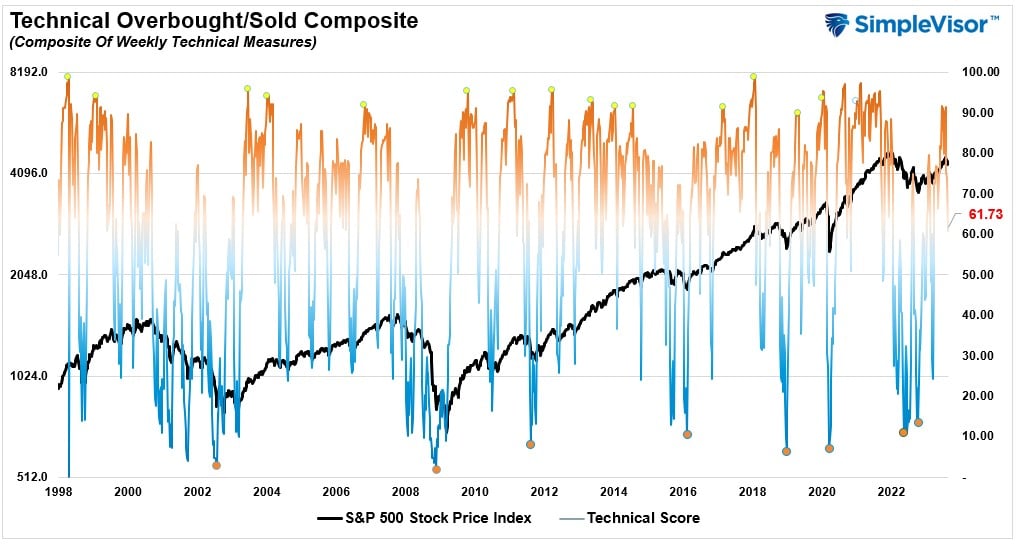
Technical Composite
The technical overbought/sold gauge comprises several price indicators (R.S.I., Williams %R, etc.), measured using “weekly” closing price data. Readings above “80” are considered overbought, and below “20” are oversold. The market peaks when those readings are 80 or above, suggesting prudent profit-taking and risk management. The best buying opportunities exist when those readings are 20 or below.
The current reading is 61.73 out of a possible 100.
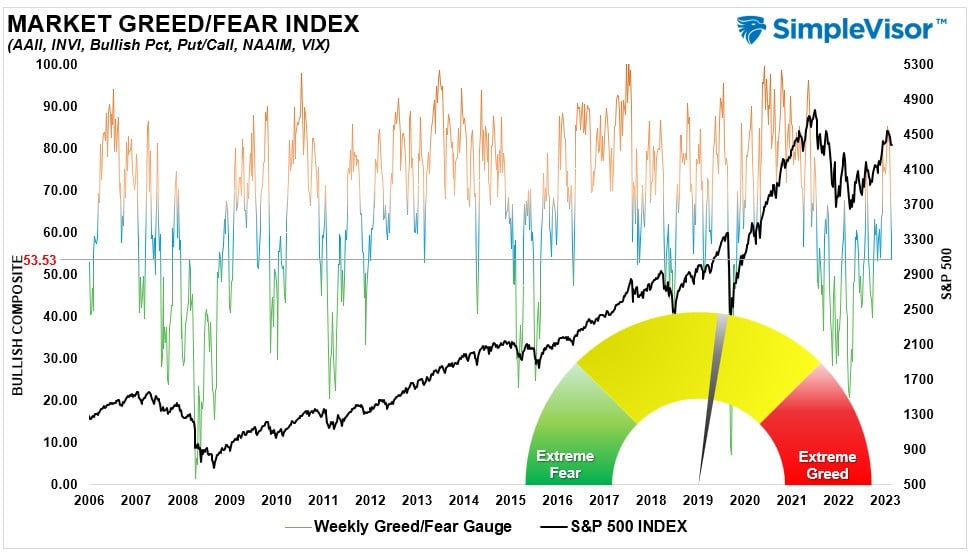
Portfolio Positioning “Fear / Greed” Gauge
The “Fear/Greed” gauge is how individual and professional investors are “positioning” themselves in the market based on their equity exposure. From a contrarian position, the higher the allocation to equities, the more likely the market is closer to a correction than not. The gauge uses weekly closing data.
NOTE: The Fear/Greed Index measures risk from 0 to 100. It is a rarity that it reaches levels above 90. The current reading is 53.53 out of a possible 100.
Relative Sector Analysis
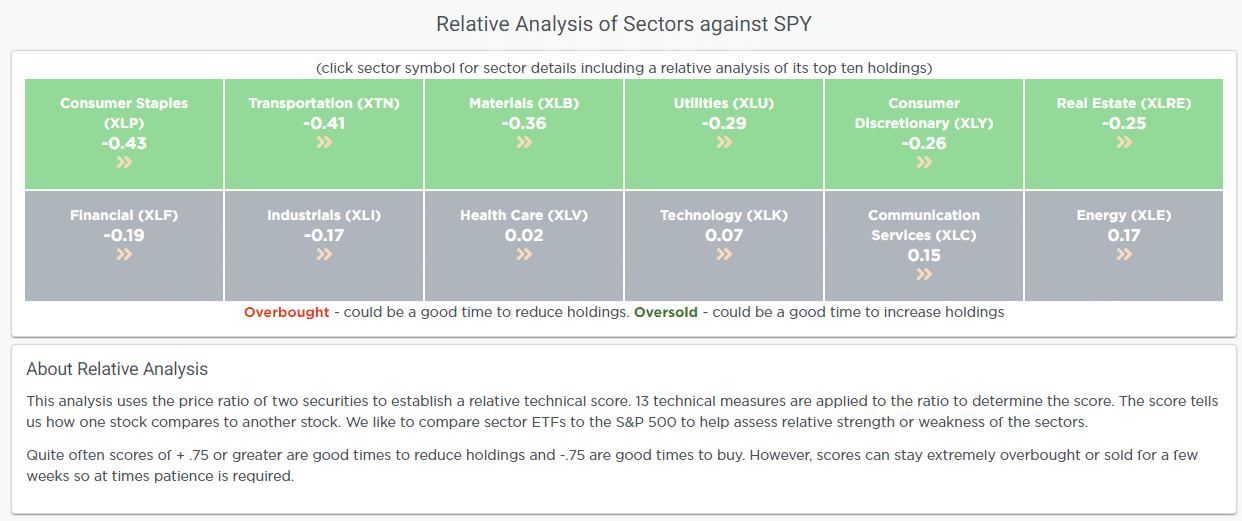
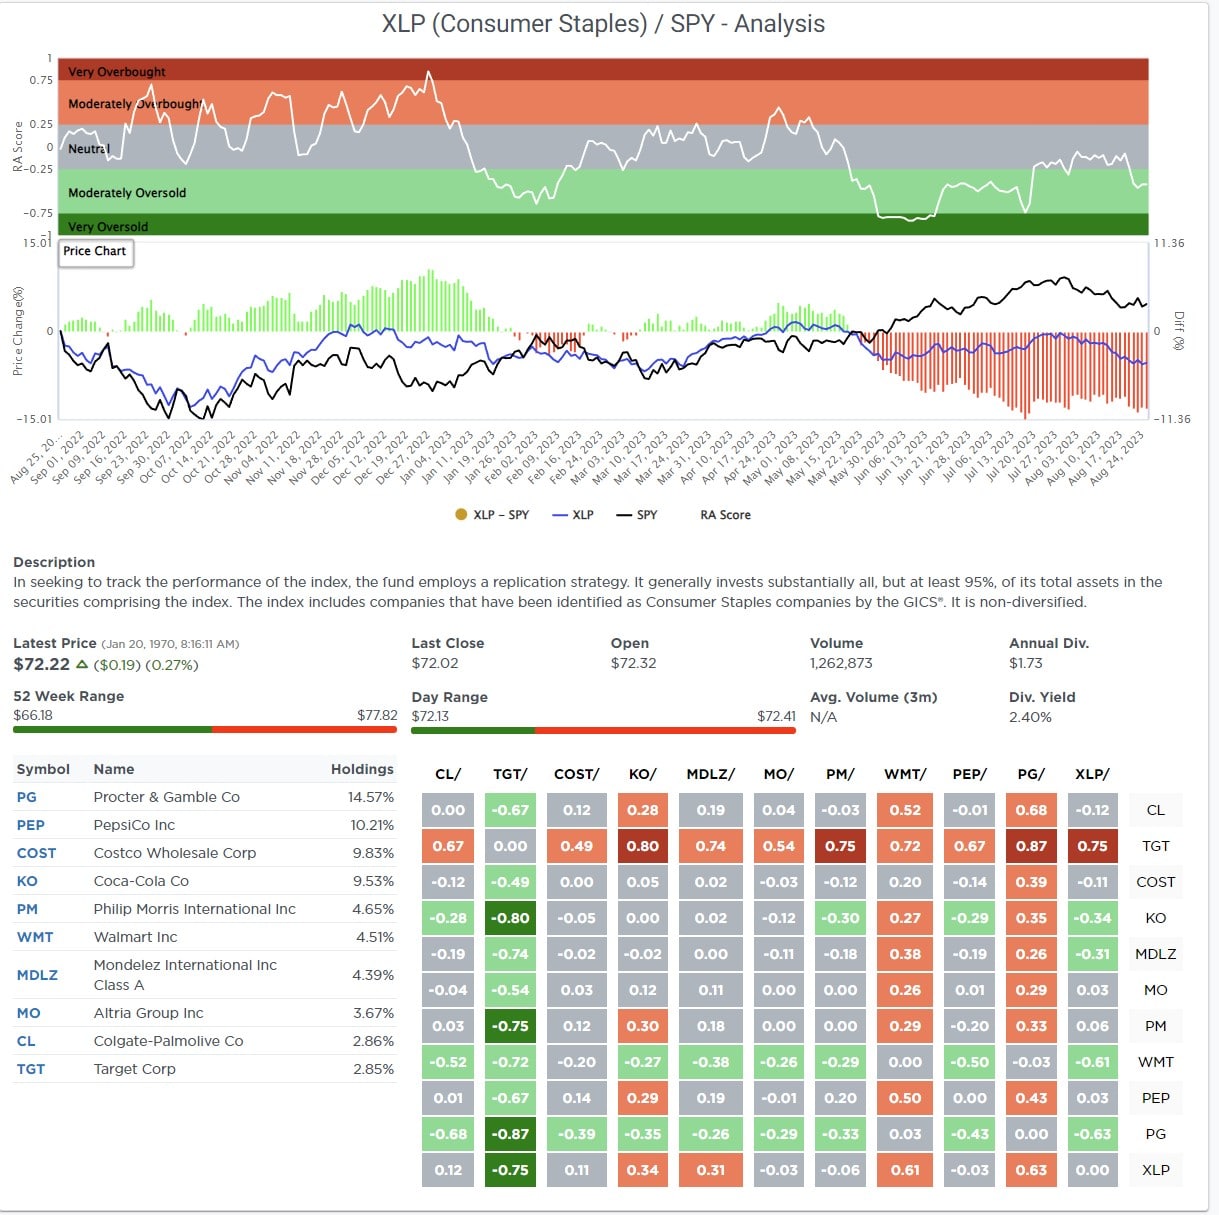
Most Oversold Sector Analysis
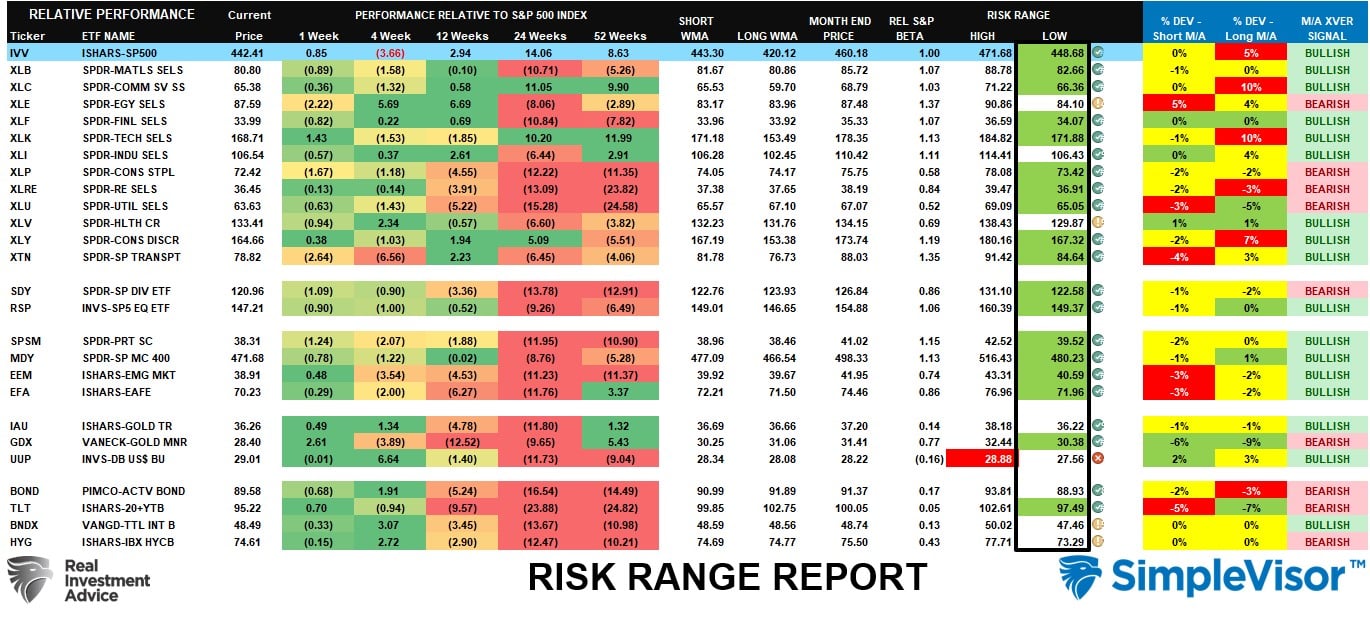
Sector Model Analysis & Risk Ranges
How To Read This Table
- The table compares the relative performance of each sector and market to the S&P 500 index.
- “MA XVER” (Moving Average Crossover) is determined by the short-term weekly moving average crossing positively or negatively with the long-term weekly moving average.
- The risk range is a function of the month-end closing price and the “beta” of the sector or market. (Ranges reset on the 1st of each month)
- The table shows the price deviation above and below the weekly moving averages.
As noted last week,
“It’s probably time for a short-term rally. Most markets and sectors are trading well below their normal monthly risk ranges. Combined with the technically oversold condition, as shown by the Relative Performance Analysis above, a short-term rally toward the 50-DMA should be expected. Until the market registers a technical buy signal, short-term rallies should be used to rebalance equity risk accordingly.”
That rally probably started on Friday. While it could be a bumpy move higher, most markets and sectors remain oversold enough to support some short-term gains. Use rallies to rebalance risks accordingly.
Weekly SimpleVisor Stock Screens
We provide three stock screens each week from SimpleVisor.
This week, we are searching for the Top 20:
- Relative Strength Stocks
- Momentum Stocks
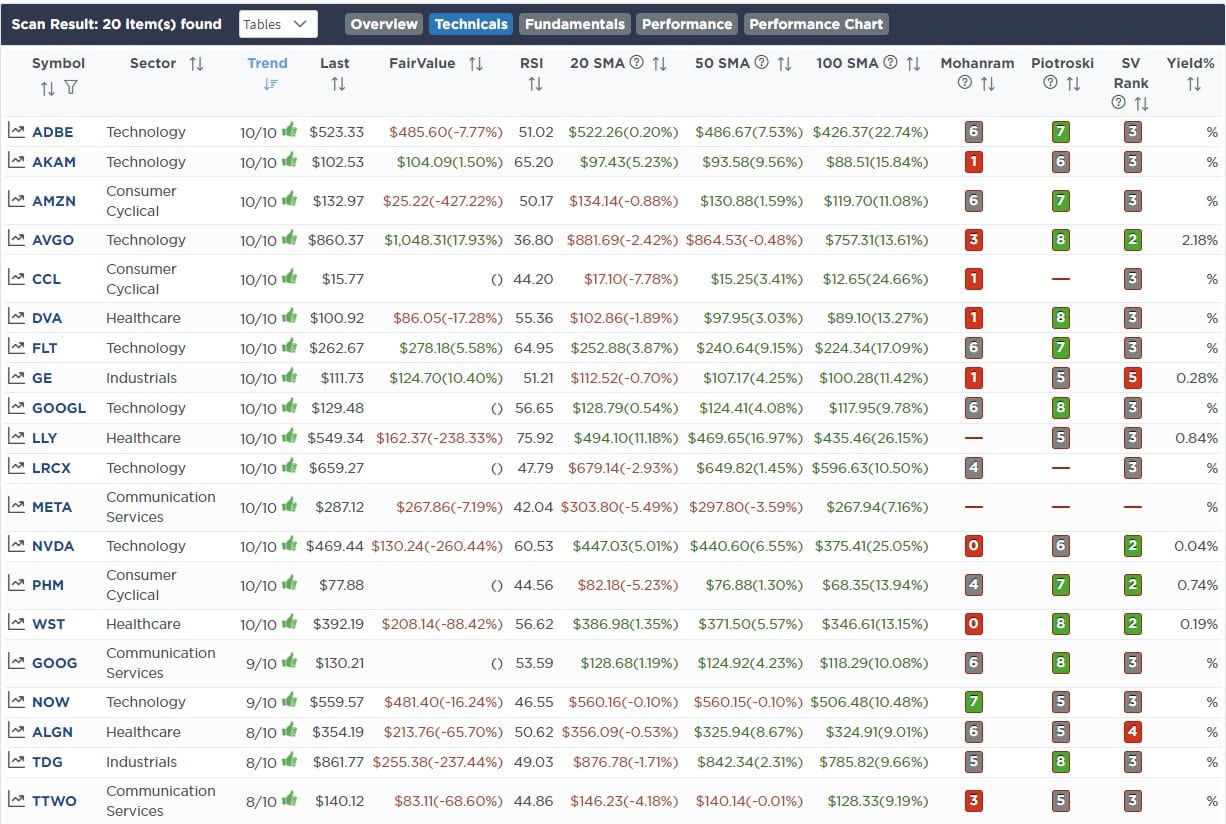
- Fundamental & Technical Strength
(Click Images To Enlarge)
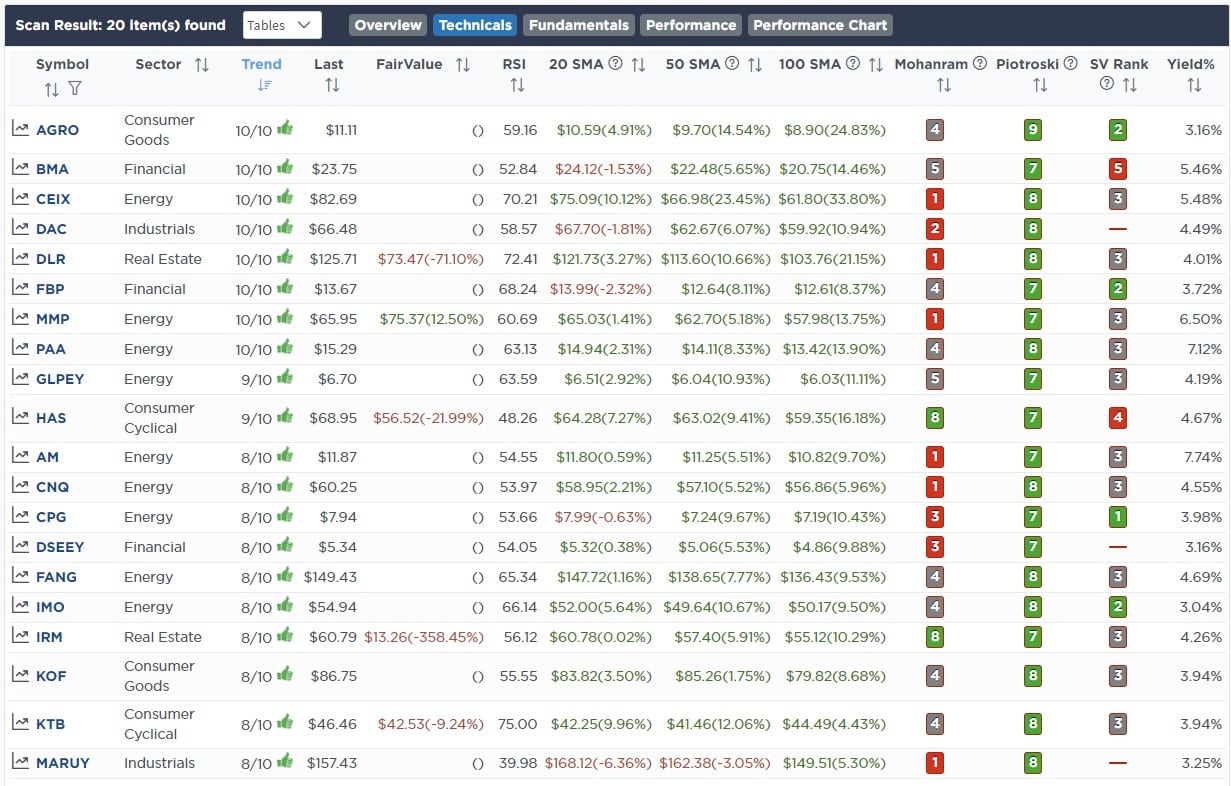
R.S.I. Screen
Momentum Screen
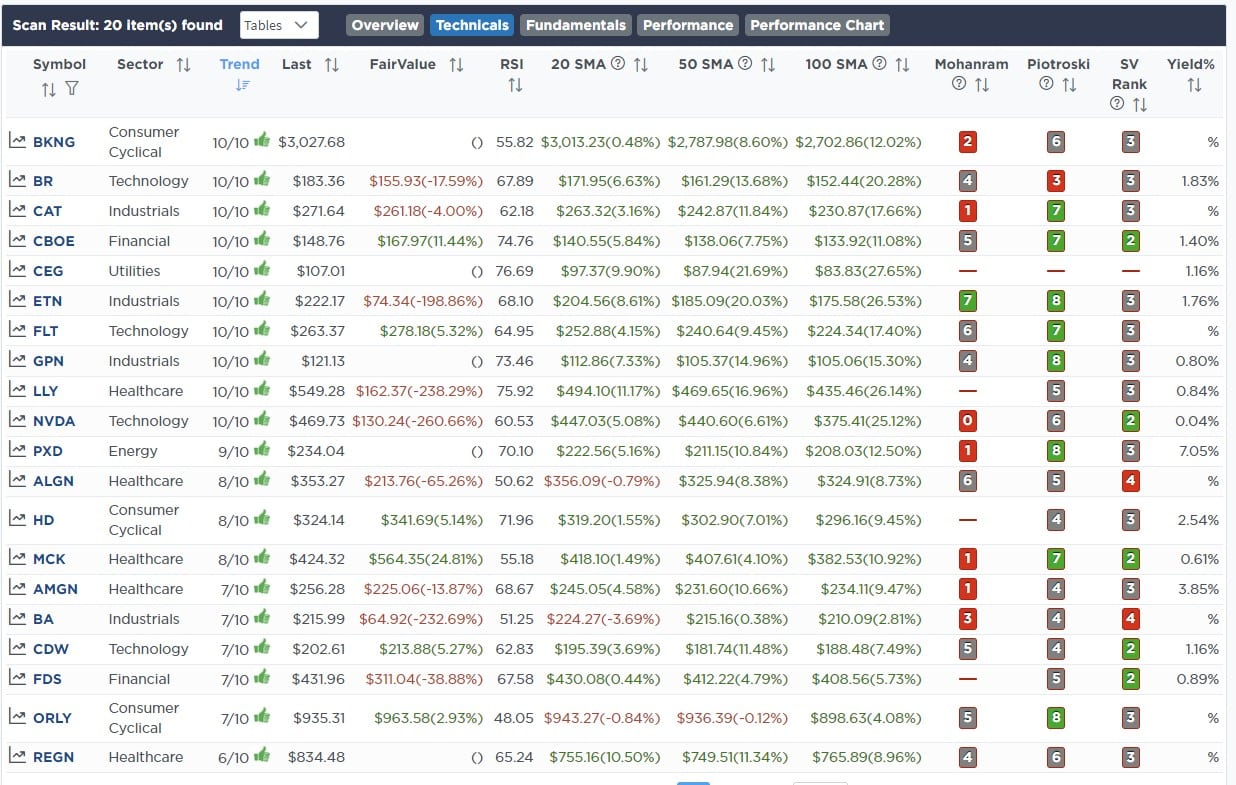
Fundamental & Technical Strength
SimpleVisor Portfolio Changes
We post all of our portfolio changes as they occur at SimpleVisor:
No Trades This Week

Lance Roberts, C.I.O.
Have a great week!


