Volatility Spikes As The Quarter Comes To An End


Inside This Week’s Bull Bear Report
- Volatility Spikes As The Quarter Ends
- Technical Levels Suggestive Of A Rally
- How We Are Trading It
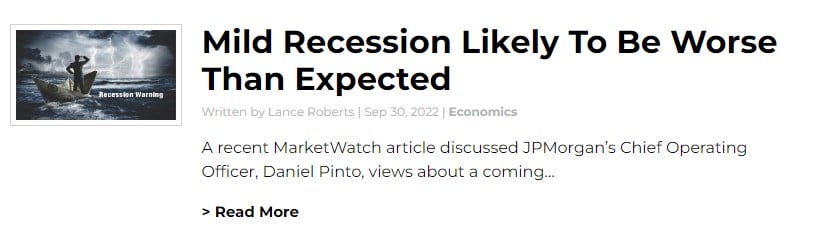
- Research Report -Mild Recession May Be Worse
- Market Review With Adam Taggart
- Stock Of The Week
- Daily Commentary Bits
- Market Statistics
- Stock Screens
- Portfolio Trades This Week
Volatility Spikes As The Quarter Ends
Another tough week for the markets as the Fed continued its “tough talk” on the inflation front. As we noted last week:
“Such leaves the markets in a very tenuous position. However, in the short-term, markets are testing this year’s lows and are sufficiently oversold to provide a relief rally. However, there is little to get excited about that until the Fed stops hiking rates aggressively and stops reducing its balance sheet.”
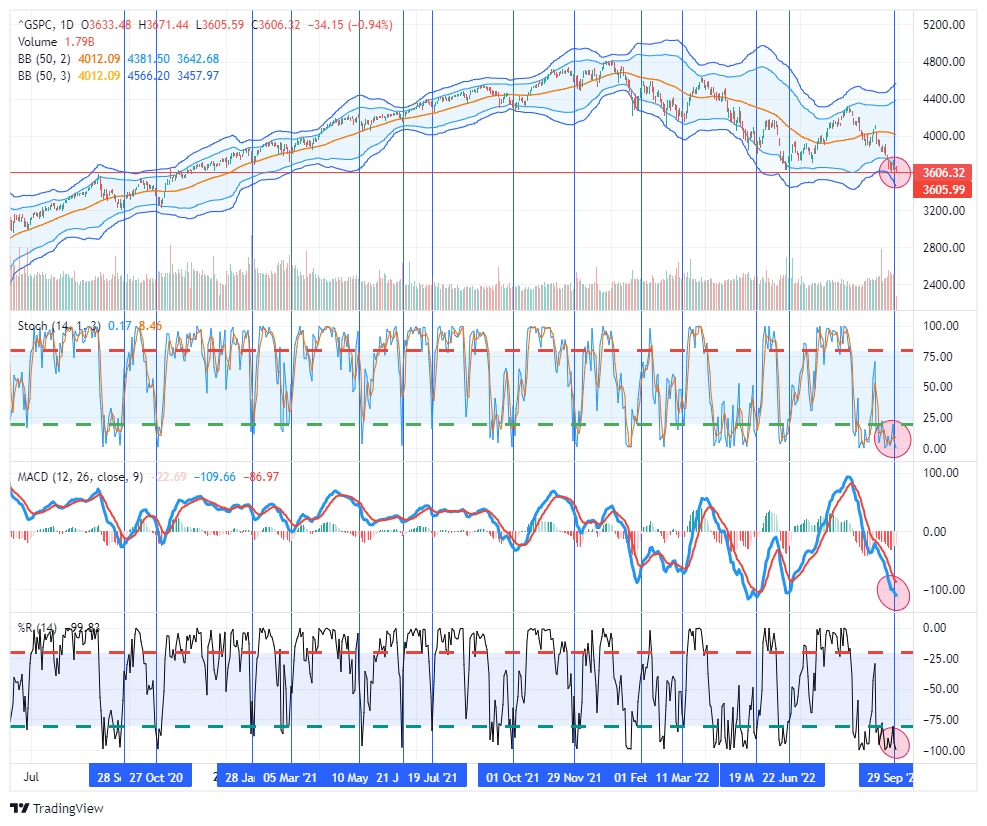
On Friday, the market took out the June lows but is testing support going back to the peaks in 2020. As noted, every technical indicator is now screaming oversold. As shown by the vertical lines, when the market had previously hit such lows across indicators, such was typically near a short-term bottom. We suspect that as we enter into October, we could see a more sustainable reflexive rally to roughly 3850 on the S&P 500. Investors should continue to use such rallies to raise cash and rebalance risk accordingly.
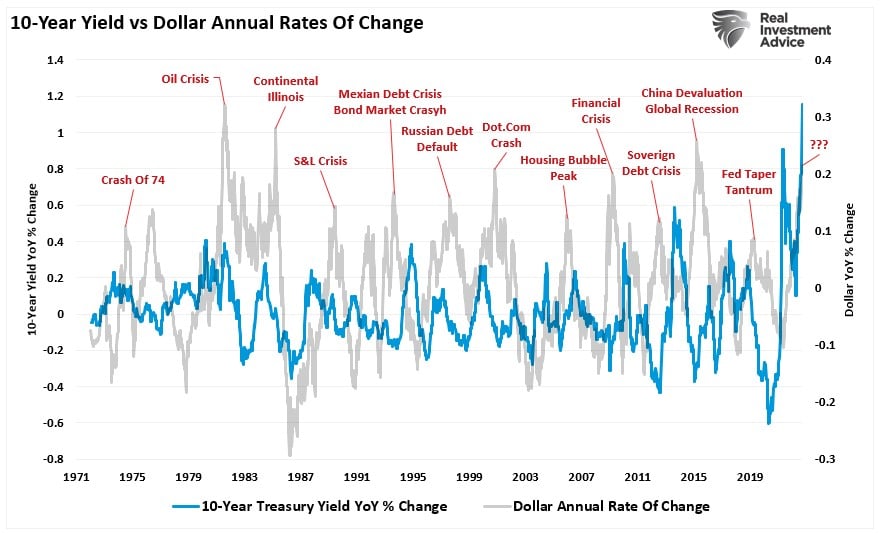
So far, the Federal Reserve has remained blessed with a very stable market environment. However, on Wednesday, the Bank of England started buying bonds as the U.K. pension system faced potential insolvency from surging margin calls. Investors should not overlook the importance of those actions. Such was the subject of an article I wrote for MarketWatch. The crux of the article was the combined impact of tighter monetary policy combined with a surging dollar and rates was the recipe for “financial instability.”
“Furthermore, the surge in the dollar, driven by higher rates, accompanied the sharpest increase in interest rates in history. That’s problematic, particularly in heavily indebted economies, as debt-servicing requirements and borrowing costs surge. Interest rates alone can destabilize an economy, but when combined with a surging dollar and inflation, the risks of market instability increase markedly.”
That article may be very timely, as noted by Charles Gasparino on Twitter:
The risk of market instability is rising, as seen in the volatility spike this past week. While that volatility spike remains subdued, it has reached the warning zone, suggesting something may be near breaking in the markets.
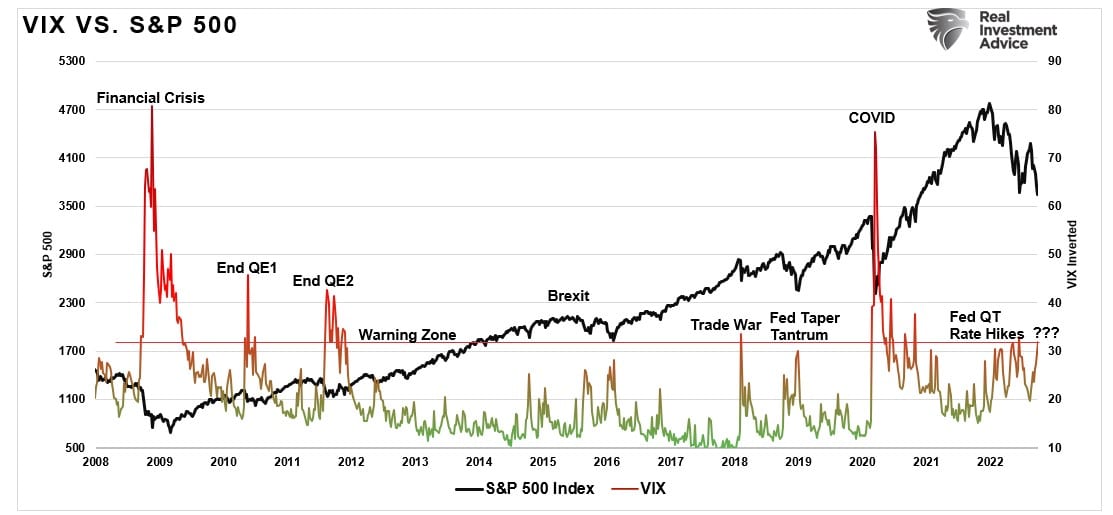
We will continue to watch volatility closely. In the meantime, both markets and sentiment are at such bearish levels the risk-reward is now favorable for traders. We will review the daily, weekly, and monthly charts for what we expect could happen next.
Need Help With Your Investing Strategy?
Are you looking for complete financial, insurance, and estate planning? Need a risk-managed portfolio management strategy to grow and protect your savings? Whatever your needs are, we are here to help.

Technical Levels Suggestive Of A Reflexive Rally
While the recent volatility spike is concerning, it is essential to put the market into some perspective. As bearish sentiment increases, it is easy to get trapped in negative psychology during the decline. However, as Bob Farrell once stated, “investors tend to buy the most at the top and the least at the bottom.”
When analyzing the market, we use different time frames for understanding market risk and trends. The daily chart of the S&P 500 index above confirms the adverse price action weighing on investors.
However, with the market trading 3-standard deviations below the 50-dma, such has previously preceded a reflexive rally in the market. Furthermore, as discussed in “The Big Short Squeeze:”
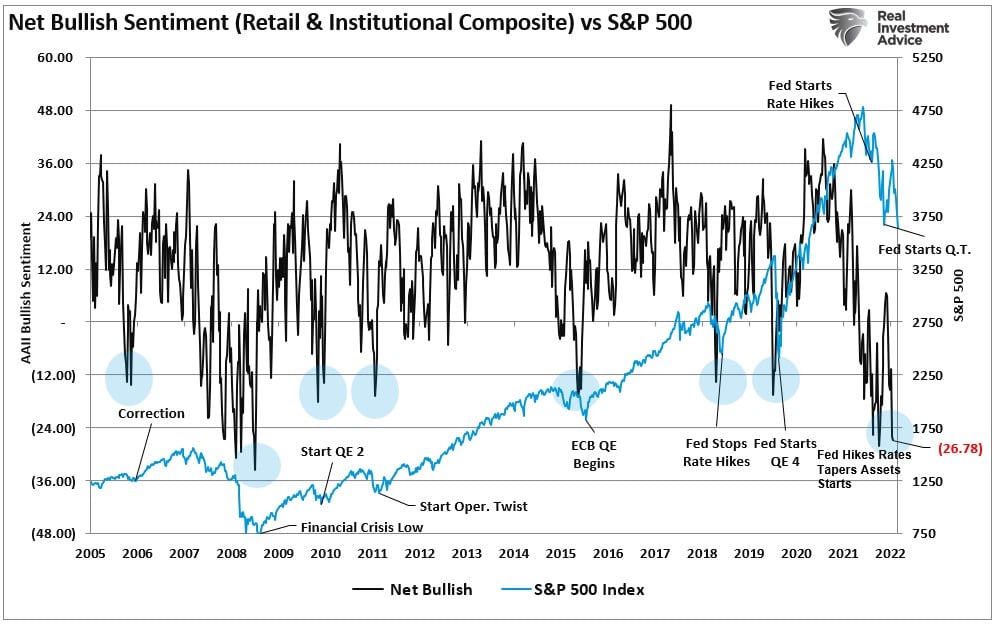
“Currently, everyone is once again bearish. CNBC is again streaming “Markets In Turmoil” banners, and individuals are running for cover. Our composite investor sentiment index is back to near “Financial Crisis” lows.
We agree investors should be more cautious in their portfolio allocations. However, such is a point where investors make the most mistakes. Emotions make them want to sell. However, from a contrarian view, such is the time you need to avoid that impulse.”
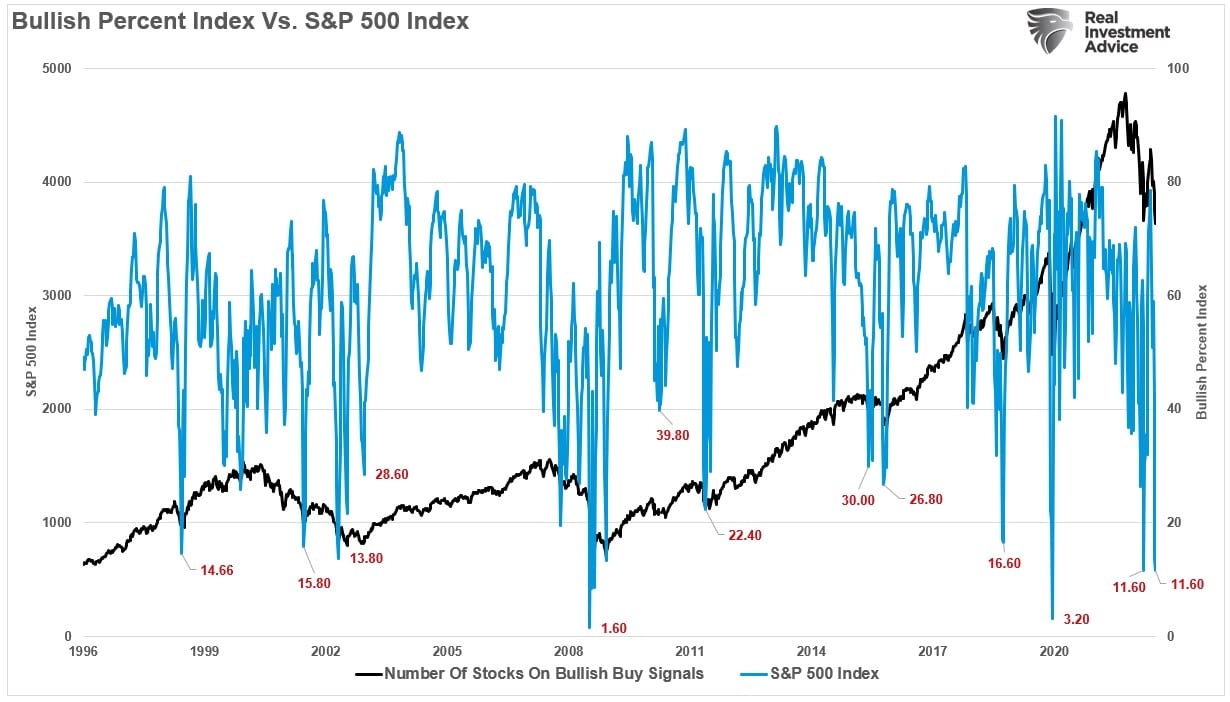
Another contrarian indicator we noted was the number of S&P 500 stocks on bullish “buy” signals. With just 11.6% of stocks on bullish buy signals, such has historically denoted a short-term market bottom at a minimum.
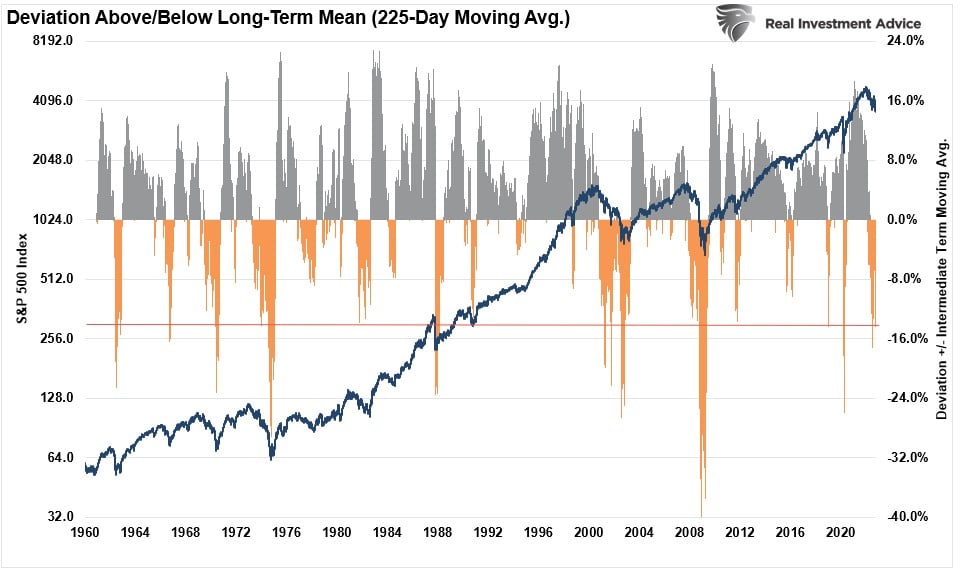
Lastly, the more extreme deviation from the 225-day moving average suggests a short-term bottom. While deviations are more extreme during recessionary periods, the market is currently 15% below its moving average. Such extremes tend to precede short-term reversals and intermediate-term rallies, even in ongoing bear markets.
While it is certainly easy to be extremely negative on the market, given recent market action, it is almost always better not to “panic sell” market lows. The market will allow you to exit positions at better prices, don’t try to outsmart the market.
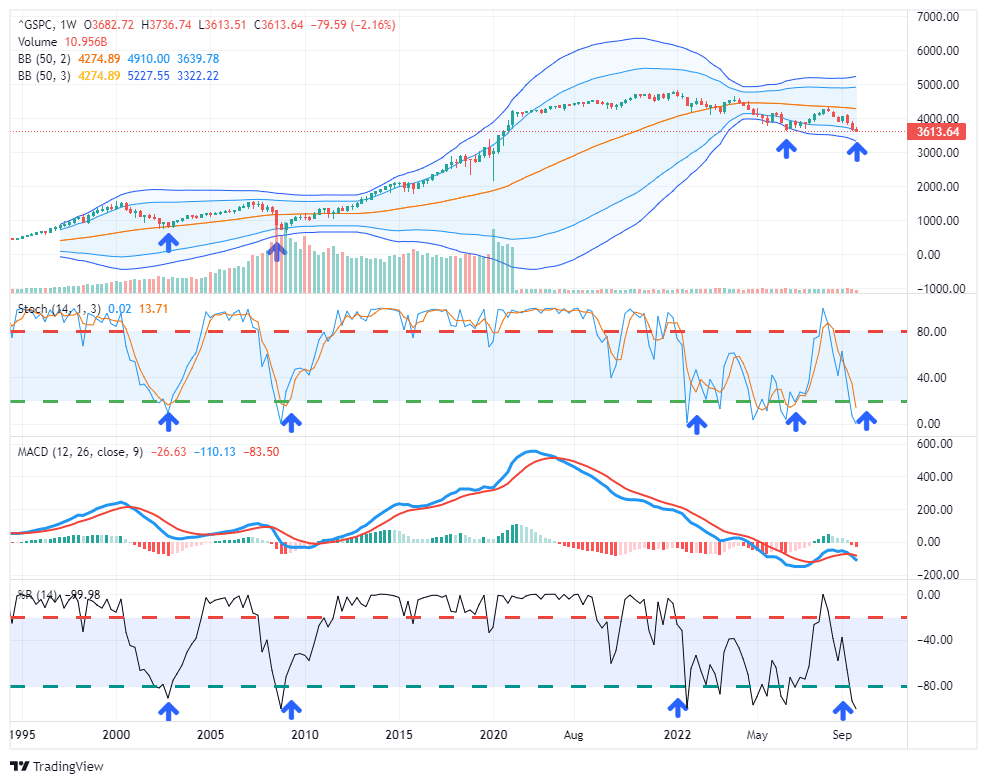
Market Review – Weekly Chart
For investors, the outlook remains concerning. However, on an intermediate-term basis, the market is very oversold, which suggests a reflexive rally is likely. As shown, over the last 22 years, there are only three occasions where the market was 2- or 3-standard deviations below the 50-week moving average. Furthermore, there are only a handful of periods where the weekly Stochastic and Williams %R indicators were at such extreme lows.
Each of these more extreme lows also coincided with volatility spikes that preceded either an early market-bottoming process or a reflexive rally. While this time could certainly be different, it is worth giving history the benefit of the doubt.
Since weekly charts move slower, this does not mean the markets will rally immediately. Long-term charts indicate that volatility spikes will likely continue, and investors should monitor their risk accordingly. Just as momentum-driven bull markets can defy logic longer than many expect, bear markets work just the same.
The chart below shows the price deviation from the one-year weekly moving average. Given the negative deviation is at one of the lower historical levels, such also suggests a reflexive rally is likely.

A longer-term monthly view suggests the market still has more downside risk.
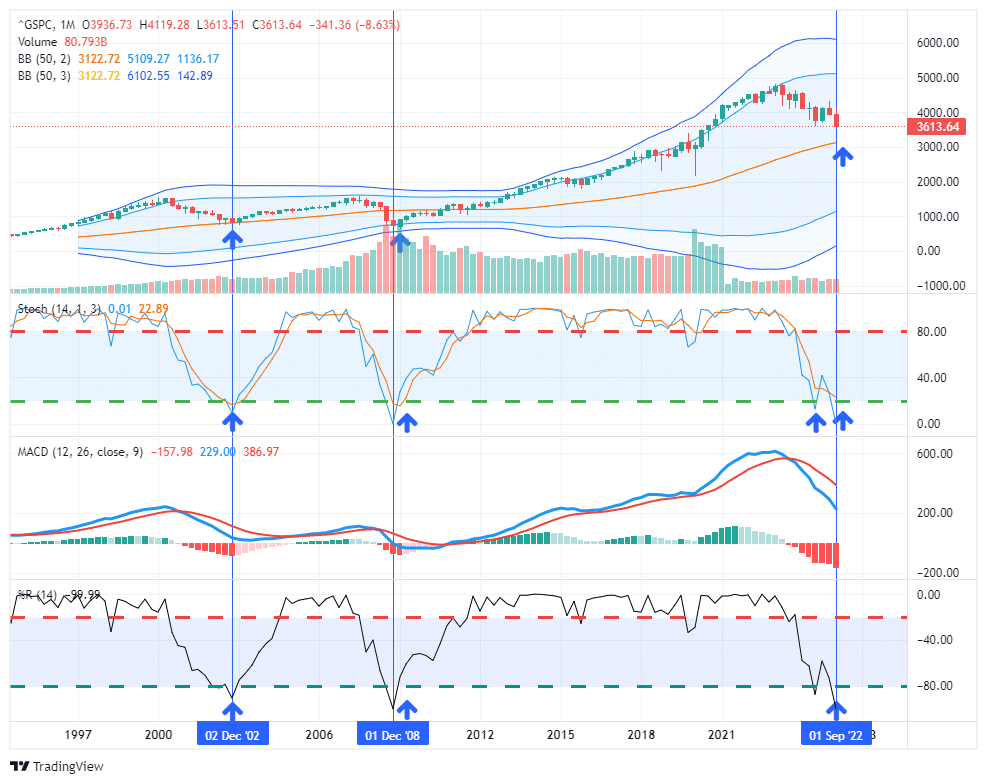
Long-Term View Is Bearish
The monthly chart of the S&P 500 remains problematic. Notably, long-term charts predict long-term outcomes. They are NOT SUITABLE for trading portfolios short-term. So caution is advised.
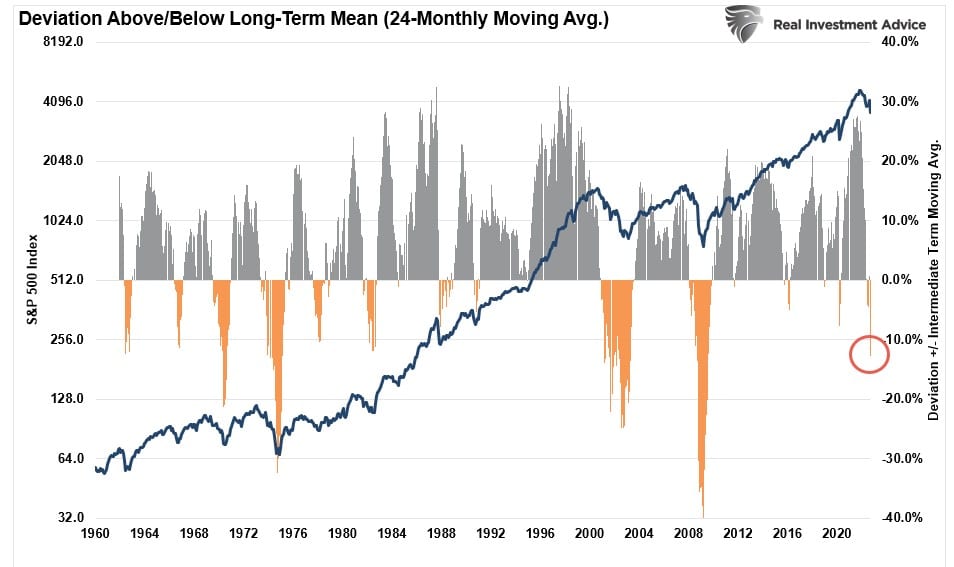
However, over the last 22 years, extreme deviations above the 24-month moving average have always led to “mean reverting” events. During the “Dot.com Crash,” the market retested its long-term mean. During the “Financial Crisis,” the market made a complete reversion pushing into 3-standard deviations below the mean. The market exhibits the same extreme oversold conditions as in 2002 and 2008. However, the market has yet to retrace to its 24-month moving average, which currently resides around 3000 on the index. While the market doesn’t need to retest that long-term mean to make a bottom, moving averages are a magnet for prices.
We see the same problematic setup when viewing the market’s current deviation from its 2-year monthly moving average. The depth of the current deviation has only occurred 4-times since 1960. Previously, such led to a deeper correction over the next several months. (Some are worse than others.)
Given the more extreme oversold condition daily, weekly, and monthly, we continue to expect a reflexive rally. Interestingly, we were saying the same thing near the June lows, just before the 17% rally into August. We expect a retracement to 3900-4000 on the S&P 500 index will be a suitable level to rebalance portfolio risks heading into next year.
Notably, valuations, interest rates, and economic indicators suggest lower asset prices in 2023, mainly if, as expected, a recession occurs. Just as it was in February 2021 when I discussed these same technical deviations:
While valuations and long-term deviations suggest problems for the markets ahead, such can remain the case for quite some time. It is this long lead time that always leads investors to believe “this time is different.”
It is the same in bear markets, only in reverse.
Not Getting The Bull Bear Report Each Week In Your Mailbox? Subscribe Here For Free.
How We Are Trading It
So, understanding that markets are deeply oversold on multiple levels, we feel there is a reasonable risk-reward ratio to the markets currently. As I noted last week, depending on your time horizon, there are two current ways to approach the market.
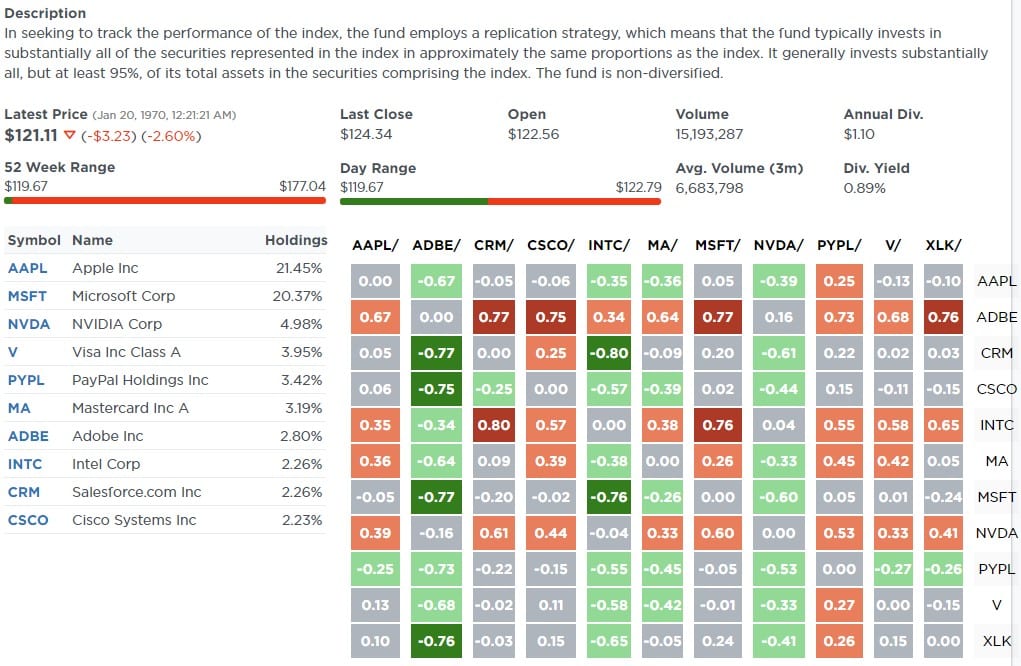
Short-Term Traders can add to beaten-down equities and look for sector rotations opportunistically. Our SimpleVisor.com “Relative Analysis” page can help you find oversold sectors and equities and provide tradeable opportunities. Real Estate is hugely oversold relative to Healthcare; however, Real Estate has an interest rate problem. Therefore, we would probably look to Technology for a risk-on tradeable bounce.

If we look at the top-10 holdings of the Technology sector, we see several companies oversold relative to the sector itself and present tradeable opportunities to explore.
Long-Term Investors should use any rally to reduce portfolio risk and raise cash levels for now. As noted, markets are oversold enough for a tradeable rally back to the 50-dma, and while the market could rally further, don’t try and time the exit. Sell into the rally as it proceeds. When the rally eventually reverses, you will have reduced risk accordingly. We expect to see lower lows before the final market bottom, coinciding with a significant volatility spike and reversal of Fed policy.
As noted last week, the Fed funds futures market has priced in the Fed’s likely “terminal rate” on monetary policy going into 2023. We moved our cash holdings into short-term treasuries as we see no near-term catalysts to deploy that cash into equities. We made no changes to portfolios this past week but will be raising cash holdings on the next rally.

Short- and long-term investors should continue to follow the risk management rules.
- Re-evaluate overall portfolio exposures.
- Raise cash as needed. (Cash is a risk-free portfolio hedge)
- Review all positions (Sell losers/trim winners)
- Look for opportunities in other markets and assets.
- Add hedges to portfolios.
- Trade opportunistically.
- Drastically tighten up stop losses.
See you next week.
Research Report
Market Week In Review With Adam Taggart
Subscribe To Our Youtube Channel To Get Notified Of All Our Videos
Stock Of The Week In Review
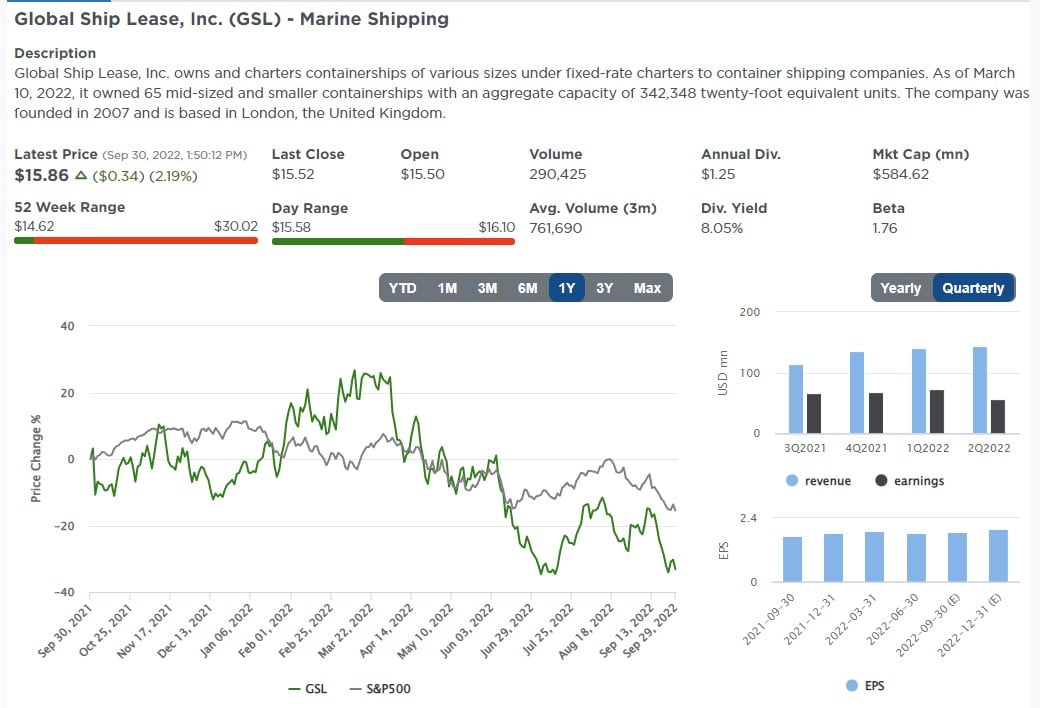
Beaten Up Value Stocks
As we typically see in bear markets, valuations can get very cheap as investors sell the good and the bad as they try to raise cash and limit losses. This bear market is no different. This week’s scan seeks stockR.M.that are down at least 30% this year with cheap valuations, good prospects for forward earnings growth, and a good earnings track record.
The stocks we chose are all small caps, ranging from $280 million to $1.8 billion. Three stocks are down about 50% this year, while the other two are down 30-35%. As a result, their valuations have become more attractive.
Screen Criteria
- EPS Growth next 5 Years >10%
- EPS Growth last 5 Years >10%
- Sales Growth last 5 Years >10%
- Forward P/E <5
- P/E <10
- Price to Cash Flow <10
- PEG <1
- YTD Performance <-30%
Global Ship Lease, Inc. (GSL)
Login to Simplevisor.com to read the full 5-For-Friday report.
Daily Commentary Bits
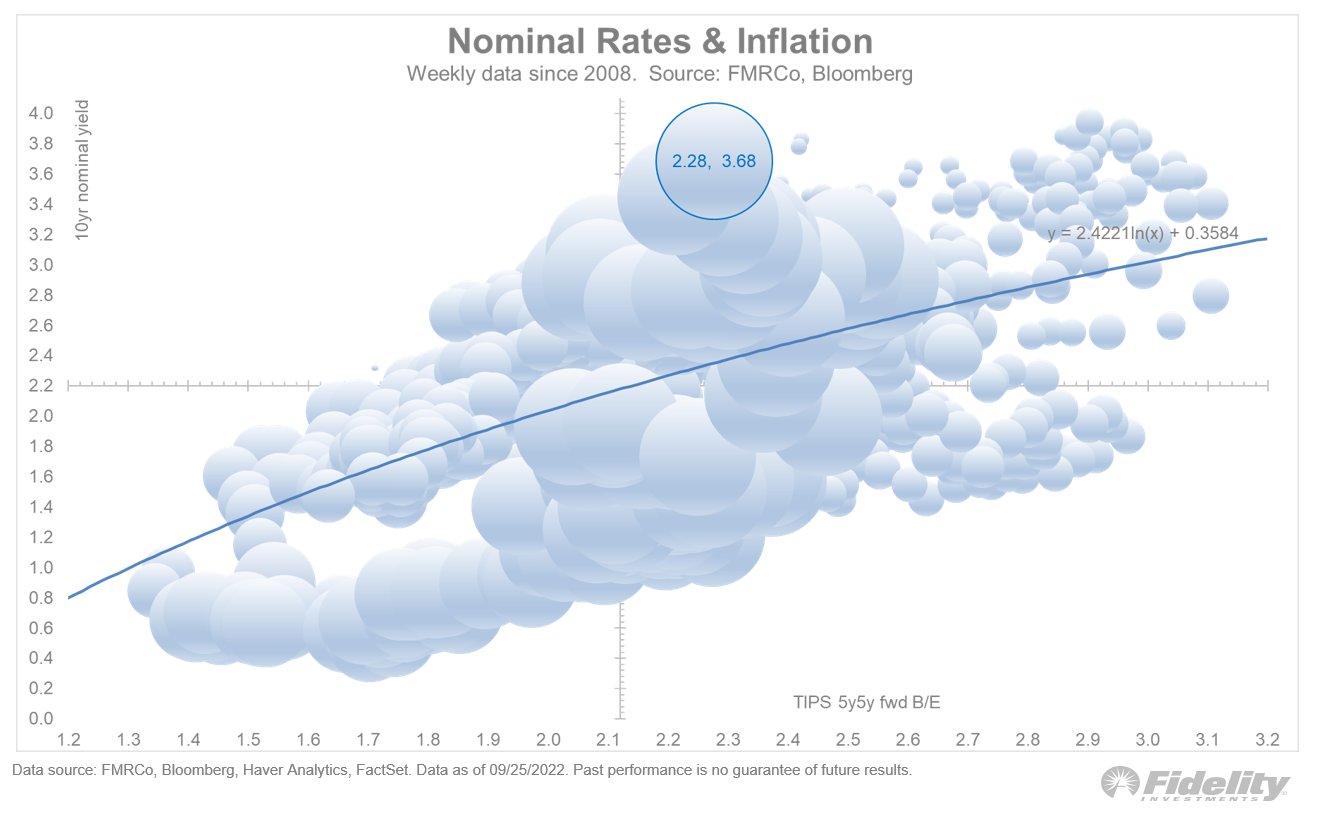
Bonds are Historically Cheap
The scatter plot below from Fidelity plots weekly levels of the ten-year UST yield and 5×5 inflation expectations. 5×5 inflation expectations are the implied five-year inflation rate bond traders expect five years from now. The current 5×5 rate is 2.28%. As a comparison, the next five-year implied inflation rate is 2.18%. The graph shows the current ten-year yield of 3.68% is 1.33% above the 2.35% trend line rate.
Fidelity took the analysis further and compared the ten-year rate to the five-year implied inflation rate average and the 5×5 inflation rate. This method captures yields versus the full ten-year of inflation expectations. Since 2010, on average, the Treasury note was 0.21% abovU.K.e aggregate expected inflation rate. Currently, it is 1.40% above it. Both methods show that bond yields are over 1% too high based on inflation expectations. Bottom line: bonds are a buy. However, many financial undercurrents, such as the U.K. pension fund selling, are unpredictable and, in some cases, unknown. These events can create significant volatility and temporarily increase yields further.
Click Here To Read The Latest Daily Market Commentary (Subscribe For Pre-Market Email)
Bull Bear Report Market Statistics & Screens

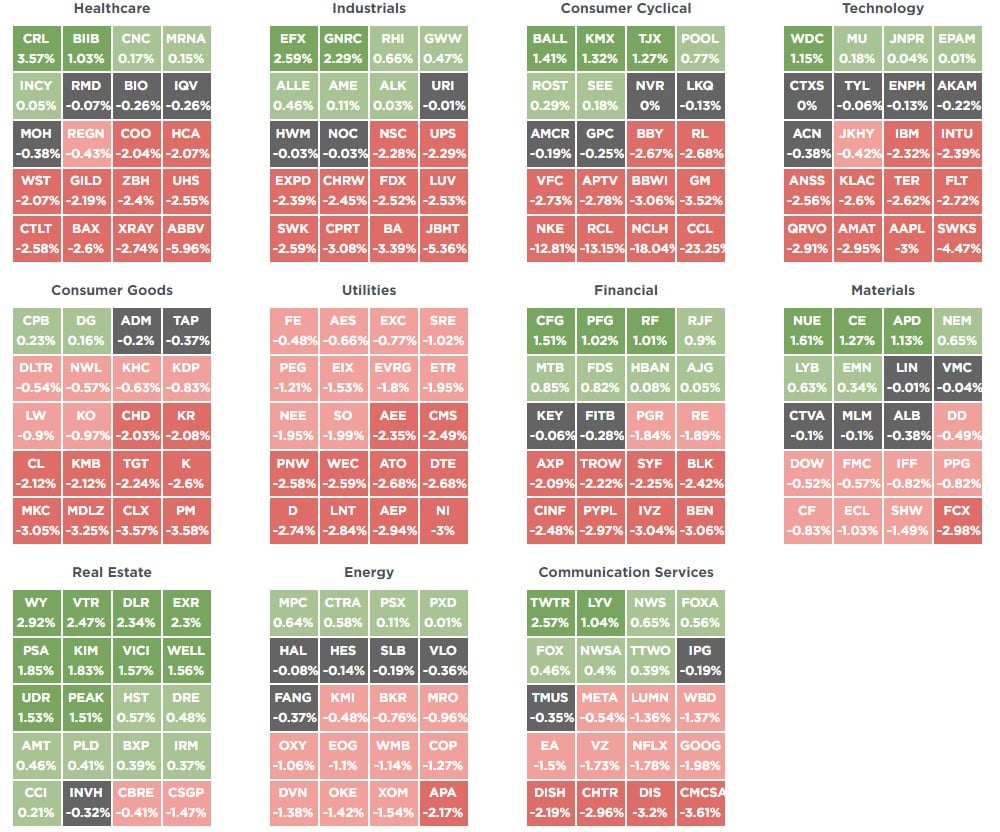
SimpleVisor Top & Bottom Performers By Sector
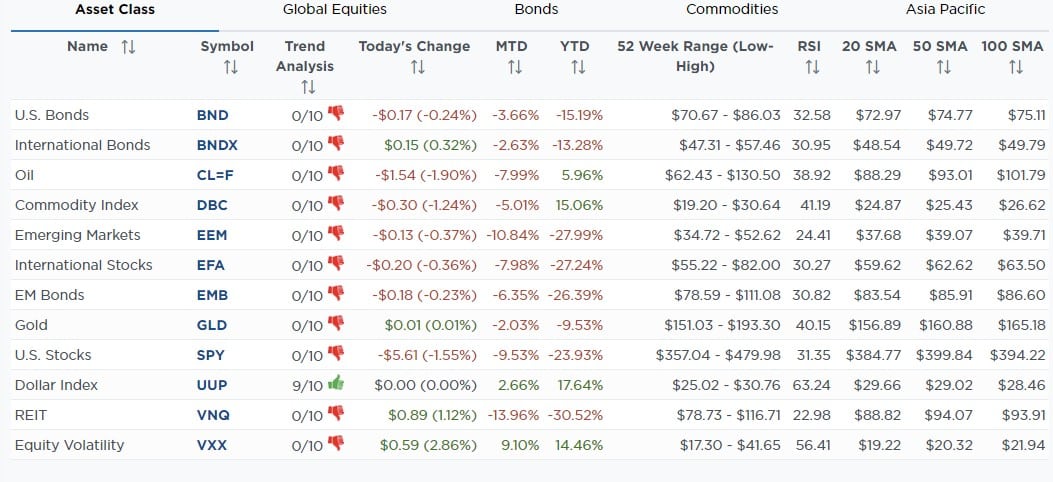
SimpleVisor Asset Class Trend Analysis
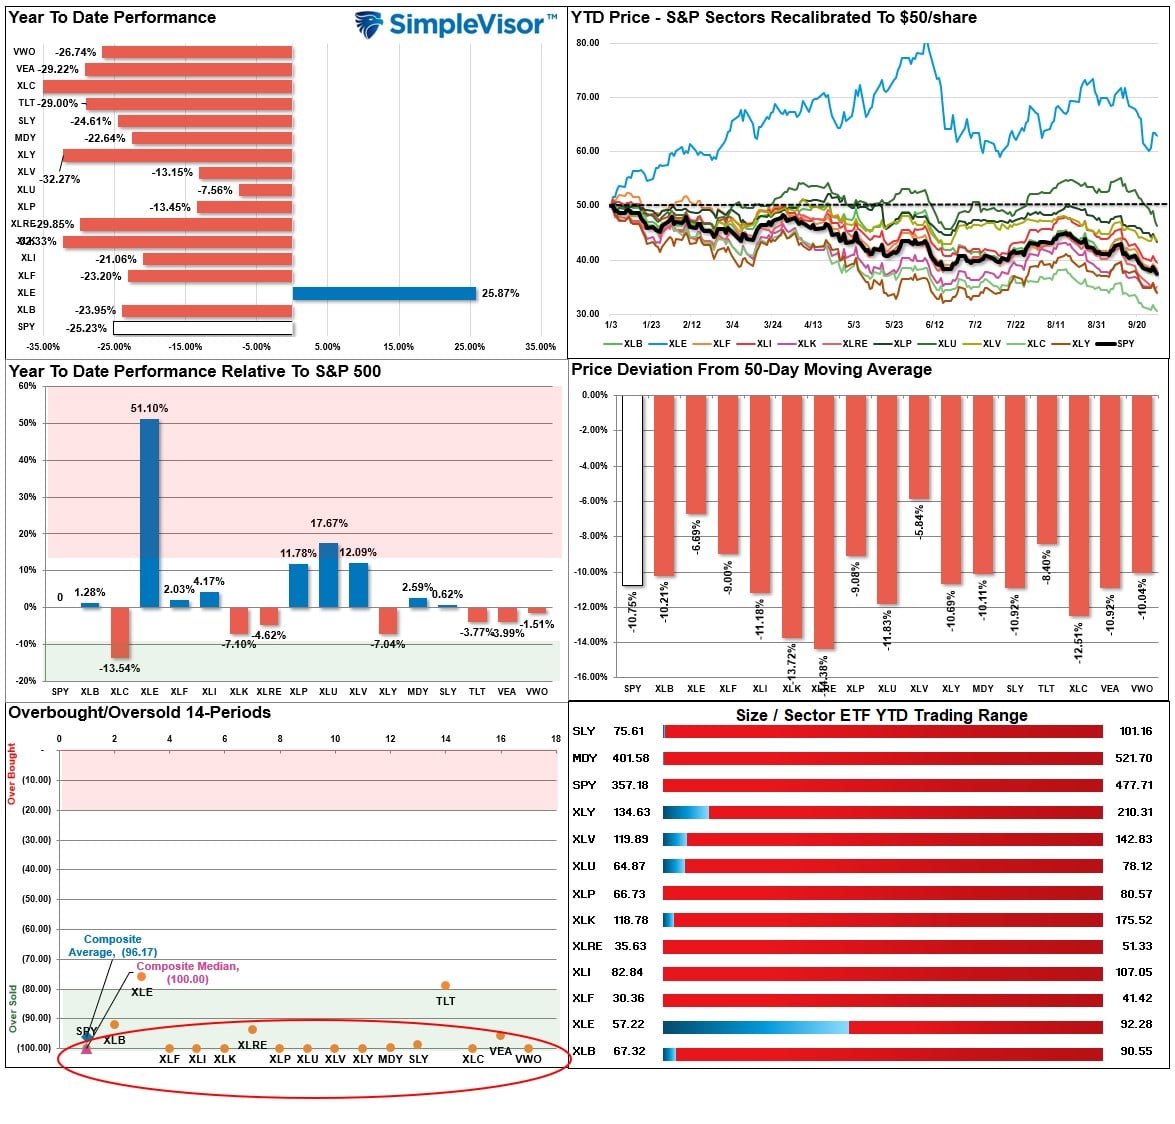
Relative Performance Analysis
Last week, we stated:
The Fed’s “no pivot” policy pushed assets further into oversold conditions. Historically, when every sector and market is oversold, counter-trend rallies are highly probable. Use that rally to sell into.
Unfortunately, with the end of the quarter Pension Fund rebalancing last week, the markets didn’t muster a rally as the selling pressure into the weekend caused a volatility spike. Again, this week, with every sector deviated well below respective moving averages and deeply oversold, a rally into October will be an excellent opportunity to rebalance risk.
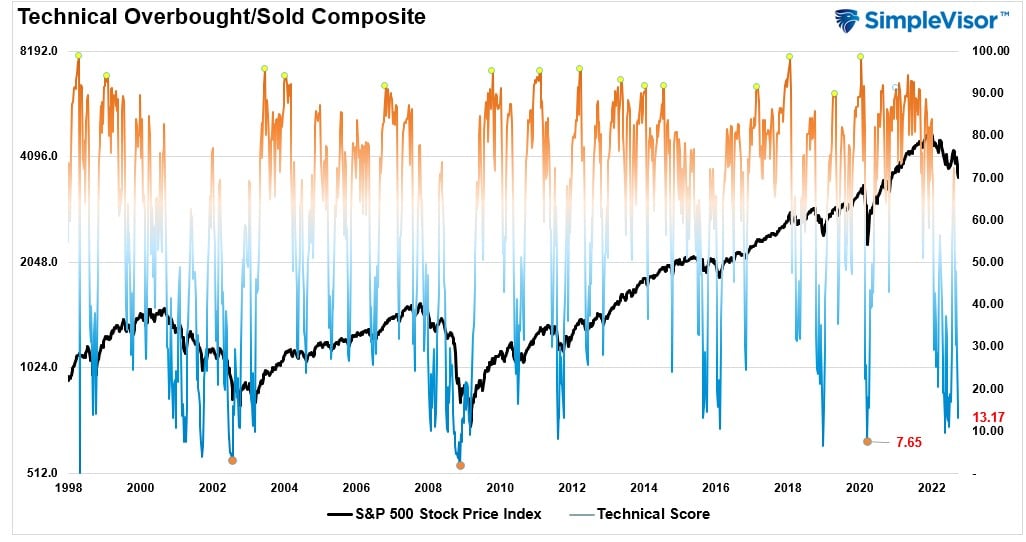
Technical Composite
The technical overbought/sold gauge comprises several price indicators (RSI, Williams %R, etc.), measured using “weekly” closing price data. Readings above “80” are considered overbought, and below “20” are oversold. Markets tend to peak when readings are at 80 or above, which suggests profit taking and risk management are prudent. The best buying opportunities exist when readings are 20 or below.
The current reading is 13.17 out of a possible 100 and rising. Remain long equities for now.
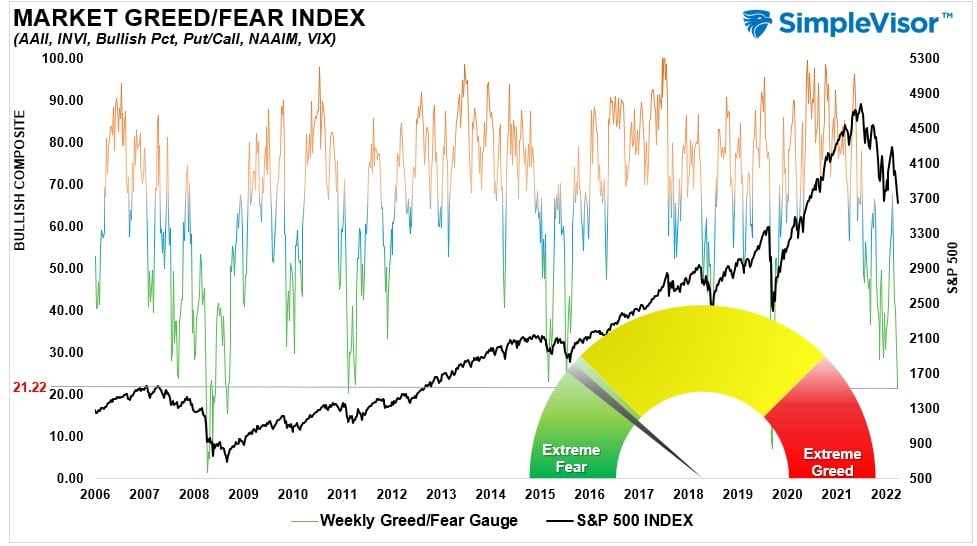
Portfolio Positioning “Fear / Greed” Gauge
The “Fear/Greed” gauge is how individual and professional investors are “positioning” themselves in the market based on their equity exposure. From a contrarian position, the higher the allocation to equities, to more likely the market is closer to a correction than not. The gauge uses weekly closing data.
NOTE: The Fear/Greed Index measures risk from 0 to 100. It is a rarity that it reaches levels above 90. The current reading is 21.22 out of a possible 100.
Sector Model Analysis & Risk Ranges
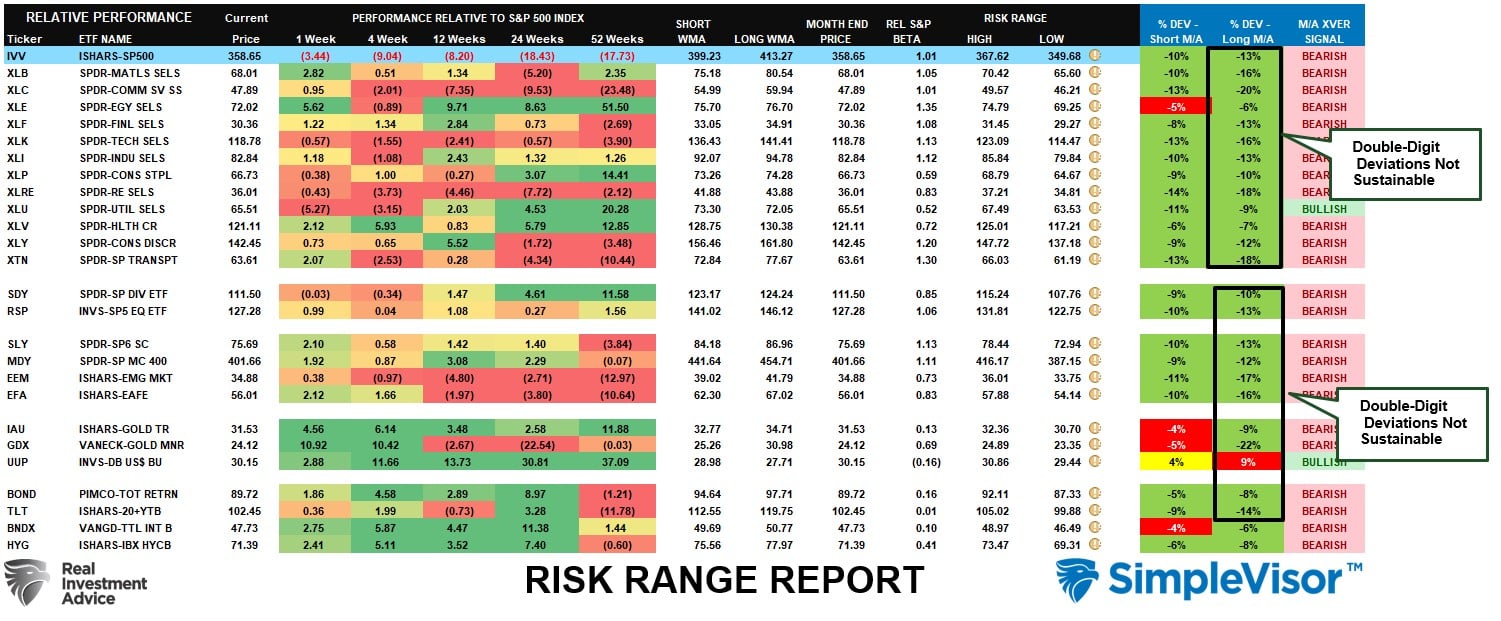
How To Read This Table
- The table compares the relative performance of each sector and market to the S&P 500 index.
- “M/A XVER” is determined by whether the short-term weekly moving average crosses positively or negatively with the long-term weekly moving average.
- The risk range is a function of the month-end closing price and the “beta” of the sector or market. (Ranges reset on the 1st of each month)
- The table shows the price deviation above and below the weekly moving averages.
The selling pressure continued this week, taking almost every sector and market into double-digit deviations below long-term weekly moving averages. Such extremes are not sustainable, and when all markets and sectors are this oversold, a reflexive rally becomes highly probable. Every sector, except Energy, is well below monthly ranges. The Dollar, on the contrary, remains exceptionally overbought. Selling the Dollar to buy Bonds is likely a good hedge trade going into year-end.
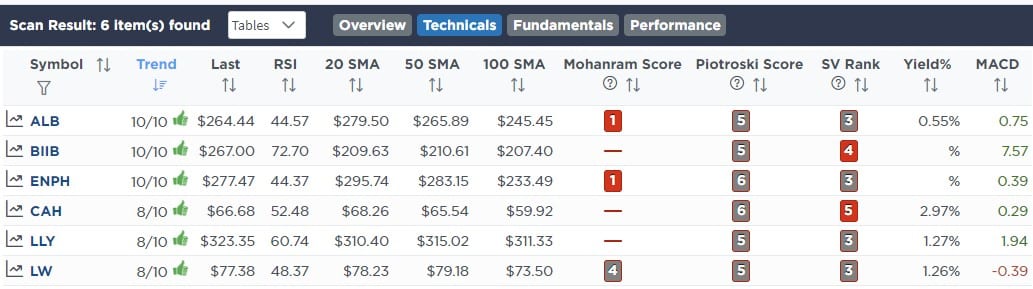
Weekly SimpleVisor Stock Screens
Each week we will provide three different stock screens generated from SimpleVisor: (RIAPro.net subscribers use your current credentials to log in.)
This week we are scanning for the Top 20:
- Relative Strength Stocks
- Momentum Stocks
- Highest Rated Stocks
These screens generate portfolio ideas and serve as the starting point for further research.
(Click Images To Enlarge)
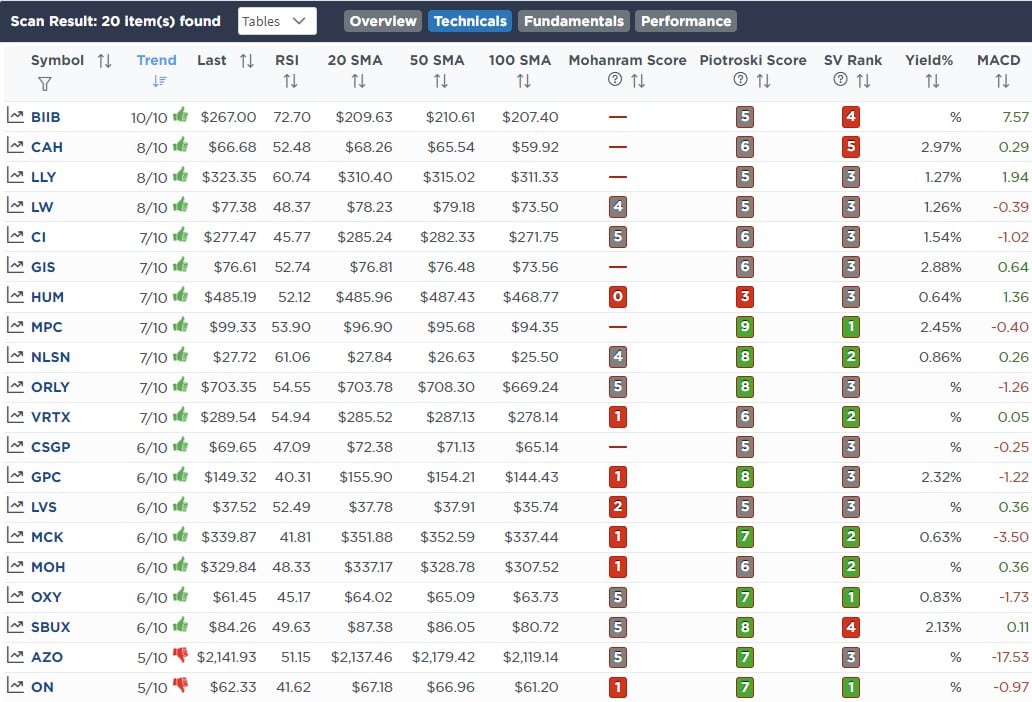
RSI Screen
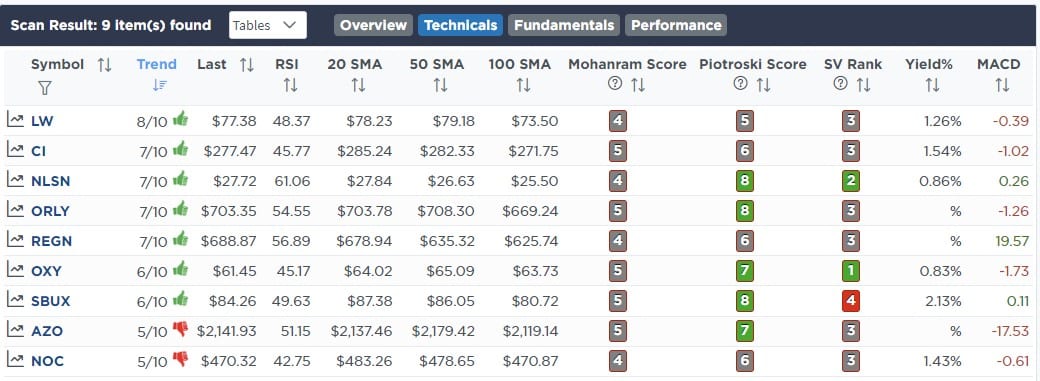
Momentum Screen
Highest Rated Screen
SimpleVisor Portfolio Changes
We post all of our portfolio changes as they occur at SimpleVisor:
- No Changes This Week

Lance Roberts, CIO
Have a great week!


