Inflation In Irrational Exuberance


In this issue of “Inflation In Irrational Exuberance.”
- Market Stalls Ahead Of Options Expiration
- Sentiment Is Showing Irrational Exuberance
- Inflation Is Surging
- Portfolio Positioning
- Sector & Market Analysis
- 401k Plan Manager
Follow Us On: Twitter, Facebook, Linked-In, Sound Cloud, Seeking Alpha
Is It Time To Get Help With Your Investing Strategy?
Whether it is complete financial, insurance, and estate planning, to a risk-managed portfolio management strategy to grow and protect your savings, whatever your needs are, we are here to help.
Schedule your “FREE” portfolio review today.

Market Stalls Ahead Of Options Expiration
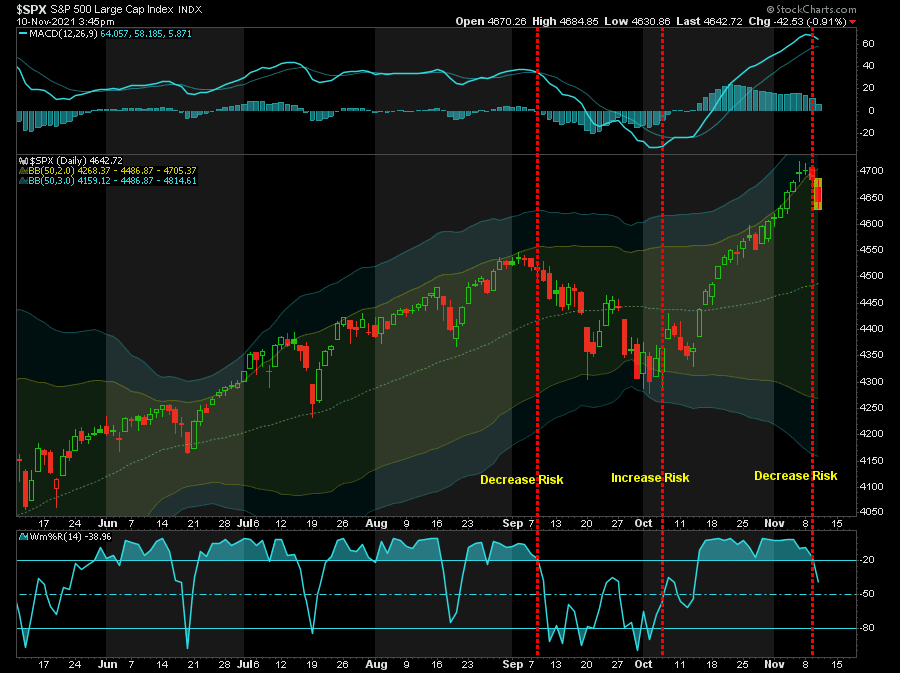
Unlike recent weeks, this past week saw the market begin to consolidate recent gains ahead of options expiration next Friday. However, as we discussed previously, pullbacks have occurred with regularity. Interestingly, as noted by the vertical lines in the chart below, these pullbacks occur near option expirations.
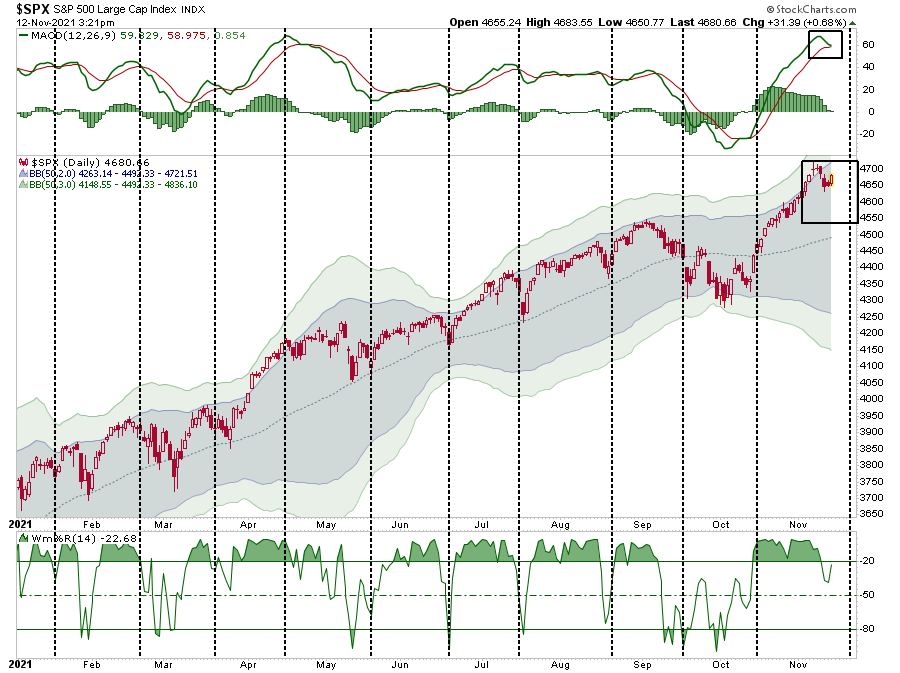
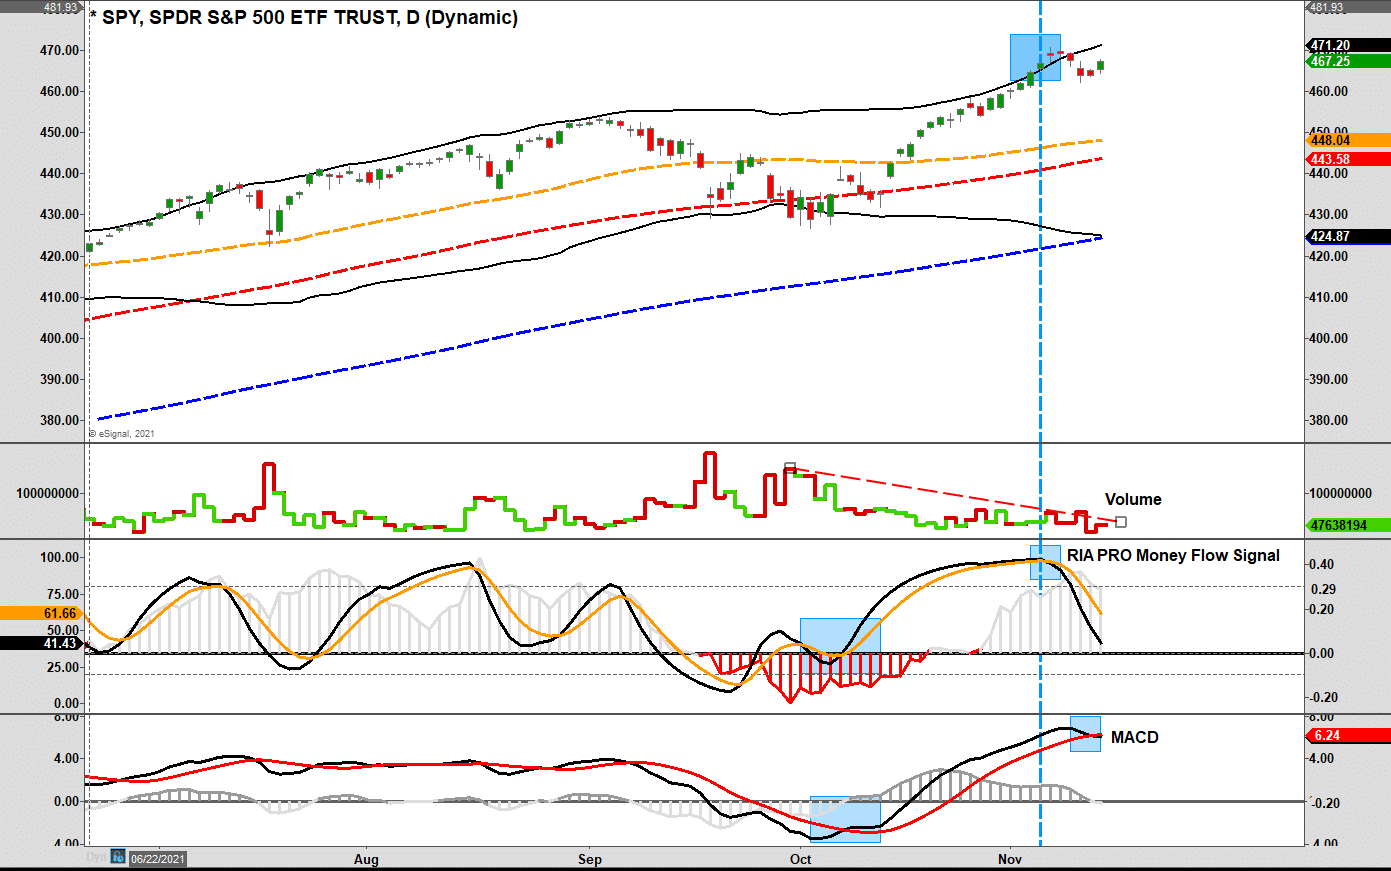
Given the options expire next week, is there more volatility coming? Maybe. As noted in the chart above, the MACD signal is very close to triggering a short-term “sell” signal from an elevated level, and the market remains very overbought.
Furthermore, as noted last week, our “money flow sell signal” triggered a “sell signal.” The combination of the sell signals, very light volume, and weak breadth certainly warrants some caution heading into next week.
Does this mean the market will experience a significant contraction? A pullback to the short-term moving averages would not be surprising and would encompass about a 3-4% drawdown.
What would cause such a correction? I don’t know. However, we are entering the mutual fund distribution season where fund managers need to distribute capital gains, dividends, and interest. Given that most funds are carrying very low cash levels, they will likely have to sell holdings to make those distributions.
However, the good news is that a pullback would set the market up for the traditional end-of-year “Santa Claus” rally.
But at the moment, a correction is the furthest thing from investors’ minds. So while price inflation may be a problem, there is inflation in “irrational exuberance” as of late.

Inflation In Irrational Exuberance
In our recent Daily Commentary (click the banner above for FREE pre-market email delivery), we touched on signs of inflation in “irrational exuberance.” To wit:
“The S&P 500 “buying” stampede continues, pushing stock market valuations to extremes. As of Friday, the Shiller PE valuation rose above 40. Current valuations now dwarf that seen in 1929 and only bettered by the latter months of 1999.“
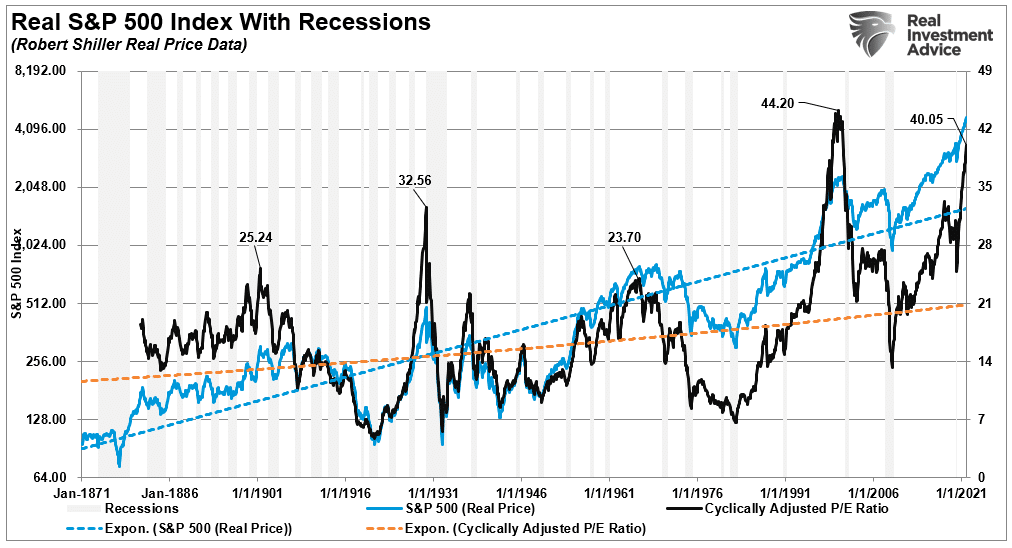
Of course, “valuations are a terrible market timing device,” but they tell you much about investor psychology and future returns. However, there are other measures also supporting inflation in irrational exuberance.
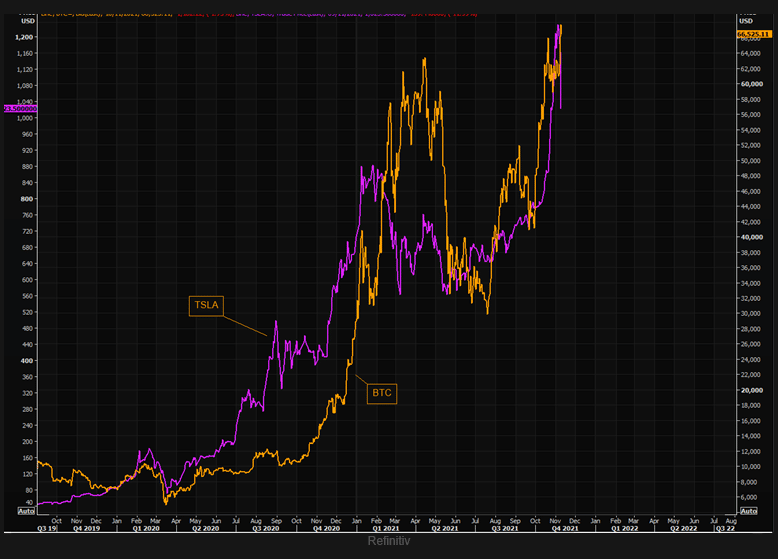
For example, the chart from TheMarketEar shows the price of Bitcoin to Tesla shares. In recent weeks, the surge in both is a good proxy of the inflation of irrational exuberance and a disregard for risk.
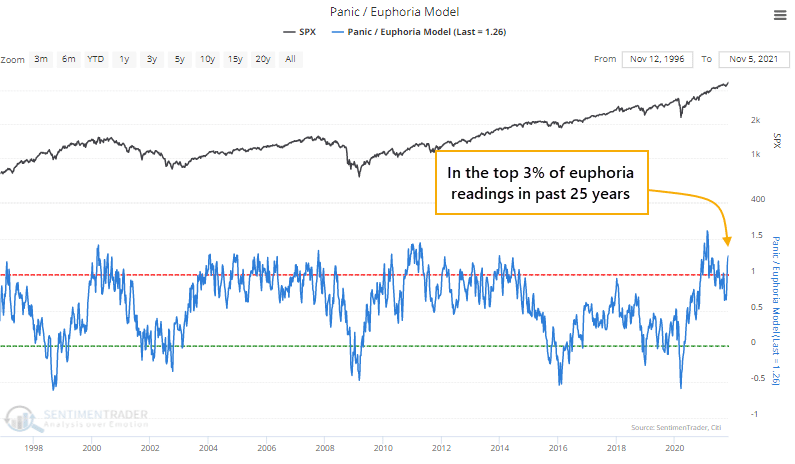
Furthermore, as retail investors pile into equity risk, Sentiment Trader also put out two gauges on Wednesday showing similar measures of inflation in irrational exuberance reaching problematic levels.
The Panic/Euphoria Model, constructed using a methodology described by Citigroup in public posts, has rebounded and is once again above its ‘euphoria’ threshold.
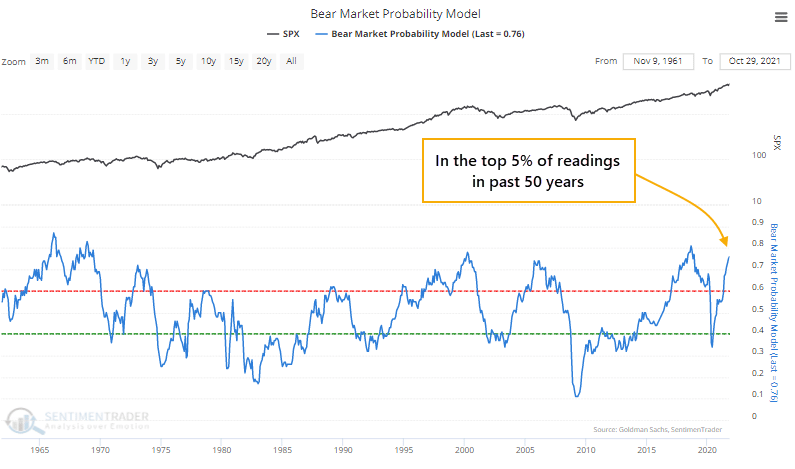
“And the Bear Market Probability Model, described in interviews by Goldman Sachs, has soared to one of the highest levels in 50 years.“
As they conclude, and with which we agree:
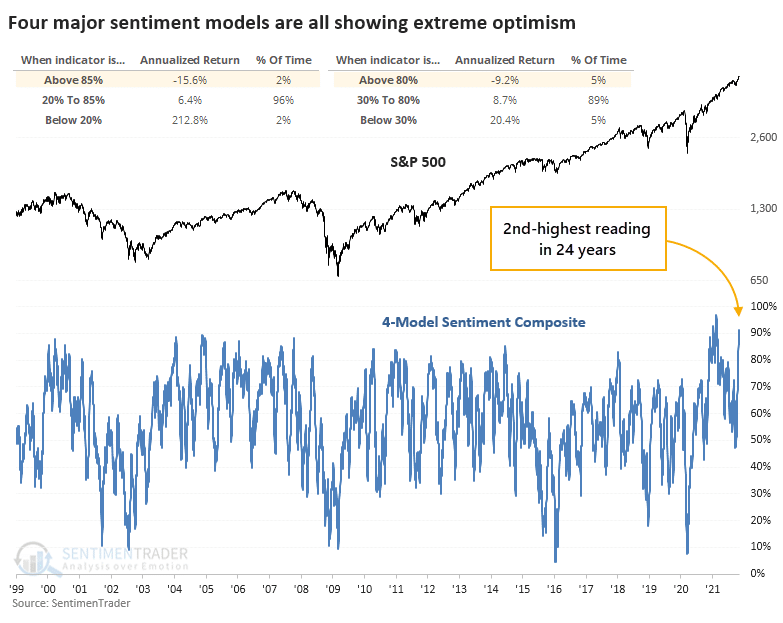
“Choppiness among stocks within indexes pushed the composite model below 50% in late September. Now, enthusiasm is back, and the model is above 90%, challenging the highest readings in 23 years. The chart shows us that the S&P 500’s annualized return when the composite model was above 80% was a miserly -9.2%. When the model was above 85%, accounting for about 2% of all days since 1998, that return was a horrid -15.6%.”
Such is why being a bit more defensive near-term may be well advised.
What Driving & Portfolio Management Have In Common
Our newer readers require a bit of a chronology.
In mid-August, we discussed a similar situation where markets got very elevated, and we needed to reduce risk in our portfolios.
Then, in late September, following a 5% decline in the market that reduced the momentum chase, we added exposure. To wit:
“With the markets now deeply oversold on a short-term basis, we deployed some of our cash throughout the week to rebalance the portfolio toward normal allocation levels. We don’t expect a tremendous amount of upside, given the ongoing weakness of market internals, but a retest of previous highs is not out of the question.”
Importantly, notice that we state “decrease” and “increase.” Such does not mean being “all-in” or “all-out.”
Portfolio and risk management is a process of making small moves and adjusting for changes in the market as they come. It is much like driving a car. Therefore, when the vehicle is moving, you are constantly making minor adjustments to keep the vehicle in the proper lane, accelerating or decelerating as needed, and paying attention to the constant flow of signals from all around you.
Most of this we do subconsciously, but the actions all ensure two things:
- A reduction of risk
- Getting to our destination safely.
Primarily, investing has many of the same characteristics. Paying attention to the warning signs, adjusting the “speed” of the portfolio, and keeping the allocation in the “proper lane“ can ensure safe arrival at your destination.
Not doing so can have very damaging consequences.
We are driving a little slower, having our foot over the brake, and adding a bit of “liability insurance” to our portfolio as warnings rise.
One of those warnings is the Fed’s choice to ignore inflation.
In Case You Missed It

Inflation Is Surging
On Wednesday, the latest print of the consumer price index came in much hotter than expected. The chart below shows 3-measures of inflation:
- CPI
- Core-CPI (Less food and energy,) and
- Variable-CPI (Less healthcare and rent.)
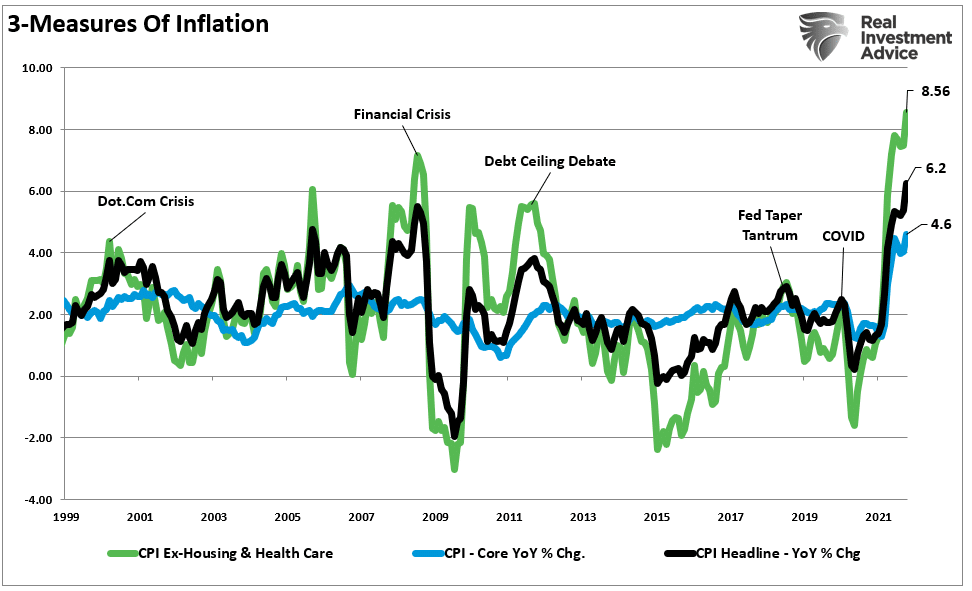
The surge in inflationary pressures is evident, with “Core CPI” surging to 6.2% on an annualized basis. However, for most Americans, their food and energy consumption is something they deal with every week. Therefore, the impact on discretionary incomes is far more insidious when those get included.
As my colleague Doug Kass noted:
“My eyeballs tell me inflation is running a fair bit hotter than what is being reported now. I think the average person would also think that based on their buying experiences today.”
Furthermore, most individuals have their rent or mortgage payments under a contractual agreement for a certain period. The same goes for healthcare costs as premiums stay stable under a contractual term. The “Variable CPI” shows what inflation looks like from a consumer’s point of view. At 8.5%, it is not surprising consumers are getting upset.
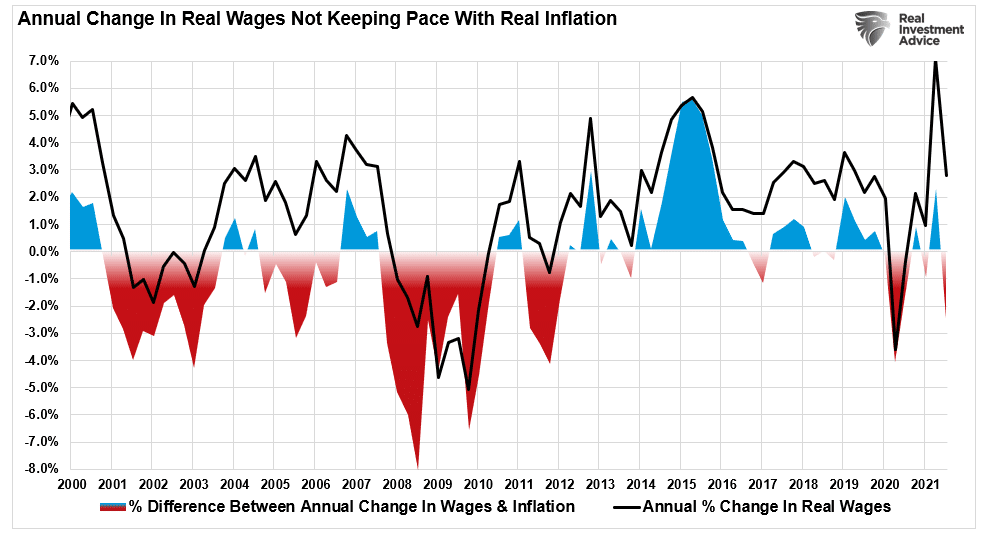
Consequently, the surge in variable CPI is even more problematic when wages fail to keep up with inflationary pressures. Therefore, despite headlines of rising wage pressures, real wages are currently 2% below the annual pace of inflation. So, again, the implications on economic growth, and the market, are not tremendous.

The Fed Has To Be Sweating
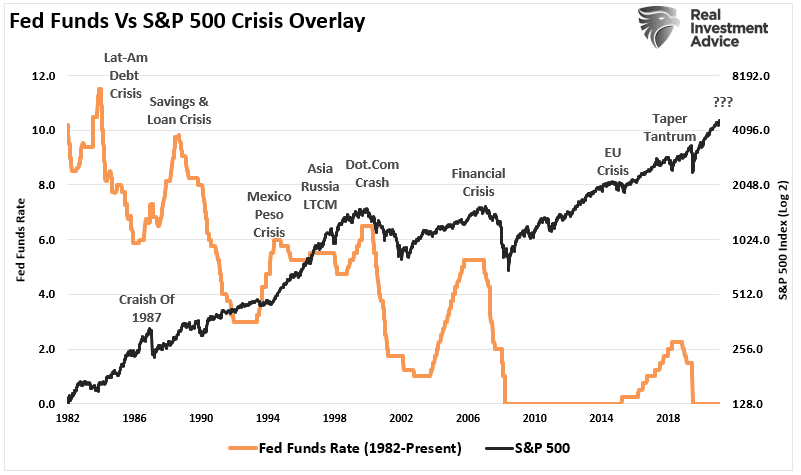
As discussed in “Did The Fed Set The Market Up For A Crash,” the choice of ignoring inflation in hopes of getting back to historically low unemployment rates may be problematic.
“Ignoring the inflation risk is likely unwise. Previous spikes in the inflation spread aligned with weaker economic growth, stock market contractions, or crashes.“
When it comes to ‘full” employment, Michael Lebowitz ran some analysis suggesting the Fed may be overly confident in its abilities to support economic growth.
“The U6 Unemployment Rate is not as well followed as the U3 shown above. U6 includes those unemployed in the U3 number but also those underemployed and discouraged from seeking jobs. Jerome Powell thinks the U6 figure is a more credible indicator given the pandemic-related dislocations. As shown below, the U6 rate is 0.4% below the average of the five years leading to the pandemic.”

As Michael concludes, the Fed has already met its mandate of full employment. However, they are ignoring inflation to support asset valuations that the Fed recently admitted were excessive.
“Prices of risky assets keep rising, making them more susceptible to perilous crashes if the economy takes a turn for the worse. Asset prices remain vulnerable to significant declines should investor risk sentiment deteriorate, progress on containing the virus disappoint, or the economic recovery stalls.” – Bloomberg
Ignoring the surging rates of inflation to support asset prices may result in a “policy mistake” that leads to the one outcome the Fed is trying to avoid – a stock market crash.
Of course, such would not be the first time the Fed’s hubris exceeded their grasp and led to unwanted outcomes.
It is likely to be no different this time.
However, I am sure the Fed is starting to sweat.

Portfolio Update
Given the inflation in “irrational exuberance” in the short term, we have been taking profits and rebalancing portfolio risk over the last two weeks. As we noted previously:
“We took profits; we did not sell the entirety of our position. Therefore, our portfolio allocations are near fully invested. However, our cash position is growing as the market becomes more aggressively extended.”
Significantly, not only did we reduce our exposure in some of the more grossly extended holdings such as NVDA, AMD, and F, but also TLT (bonds).
Over recent weeks, after increasing the duration of our fixed-income allocation, TLT also became overbought and triggered a short-term money flow sell signal. The current inflation print pushed bond prices lower, yields higher, for now. I suspect that we will get an opportunity to increase our TLT holdings at lower prices within the next few weeks.
With slightly increased cash levels, we are watching the current “sell signals” develop as we head into “options expiration” next week. Since March, retests of the 20- and 50-day moving averages were triggered by the rollover of options. Considering there is a record number of call options, we could see a volatility spike during expiration. As such, we did add a small volatility hedge to our portfolio should such an event occur.
In the meantime, we remain a bit more bullishly biased than we like. However, sometimes, being “uncomfortable” is just part of the investment process.
Have a great weekend.
By Lance Roberts, CIO


