Stock Market Rollercoaster Nauseates Investors


In this 05-06-22 issue of “Stock Market Rollercoaster Nauseates Investors.”
- Stock Market Rollercoaster
- What Happens After The Worst 4-Month Start In 50-Years
- Portfolio Positioning
- Sector & Market Analysis
Follow Us On: Twitter, Facebook, Linked-In, Sound Cloud, Seeking Alpha
Need Help With Your Investing Strategy?
Are you looking for complete financial, insurance, and estate planning? Need a risk-managed portfolio management strategy to grow and protect your savings? Whatever your needs are, we are here to help.
Schedule your “FREE” portfolio review today.

Weekly Market Recap With Adam Taggart
Stock Market Rollercoaster
I can almost repeat last week’s opening note:
“Another tough week, and month, for the market. Ongoing concerns about inflation, earnings, and economic growth, continue to pressure stocks. As noted last week, there is a tremendous amount of damage in the market below the surface of the index. Nonetheless, indexes certainly got beat up last week.”
This week, such was the case despite the Federal Reserve holding the line on 0.50% rate hikes and a slower approach to tapering. Despite the Fed meeting expectations and eliminating 0.75% hikes this year, the market ended about where it began. More on this in a moment.
It was quite a stock market rollercoaster with a massive surge on Wednesday, followed by an equally significant plunge on Thursday. Volatility is both gut-wrenching and exceptionally hard to manage.
The market continues to hold support at the March lows and remains oversold on many levels. Sentiment also remains exceptionally negative, which will provide fuel for a reflexive rally when one occurs.
Notably, this is where investors tend to make the most mistakes. Everything, everywhere, is bearish. CNBC is running “Markets In Turmoil” specials, and individuals get convinced the world is ending. However, as Howard Marks once stated:
“In good times skepticism means recognizing the things that are too good to be true; that’s something everyone knows. But in bad times, it requires sensing when things are too bad to be true. People have a hard time doing that.
The things that terrify other people will probably terrify you too, but to be successful an investor has to be stalwart. After all, most of the time the world doesn’t end, and if you invest when everyone else thinks it will, you’re apt to get some bargains.“
But that is very hard to do.
Regaining Perspective
Last year, I wrote that it had been so long since we had a 10% correction that it would FEEL much worse than when it eventually came. This year, such has undoubtedly been the case with investors panicking and dumping stocks like ETSY en masse. However, as Sam Ro noted for Yahoo Finance yesterday, this is a fairly average year. To wit:
“It’s been an incredibly unpleasant year for stock market investors.
After setting a record closing high of 4,796 on January 3, the S&P 500 tumbled 13% to 4,170 on March 8. It then rallied to 4,631 on March 29, but then fell again hitting a closing low of 4,146 on Thursday, reflecting a max drawdown (i.e. the biggest intra-year sell-off) of 14%.
However, this year’s moves are nothing out of the ordinary. Since 1950, the S&P has seen an average annual max drawdown of 14%.”
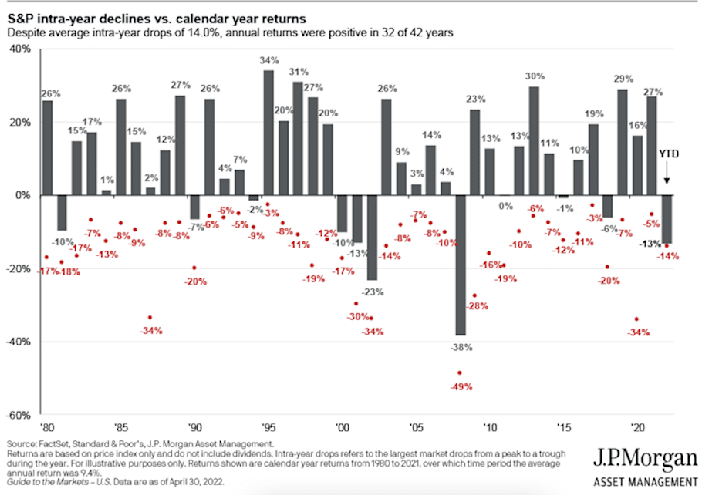
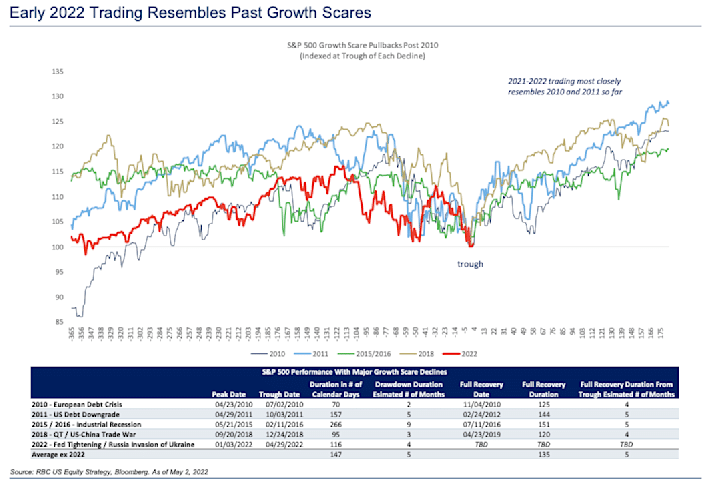
He quoted RBC Capital Markets on how markets reacted during four recent growth scares. RBC noted that the six-month returns ranged from 18.2% and 28.6% following market troughs. The 12-month returns ranged from 26.6% to 32.0%.
While it is easy to find a lot of reasons to be bearish, these data points help retain perspective and combat confirmation bias.
However, for now, the stock market rollercoaster continues.

What The Fed Said
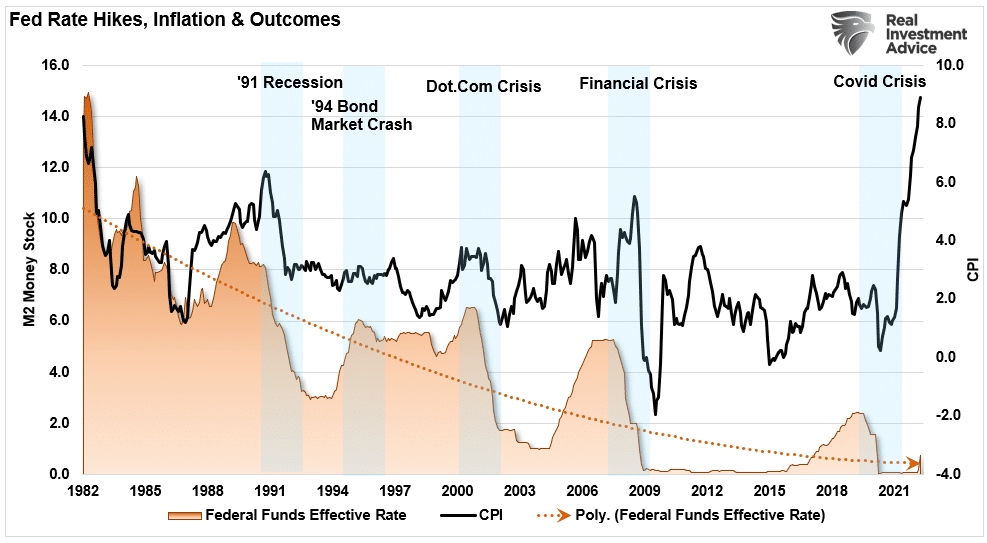
On Wednesday, the market surged 3% in a massive short-covering rally following the latest FOMC announcement. Both the rally and the deep selloff on Thursday came in the wake of the Federal Reserve’s first half-point rate hike since 2000. The central bank took its first notable step to address inflation at the highest level in 40 years. The chart below shows the historical Fed funds rate as compared to CPI.
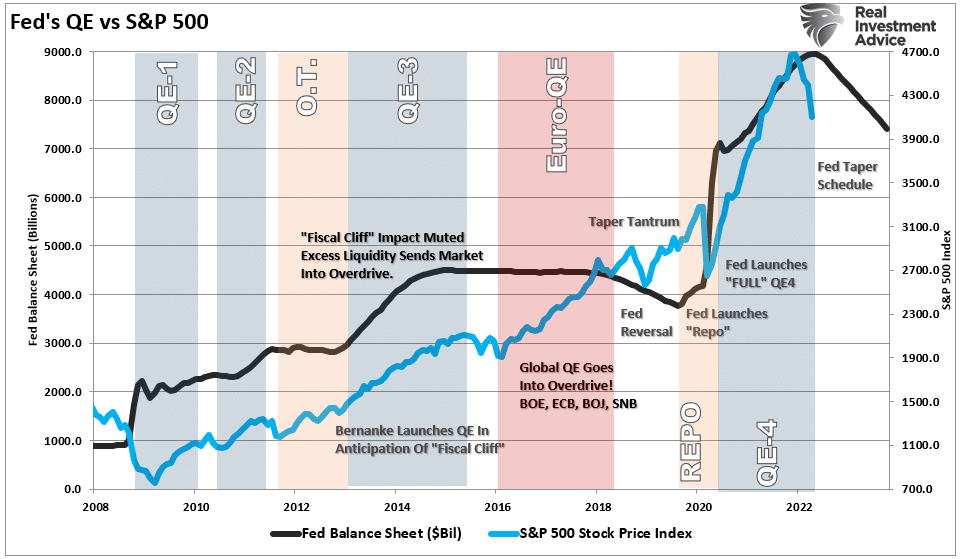
Notably, the Fed also laid out its plan to reduce the size of its enormous balance sheet. Starting June 1st, the Fed will allow $47 billion in assets to mature without replacing them, which will rise to a cap of $95 billion in 3-months. The chart below lays out the planned path of the taper. (I show the taper only through the end of 2023, assuming the Fed gets that far.)
Notably, during his press conference Wednesday, Fed Chair Jerome Powell stated the central bank was not considering any 0.75% rate hikes in the near term. The market rallied sharply following those comments on relief that Fed would not be more aggressive. But, importantly, the Fed did commit to additional 50 basis point increases at the next two meetings.
As noted, stocks reversed the previous day’s massive gains with an enormous sell-off as realization sank in that the Fed is indeed “removing the punch bowl” from investors at a very late stage of “the party.”
Not surprisingly, this year’s stock market rollercoaster generated an extreme level of negative sentiment. But is this the time to immediately begin dumping stocks and running into cash? That is the question we will explore further this week.
This Week’s MacroView

Worst 4-Month Performance In The Past 50-Years
Our colleague at SimpleVisor.com, Jeffrey Marcus of TPA Analytics, put out a great piece of research. To wit:
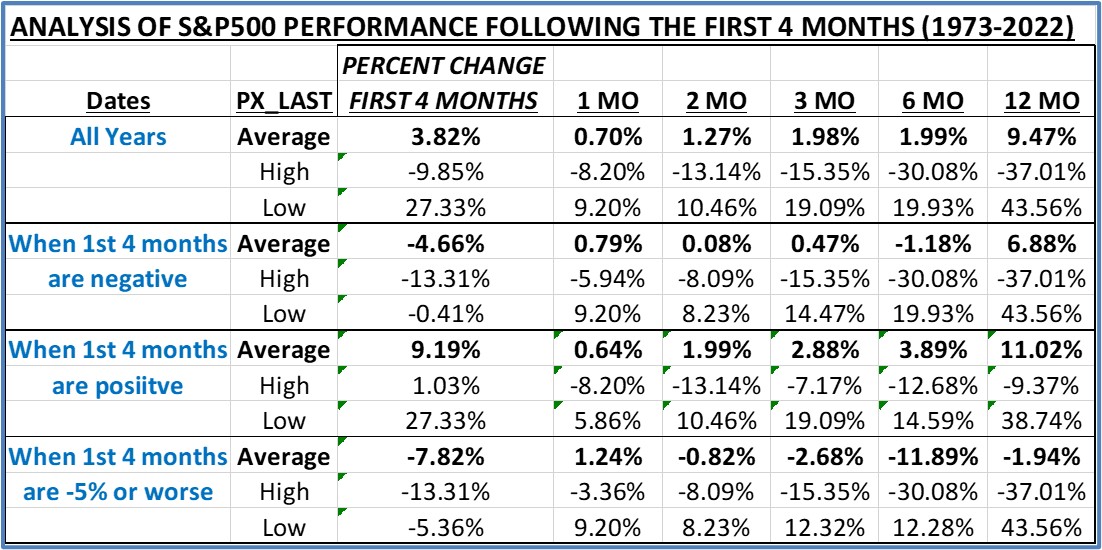
“The S&P 500 fell 13.31% in the first 4 months of 2022. That is the largest drop for the first 4 months of a year in the past 50 years. The table below shows 8 years in which the S&P 500 fell 5% or more January 1 to April 30.
(The table details the year’s performance from 1973 to 2022.)
As Jeff goes on to note:
“So, is it time to throw in the towel and step to the sidelines? Maybe, but on closer examination maybe not.
The conditions in 1974, 1977, and 1990 may be closer parallels today as they are concerned with inflation, oil shocks, and subsequent FED actions. The question is whether the current situation is the result of general economic conditions or the exogenous events of Russia/Ukraine and Covid? Is inflation the result of an overheated economy out of control or shortages and logistical issues caused by Covid and Russia’s invasion of Ukraine?
These are valid questions to ask since performance after Covid was better than the average for all 50 years: 1-month 4.53%, 2-month 6.45%, 3-month 12.32%, 6-month 12.28%, and 12-month 43.56%.”
We agree. As discussed last week, sentiment is extremely bearish.
“The percentage of bullish investors is currently 16% and close to a record low, leaving the bull/bear spread at -43%, a level surpassed only twice in the past 35 years. Tom Lee of Fundstrat shows that the returns following such sentiment lows tend to be good.”

While none of this means markets must rally, the statistical odds of a reflexive rally remain elevated. The technical data also suggests the recent plunge of the stock market rollercoaster might be nearing its bottom.
Where Is The Bottom?
When we talk about a reflexive rally, people automatically assume we are suggesting the “next great bull market is beginning.”
That is not the case.
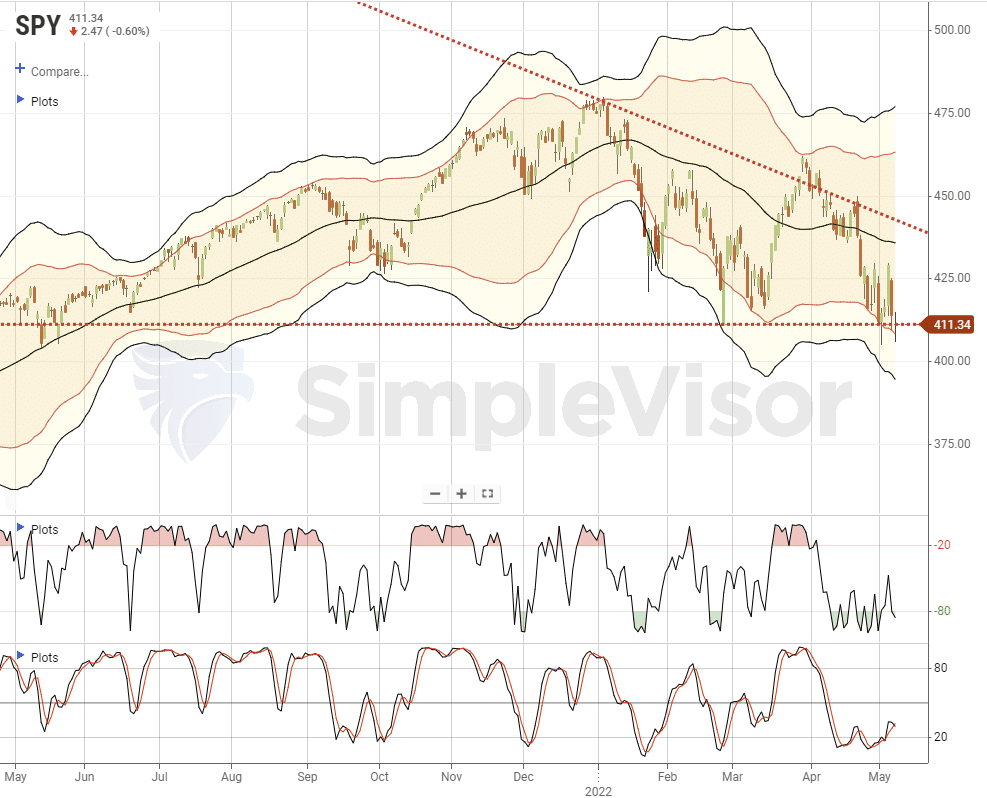
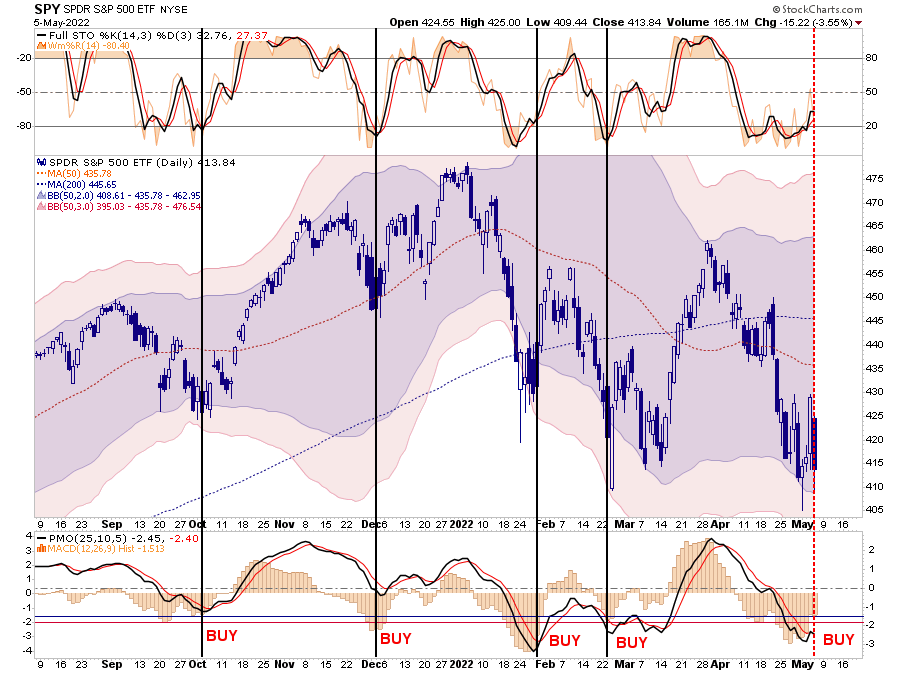
The chart below gives us an excellent example of what I am discussing. These oversold conditions are conducive for fairly sharp reflexive rallies. However, during a “bear market,“ those reflexive rallies consistently fail. Such is what we should continue to expect until the Fed ends its monetary tightening process and inflation cools.
Investors should use these reflexive rallies to reduce equity risk, raise cash and rebalance portfolios to protect capital until the current revaluation process completes.
The question is when that process completes. If we look at a longer-term monthly chart, we can guess at levels where the selling will likely get exhausted.
The monthly chart shows the S&P 500 index compared to its relative strength index (RSI). Each time the RSI was above 70, such coincided with more important market peaks. Notably, the difference between a “correction” and a “bear market” was whether the decline in the RSI ended at the mid-point (50) level or declined to lower levels.
If we assume we are in a “correction,” a retracement to the 36-month moving average is likely. Such would entail a 24% decline from the peak but would NOT violate the long-running bullish trend. However, if RSI declines to lower levels, such would likely entail a 50% Fibonacci retracement or a 44% decline from the peak. Or rather, a real “bear market.”

The RSI index must hold support at the 50-level. A failure to do so would require a much more cautionary stance in portfolios.
However, we don’t know which outcome it will be, so we continue to manage portfolio risk accordingly.

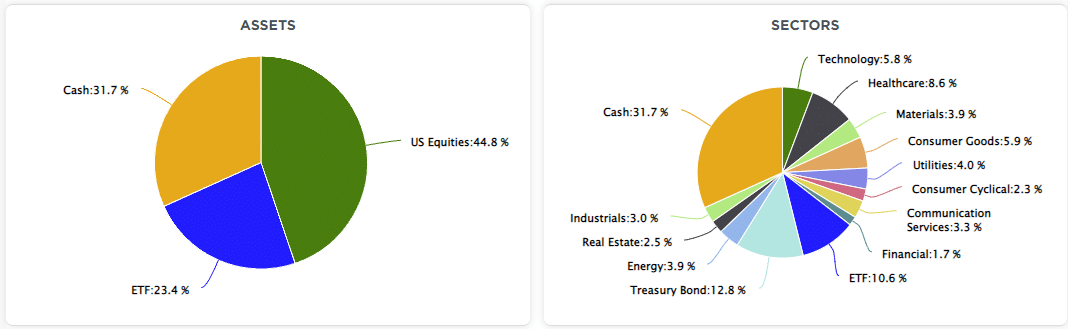
Portfolio Update
This particular stock market rollercoaster means combatting the emotional need to “flee” uncomfortable situations remains essential. This past week, we made some minor additions to the portfolio in areas on the value/defensive side of the market. After reducing our technology and growth names a couple of weeks ago, we used the recent sell-off to bottom fish in companies with solid balance sheets and dividends.
We continue to keep our reduced equity exposure at lower levels. With the market deeply oversold, and Thursday’s sharp sell-off, we continue to look for a tradeable rally to reduce risk further. Such should put us in an excellent position to navigate potentially weaker markets during the summer as the economy weakens.
Let me repeat from last week that we continue to expect the next few weeks, and even the next couple of months, to remain frustrating. This past week was no exception.
Critically, it remains important not to overreact to that volatility and wrongly position portfolios due to an emotional reaction. More often than not, such actions turn out to be far more harmful than the market itself.
As Ray Dalio once quipped:
“The biggest mistake investors make is to believe that what happened in the recent past is likely to persist. They assume that something that was a good investment in the recent past is still a good investment. Typically, high past returns simply imply that an asset has become more expensive and is a poorer, not better, investment.”
That notion also works in reverse. Investors tend to extrapolate negative actions in the market to persist indefinitely.
It won’t.
When it changes, it will be essential to recognize that change and act accordingly.
Have a great week.
Market & Sector Analysis
S&P 500 Tear Sheet
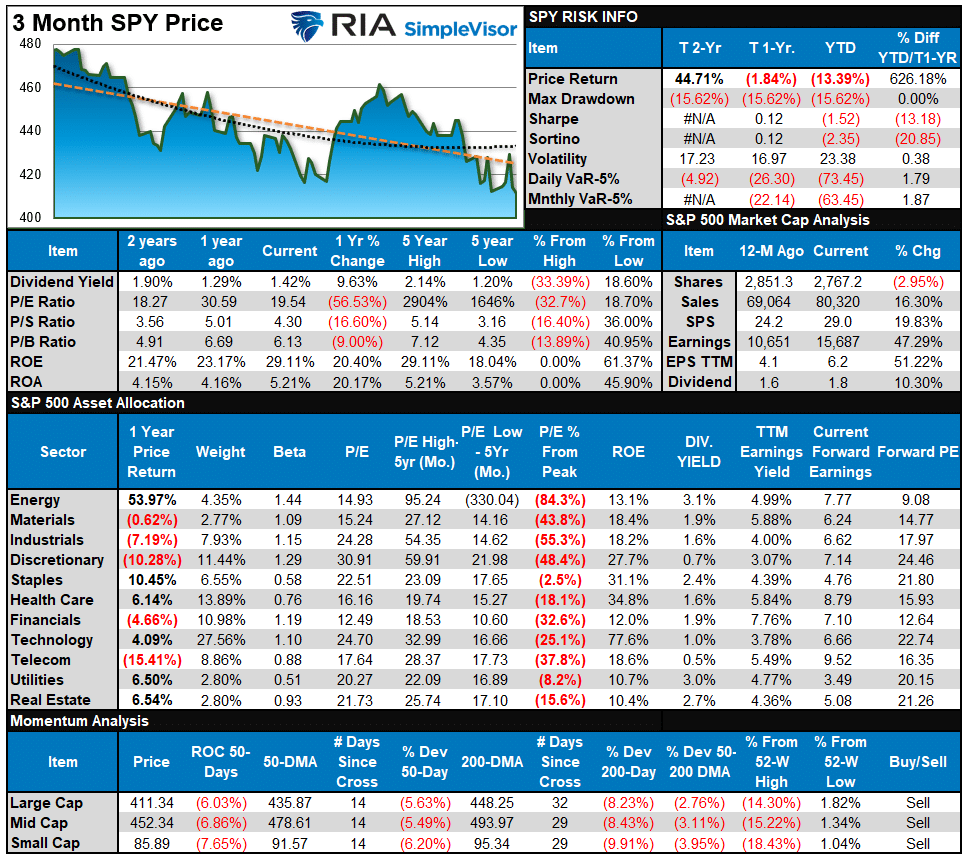
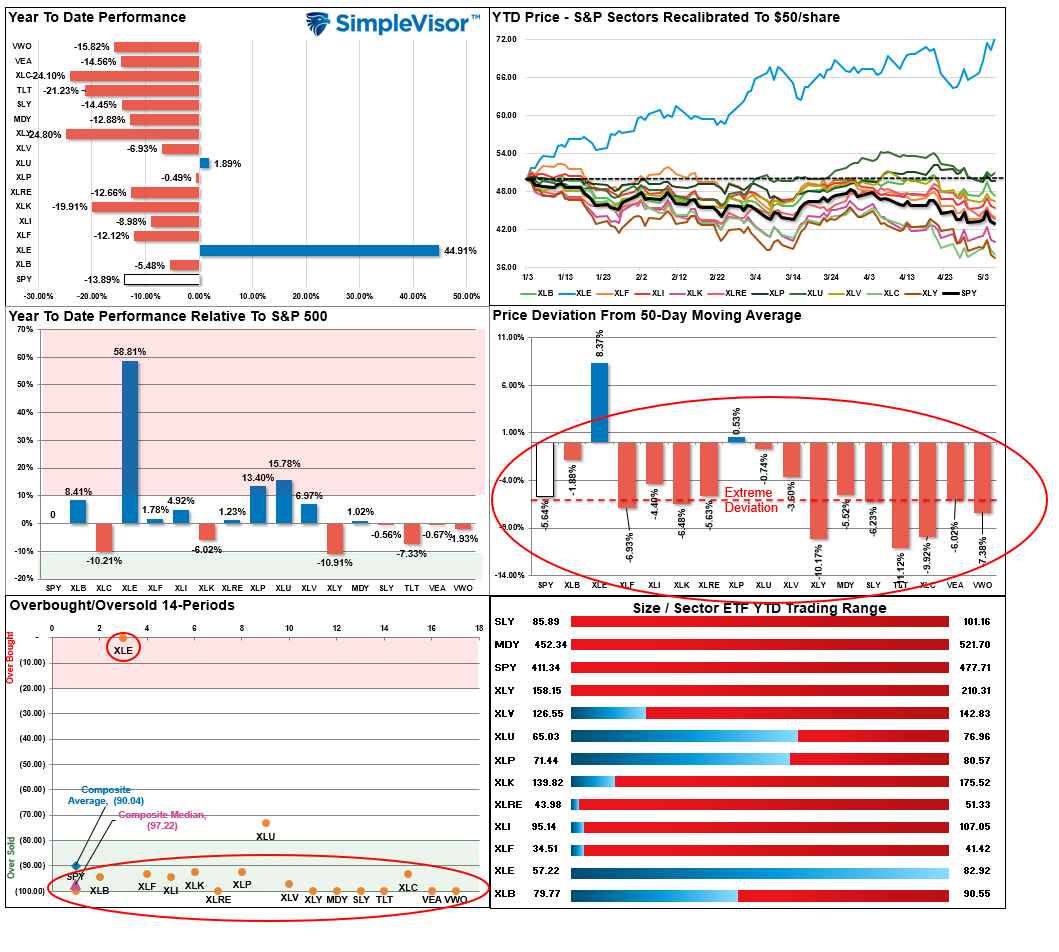
Relative Performance Analysis
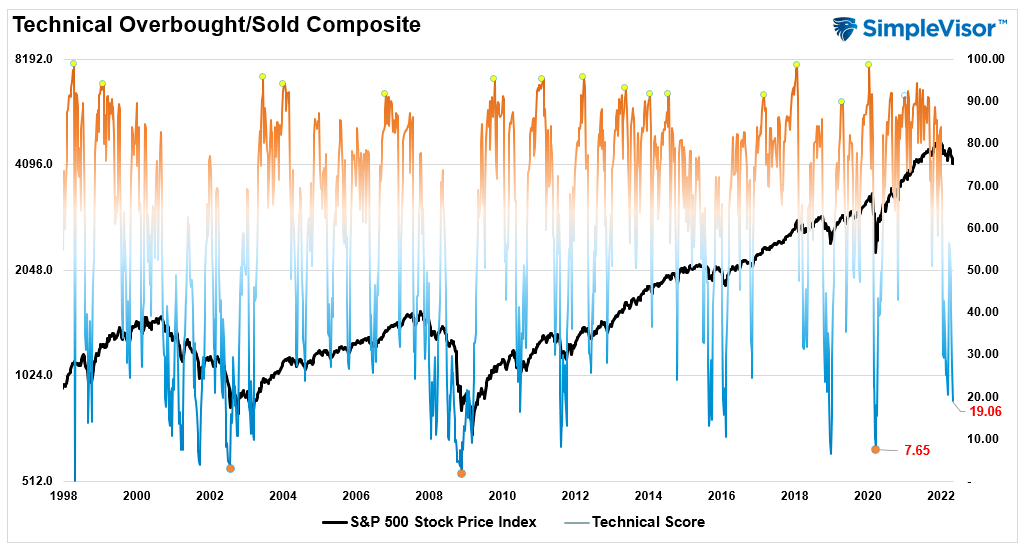
Technical Composite
The technical overbought/sold gauge comprises several price indicators (RSI, Williams %R, etc.), measured using “weekly” closing price data. Readings above “80” are considered overbought, and below “20” are oversold. The current reading is 19.06 out of a possible 100.
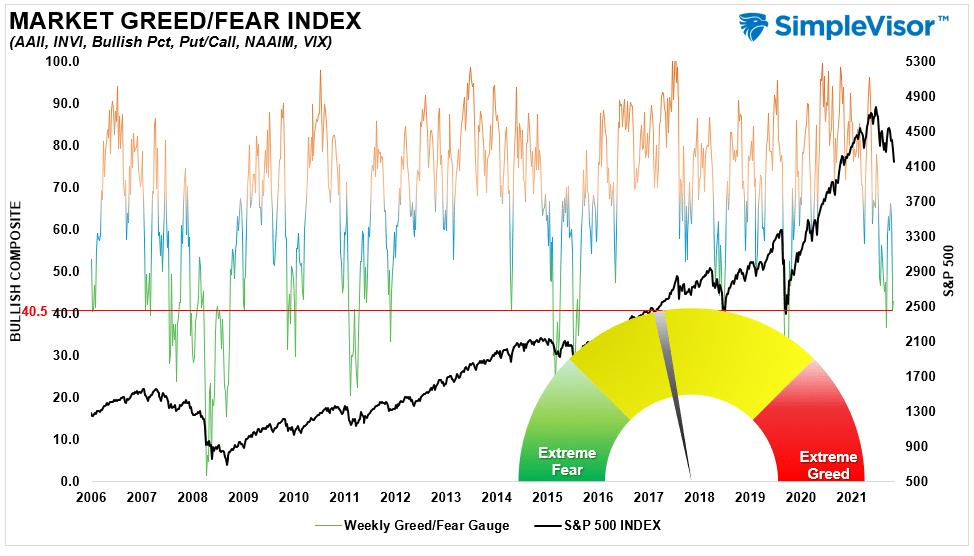
Portfolio Positioning “Fear / Greed” Gauge
The “Fear/Greed” gauge is how individual and professional investors are “positioning” themselves in the market based on their equity exposure. From a contrarian position, the higher the allocation to equities, to more likely the market is closer to a correction than not. The gauge uses weekly closing data.
NOTE: The Fear/Greed Index measures risk from 0 to 100. It is a rarity that it reaches levels above 90. The current reading is 40.5 out of a possible 100.
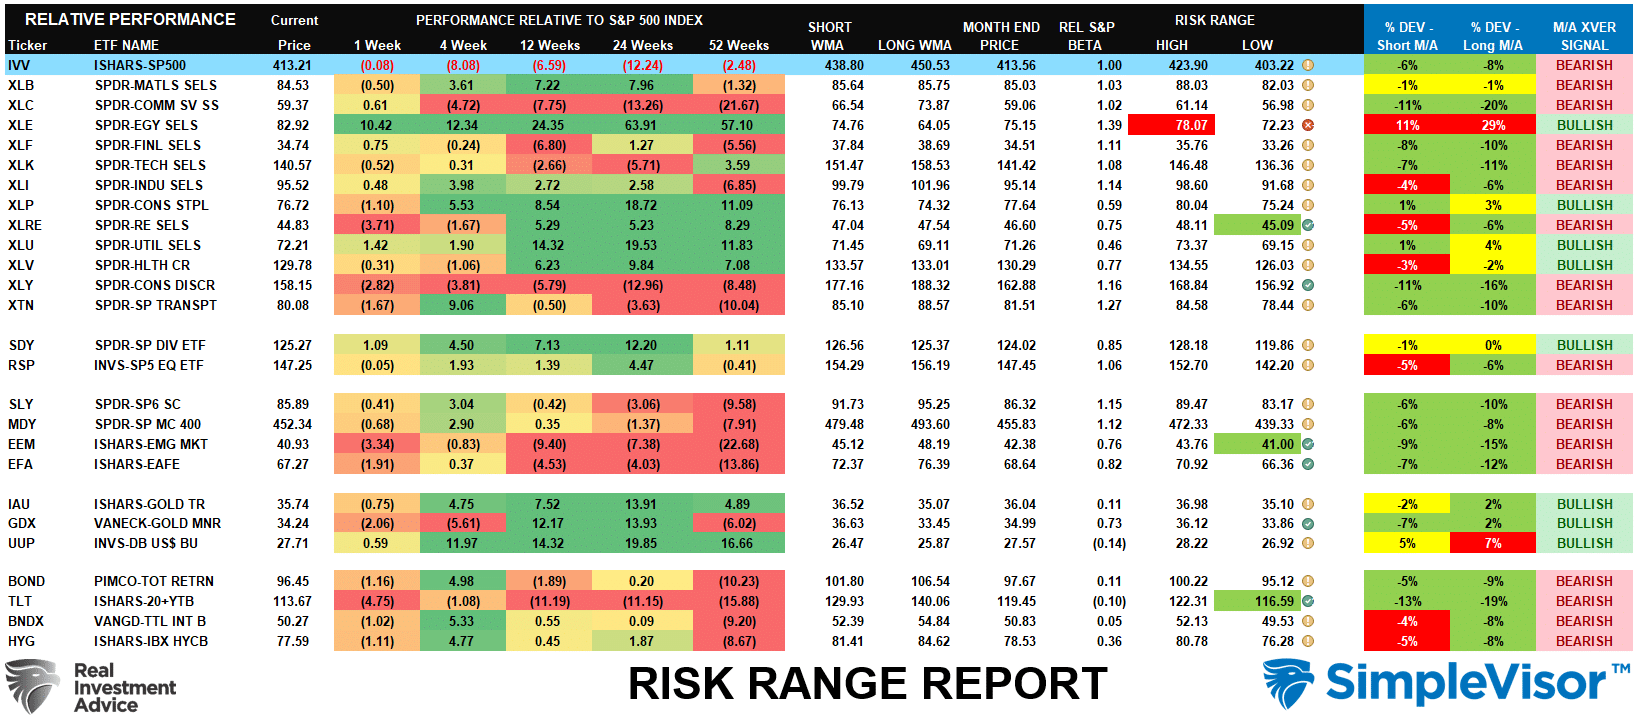
Sector Model Analysis & Risk Ranges
How To Read This Table
- The table compares the relative performance of each sector and market to the S&P 500 index.
- “M/A XVER” is determined by whether the short-term weekly moving average crosses positively or negatively with the long-term weekly moving average.
- The risk range is a function of the month-end closing price and the “beta” of the sector or market. (Ranges reset on the 1st of each month)
- The table shows the price deviation above and below the weekly moving averages.
- The complete history of all sentiment indicators is under the Dashboard/Sentiment tab at SimpleVisor.
Weekly Stock Screens
Each week we will provide three different stock screens generated from SimpleVisor: (RIAPro.net subscribers use your current credentials to log in.)
This week we are scanning for the Top 20:
- Relative Strength Stocks
- Momentum Stocks
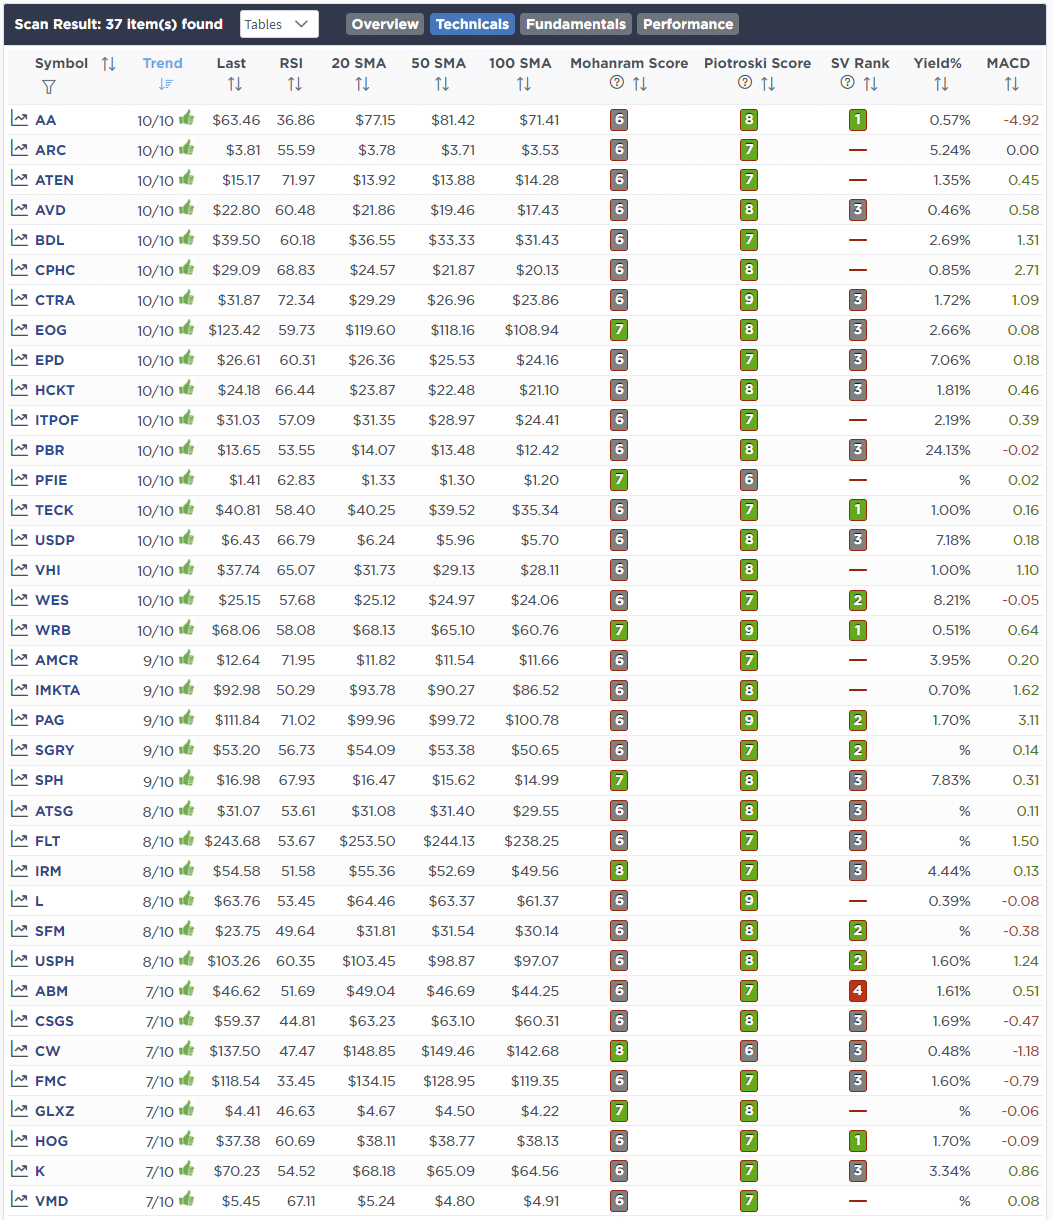
- Technically Strong With Strong Fundamentals
These screens generate portfolio ideas and serve as the starting point for further research.
(Click Images To Enlarge)
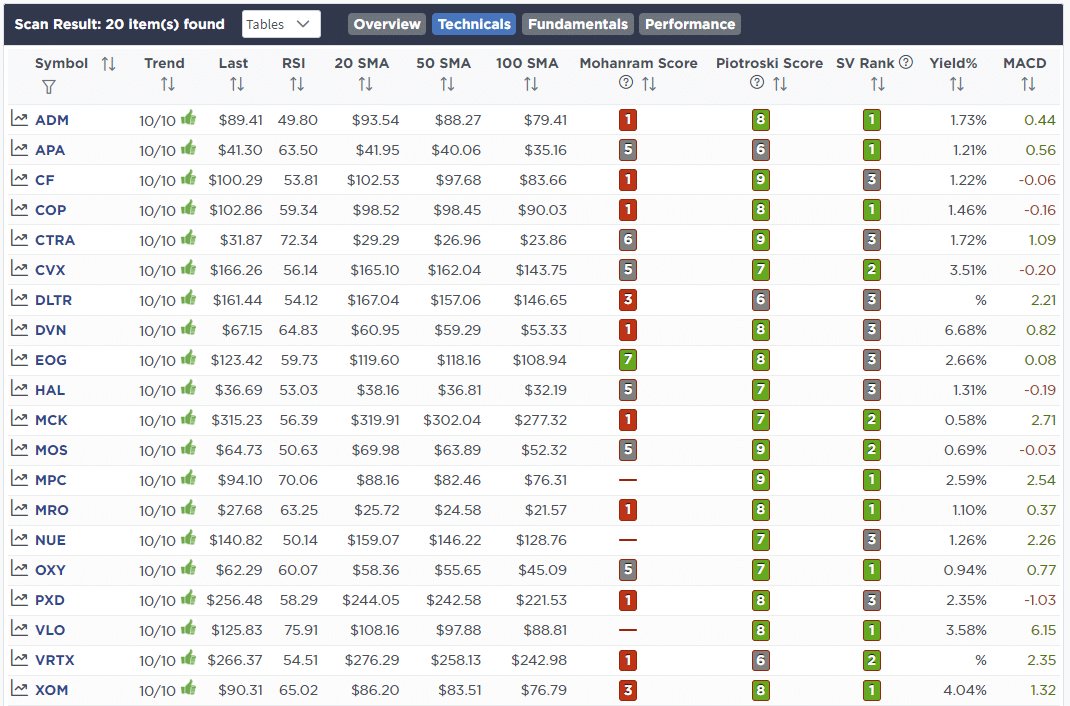
RSI Screen
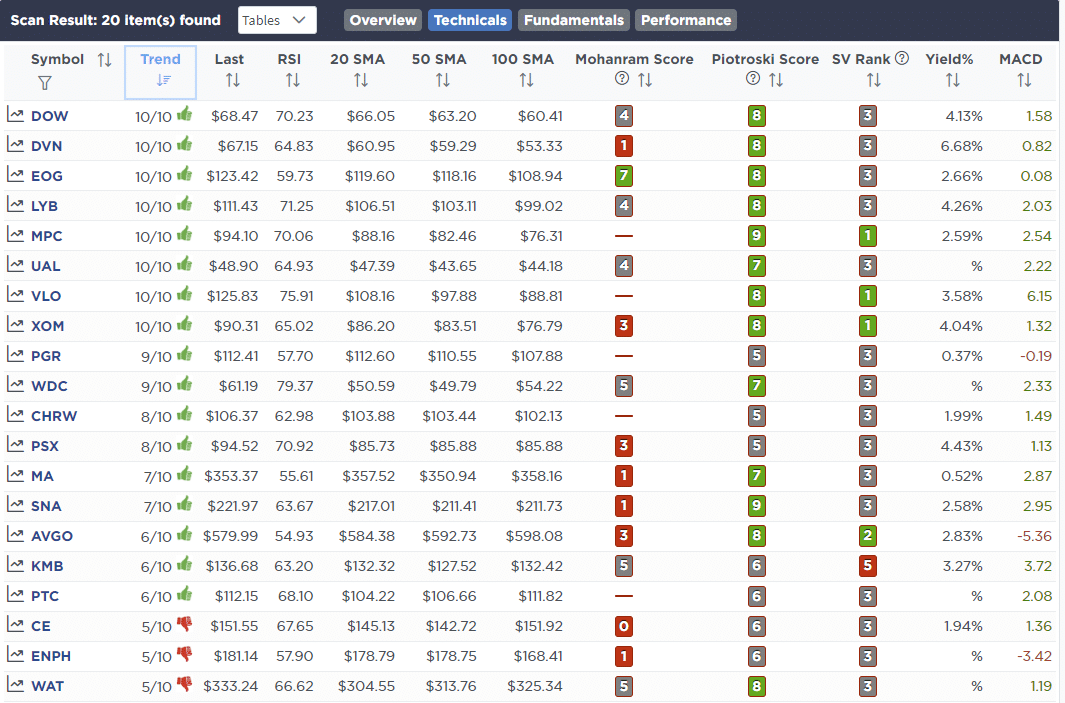
Momentum Screen
Technical & Fundamental Strength Screen
SimpleVisor Portfolio Changes
We post all of our portfolio changes as they occur at SimpleVisor:
May 5th
“This morning markets took a sharp hit reversing all of yesterday’s Fed relief rally. The selling was broad across the markets with little room to hide. However, we have been watching companies on the value side of the ledger that pay strong dividends and should help protect the portfolio in the event of further market deterioration.
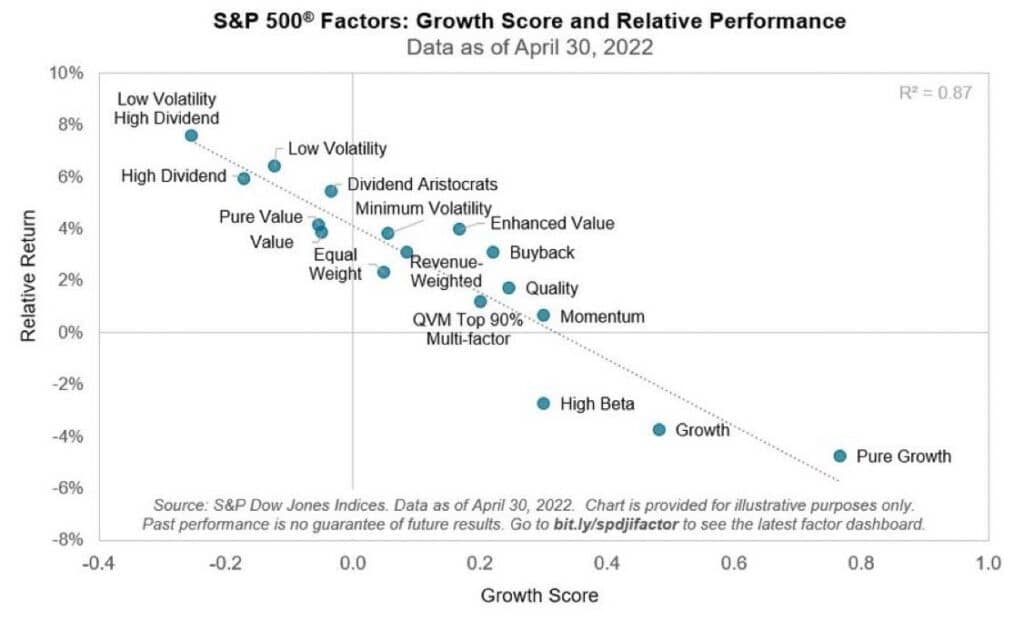
Therefore, we nibbled at a little exposure to both models via lower beta, more conservative stocks/sectors. In the sector model, we added VYM which is a high dividend value ETF. The graph below shows this factor has been the place to be thus far in 2022. If we assume the trends of the first four months continue, we suspect these stocks should continue to outperform.”
Equity Model
- Initiating a 1.5% position in Verizon (VZ) after selling it last year at higher levels.
- Increasing exposure to Public Storage (PSA) to 2.5% of the portfolio following the recent selloff.
Sector ETF Model
- Initiating a 2% position to VYM to increase value weighting in the portfolio.

Lance Roberts, CIO
Have a great week!


