Stuck In The Middle As Seasonal Sell Signals Trigger 05-16-20


In this issue of “Stuck In The Middle As Seasonal Sell Signals Trigger:”
- View Of The Markets & Portfolio Positioning
- MacroView: Why Jeremy Siegel Is Wrong About Bonds
- Sector & Market Analysis
- 401k Plan Manager
Follow Us On: Twitter, Facebook, Linked-In, Sound Cloud, Seeking Alpha
Catch Up On What You Missed Last Week

Stuck In The Middle
Currently, we seem to be stuck in the middle even as seasonal sell signals trigger. It reminds me of the lyrics of one of the classics.
“Trying to make some sense of it all,
But I can see that it makes no sense at all,
Is it cool to go to sleep on the floor,
‘Cause I don’t think that I can take any more
Clowns to the left of me, jokers to the right,
Here I am, stuck in the middle with you” – Stealers Wheel
It’s a fascinating dichotomy in the markets currently. As noted last week:
“There is currently a “Great Divide” happening between the near “depressionary” economy versus a surging bull market in equities. Given the relationship between the two, they both can’t be right.”
This week, the continuation of depressionary economic data continued:
- NFIB Survey fell to 90.9
- CPI fell 0.8% in one month
- PPI fell by 1.3% last month.
- Jobless Claims rose by 2,981,000
- Continuing Claims exceeding 22 million
- Retail Sales (40% of PCE) plunged by 17.2% last month
- Industrial Production declined by 11.2%
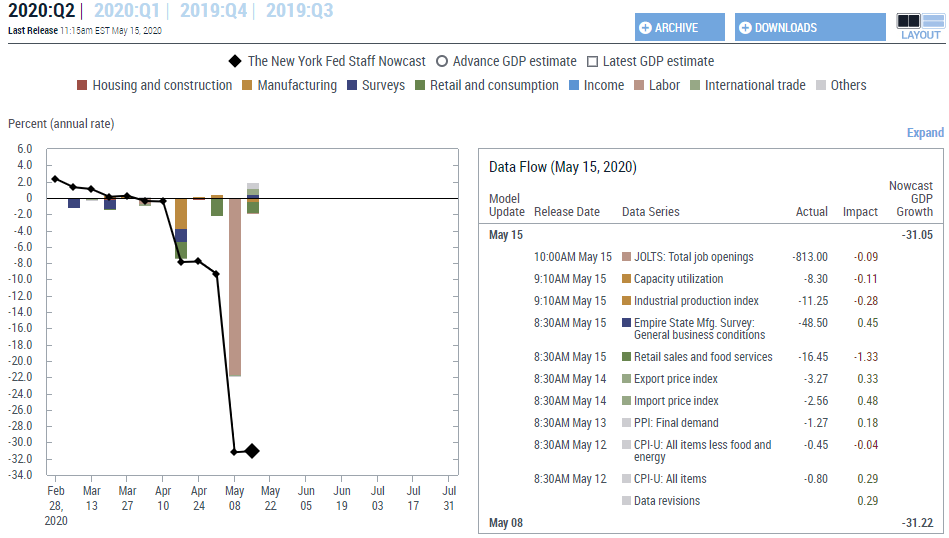
These are numbers not seen since the Great Depression, with expectations for economic growth in the second quarter at a -31.5% growth rate (shown below). The Atlanta Fed GDP Now is even worse with a -42.8% decline in GDP growth in the second quarter.
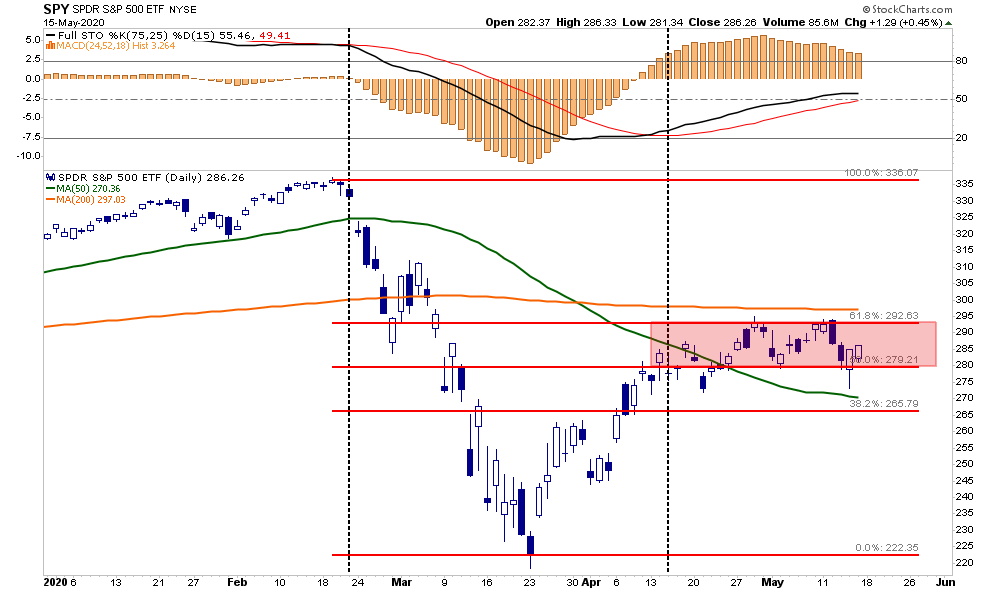
These numbers are mentally hard to grasp. Yet, the markets remain range-bound between the 50% and 61.8% retracement levels, consolidating the advance from the March 23rd lows.
The reason for the dichotomy is simple.
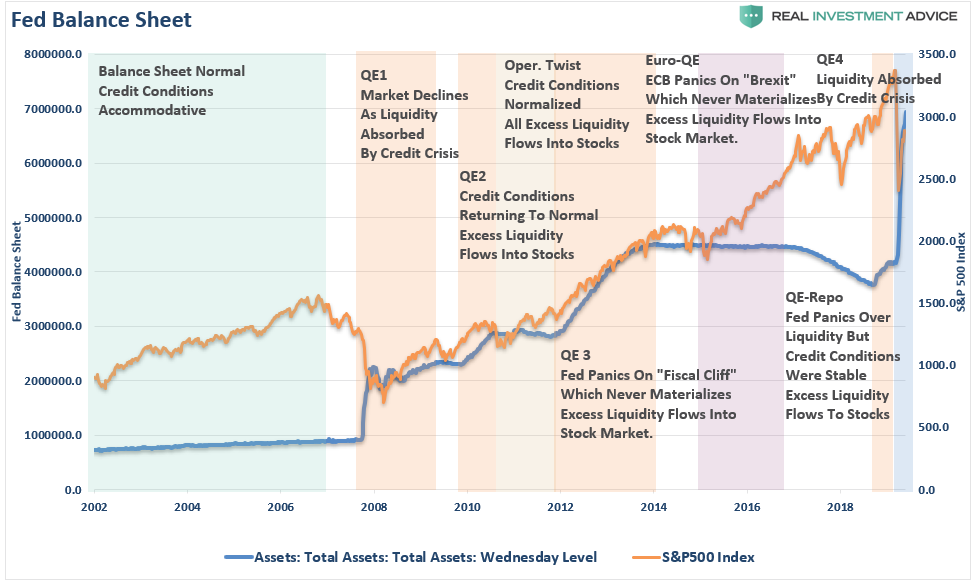
The bullish argument for stocks remains simple. As long as the Federal Reserve is pumping in liquidity, buy stocks.

Earnings Continue To Decline
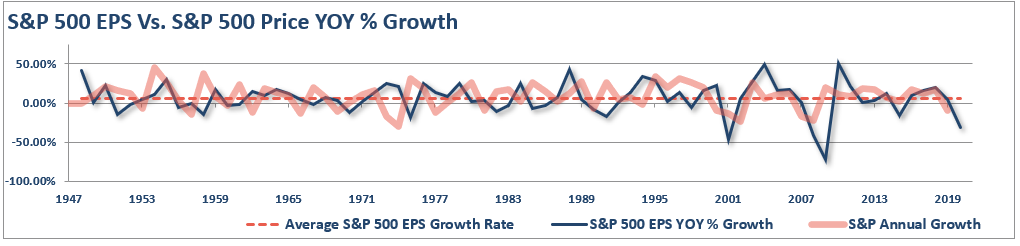
As investors, however, we need to be paying attention to earnings. There is a simplistic correlation between the economy and the markets. As I questioned in “The Stock Market Is Not The Economy?”
“The relationship becomes more evident when looking at the annual change in stock prices relative to the yearly change in GDP.”
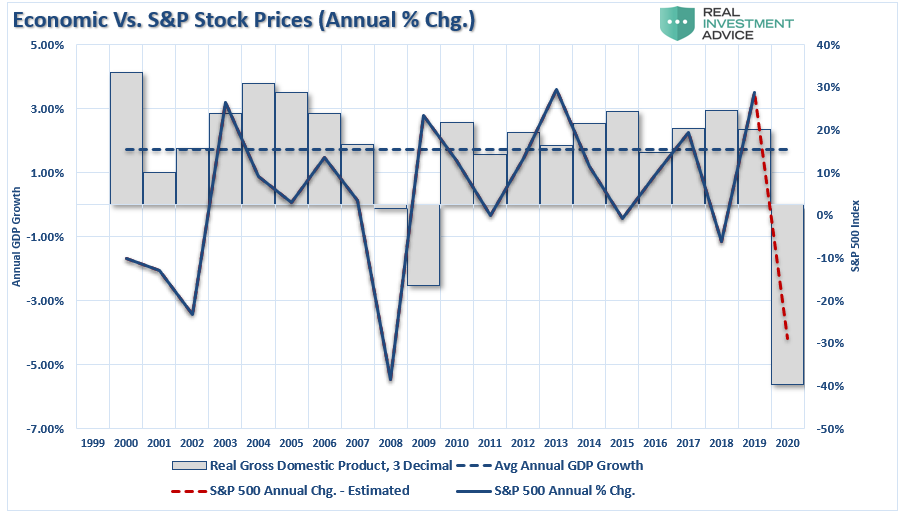
“Again, since stock prices are driven in part by the ‘psychology’ of market participants, there can be periods where markets become detached from fundamentals. However, there is no point in previous history, where the fundamentals catch up with stock prices.”
As stated, the equation is simplistic:
“Slower economic growth = less consumption (due to unemployment) = lower profit and revenue growth.”
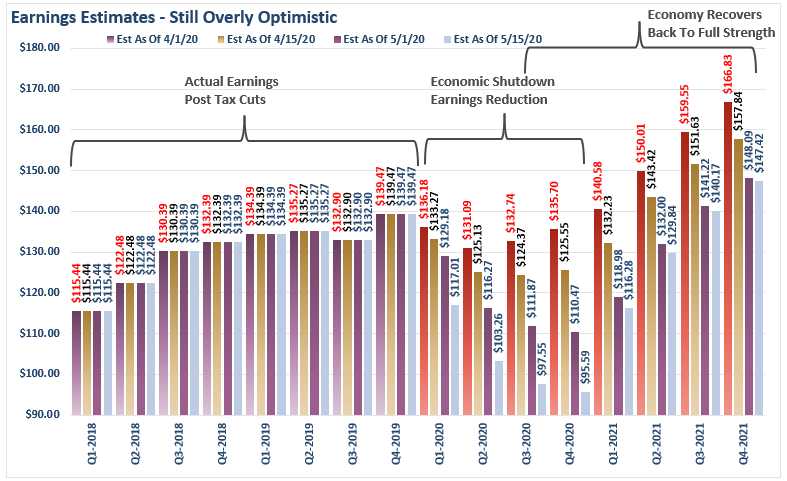
Based on the current economic devastation, earnings estimates for the next couple of quarters have fallen sharply. Unfortunately, they still have not compensated for the coming drop in revenues.
It’s The Economy Stupid
How do I know that?
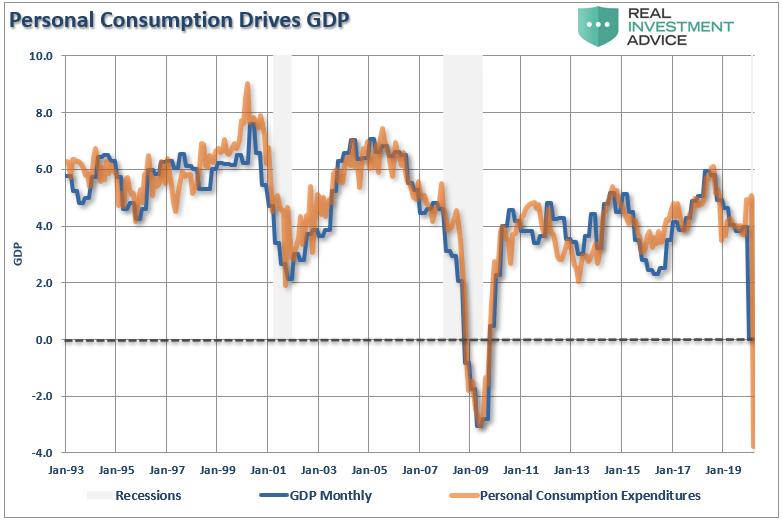
“PCE depends on jobs and wages as well as an intact supply chain, neither of which are in good condition. Regarding unemployment, the U6 rate, which is a more reliable indicator of job market health, is at 22.8% currently and rising while the labor market participation rate has dropped to about 60%. These factors do not bode well for growth and earnings for most companies.” – A Brinkley, Jr.
His statement is correct. There is a precise correlation between PCE and GDP. Not surprisingly, if consumption contracts due to high levels of unemployment, then economic growth declines. (PCE is 70% of GDP)
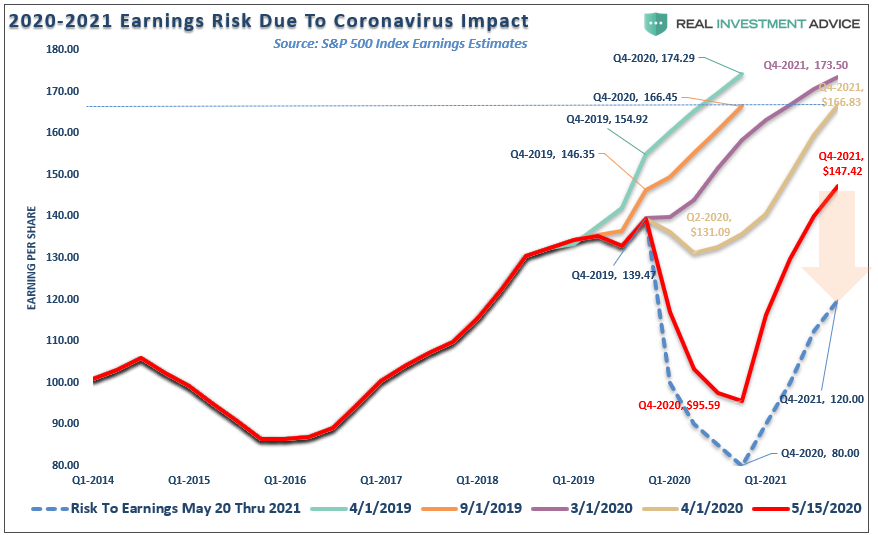
The other problem is investors remain overly optimistic about the recovery prospects for earnings going into 2021. As shown, in April 2019, it was estimated the S&P 500 would earn $174/share (reported earnings) at the end of 2020. Today, estimates for Q4-2021 now reside at just $147/share. This is a 15% contraction in estimates when we are discussing a 30-40% decline in GDP.
Valuations Matter
With expectations for the S&P 500 to return to all-time highs in 2021, such would mean that valuations currently paid by investors remain at historically high levels.
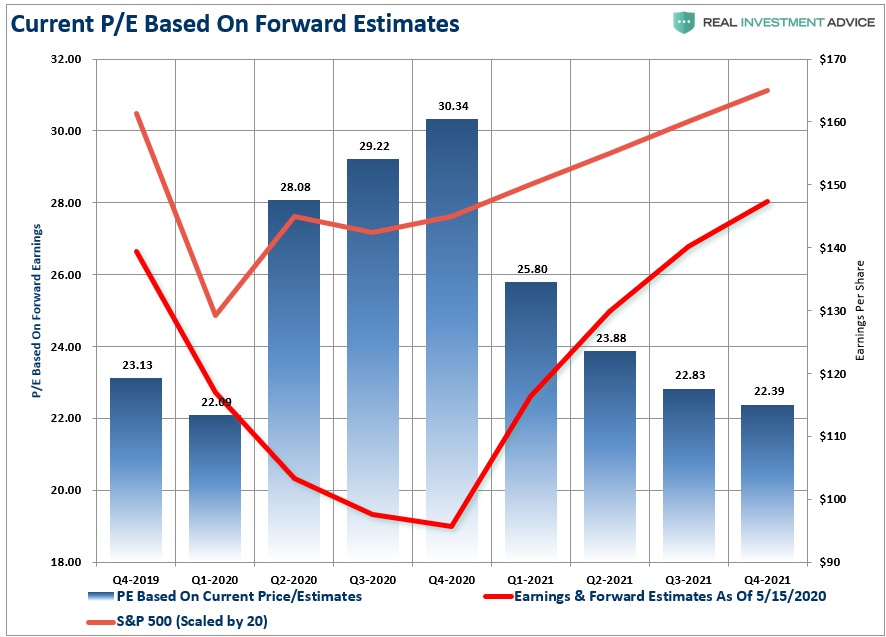
As Warren Buffett states: “Price is what you pay, value is what you get.”
While it seems these concerns are irrelevant due to the Federal Reserve’s ongoing liquidity injections, fundamentals and valuations always matter over time.

3-Different Bulls
We have talked before about the “narrowness” of the market. Since the March 23rd lows, the “bull market” advance was three different “bull markets.” The three charts below break out the sectors of the market down into “bull market” groupings. I have recalibrated each sector to a $50 starting price in January of this year.
The “Struggling Bull” market has been in sectors that we currently maintain no exposure to in portfolios. These are the sectors most exposed to either the “Coronavirus” impact, or the Fed’s monetary liquidity and zero interest rates.
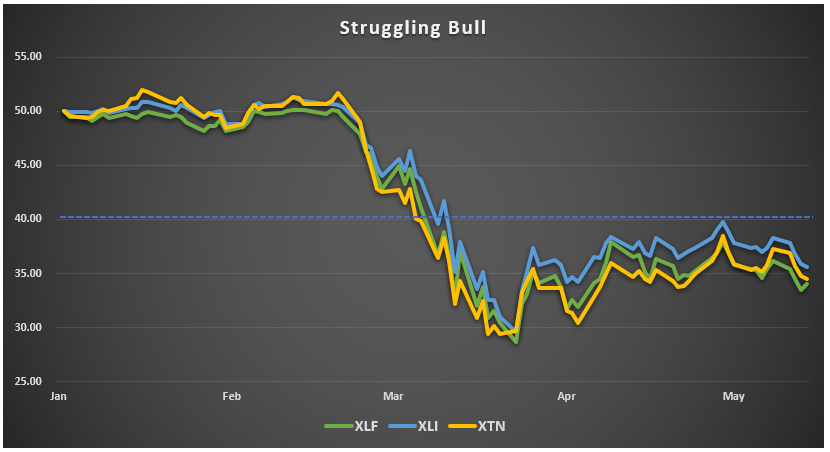
Industrial and Transportation stocks are most affected by the economic shutdown, while Financials are impacted by reductions of net interest income from zero interest rates, and rising delinquency rates. All three sectors remain below $40, and only marginally above the March 23rd lows.
The next group we classify as a “Stuttering Bull” as the recovery has been better, but the sectors continue to underperform overall. These sectors have been primarily range-bound between $40 and $45/share since coming off their $30 lows.
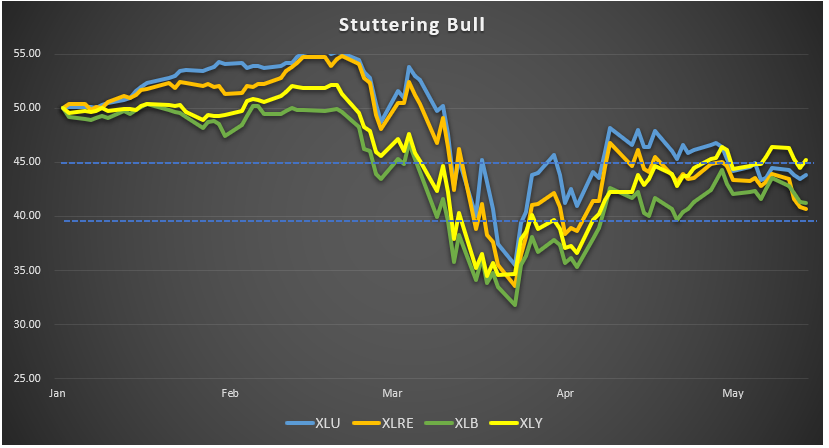
These sectors are still susceptible to the impacts of the “economic shutdown” from reduced revenues, bankruptcies, unemployment risks, etc.
The last grouping are the sectors we remain most heavily weighted in. These are the companies that are “deemed” to be the most protected from the impacts of the “economic shutdown.” These sectors did not decline as much as the others during the selloff, and now all trade above $45/share.
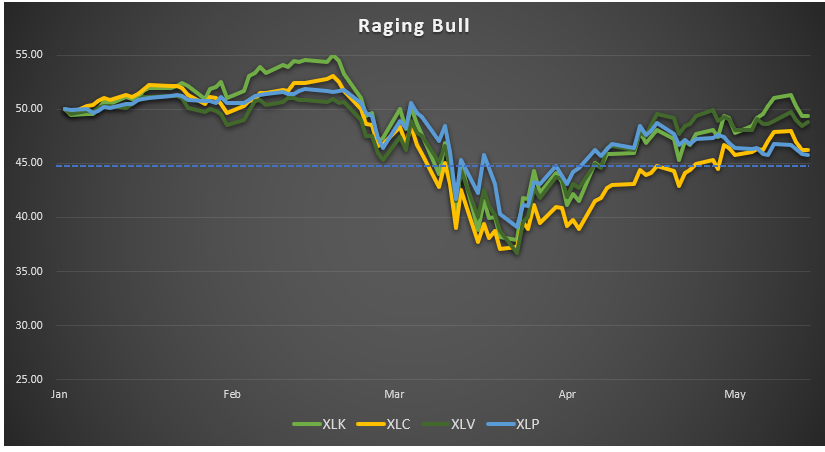
The sectors are in a “Raging Bull” market and are within striking distance of all-time highs.
This data tells us two important things.
- If you wanted to beat the S&P 500 this year, you needed only to own 4-market sectors, and;
- While earnings may not seem to matter at the moment, they eventually will. Staples, Technology, Communications, and Healthcare are all trading at very elevated valuations.
Most importantly, while the advance has been notable, participation has not only remained weak but continues to weaken during this consolidation.
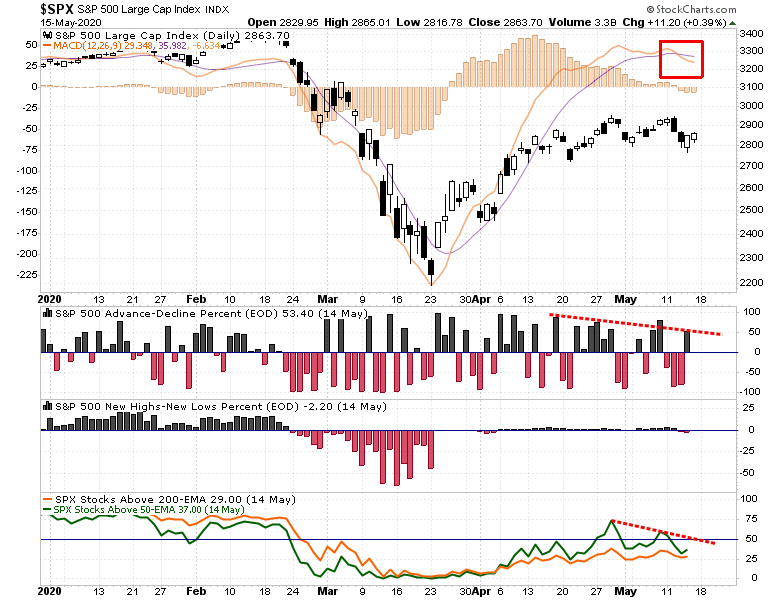
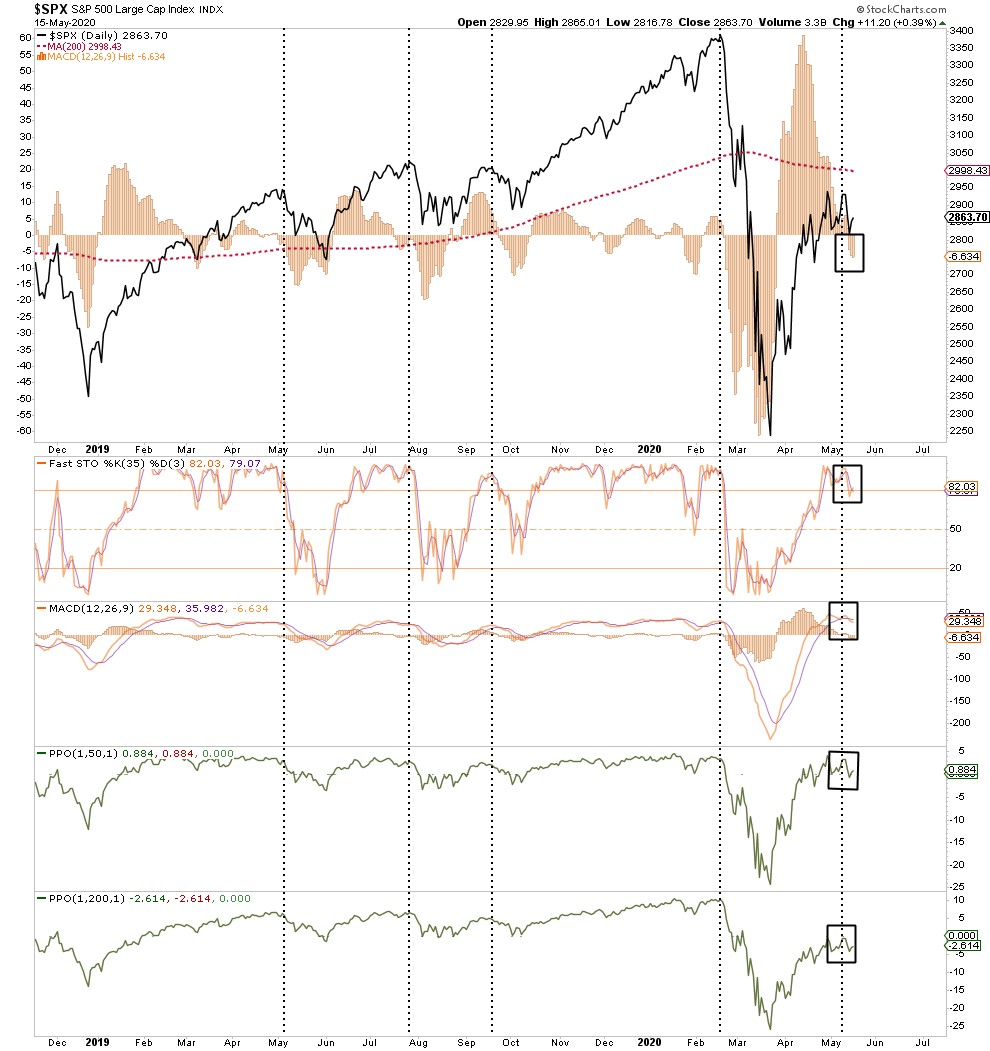
With the MACD “seasonal sell” triggered, it may be time to turn a bit more cautious for the summer.

Seasonal Sell Signals Trigger
As I discussed with our RIA PRO subscribers (30-day RISK FREE Trial) the “Sell In May” strategy might be worth paying attention to this year. To wit:
“While not every ‘summer period’ is negative, the long-term history of investing during the summer months is not stellar.”
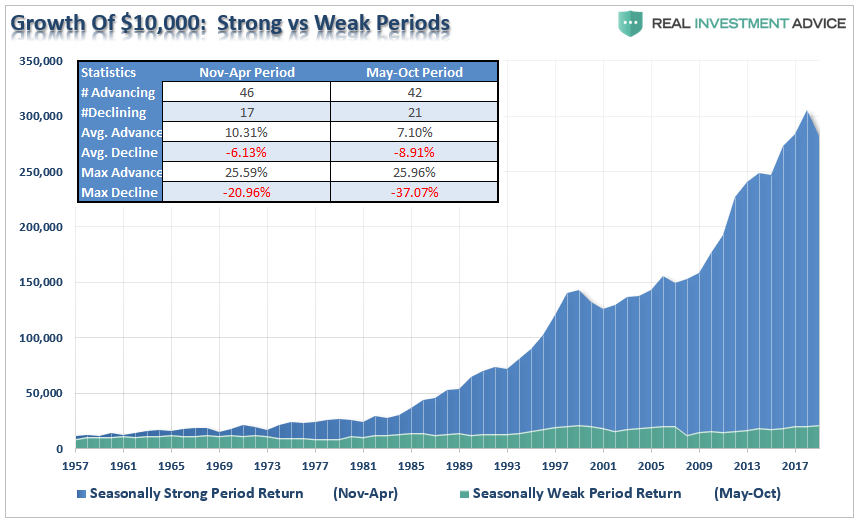
“However, the adage ‘Sell in May’ may be more appropriate this year given the state of the actual economy, earnings risk, and a potential revaluation of markets. The odds of a weak summer period have risen markedly.”
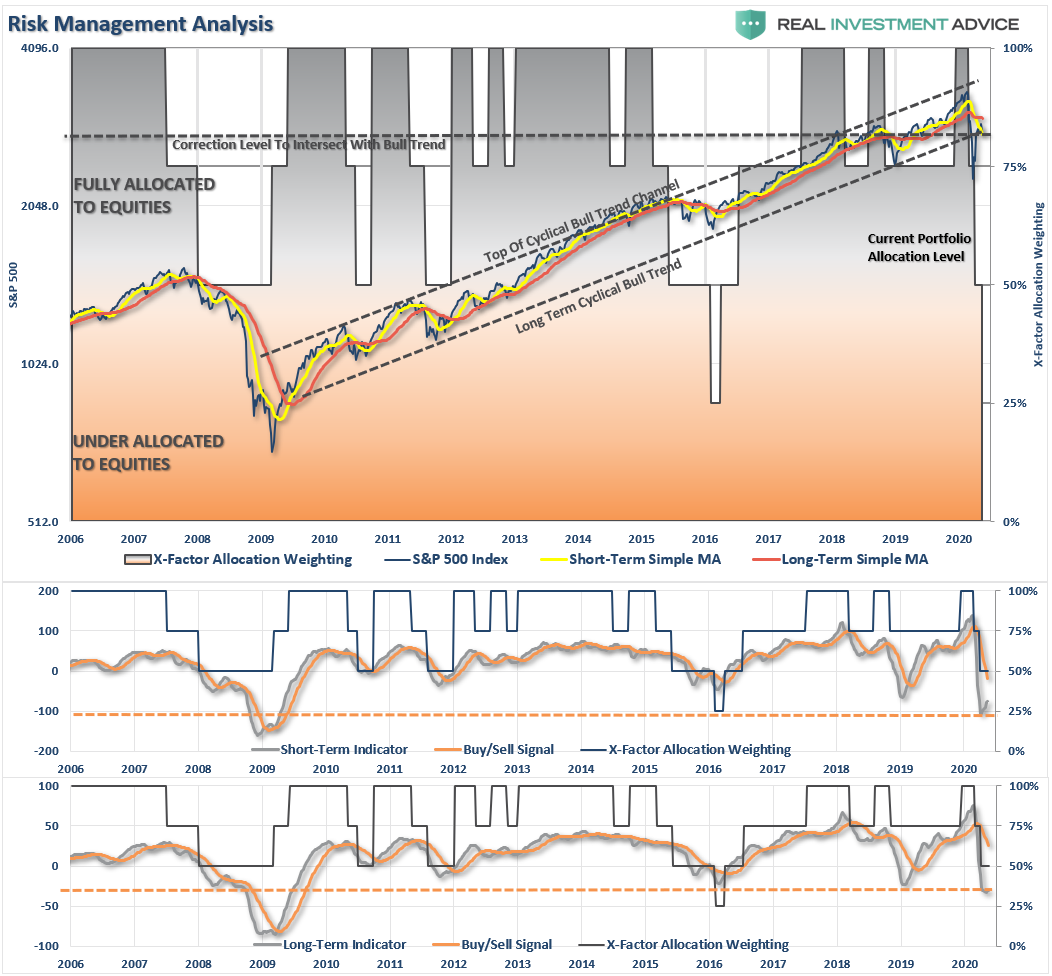
With the “seasonal sell” signal now firmly entrenched, the markets overbought on many levels, and participation remaining weak, the “risk” of having aggressive equity exposures has risen.
While the market can undoubtedly resolve stretched conditions by grinding sideways, such won’t fix the issues of participation and momentum.
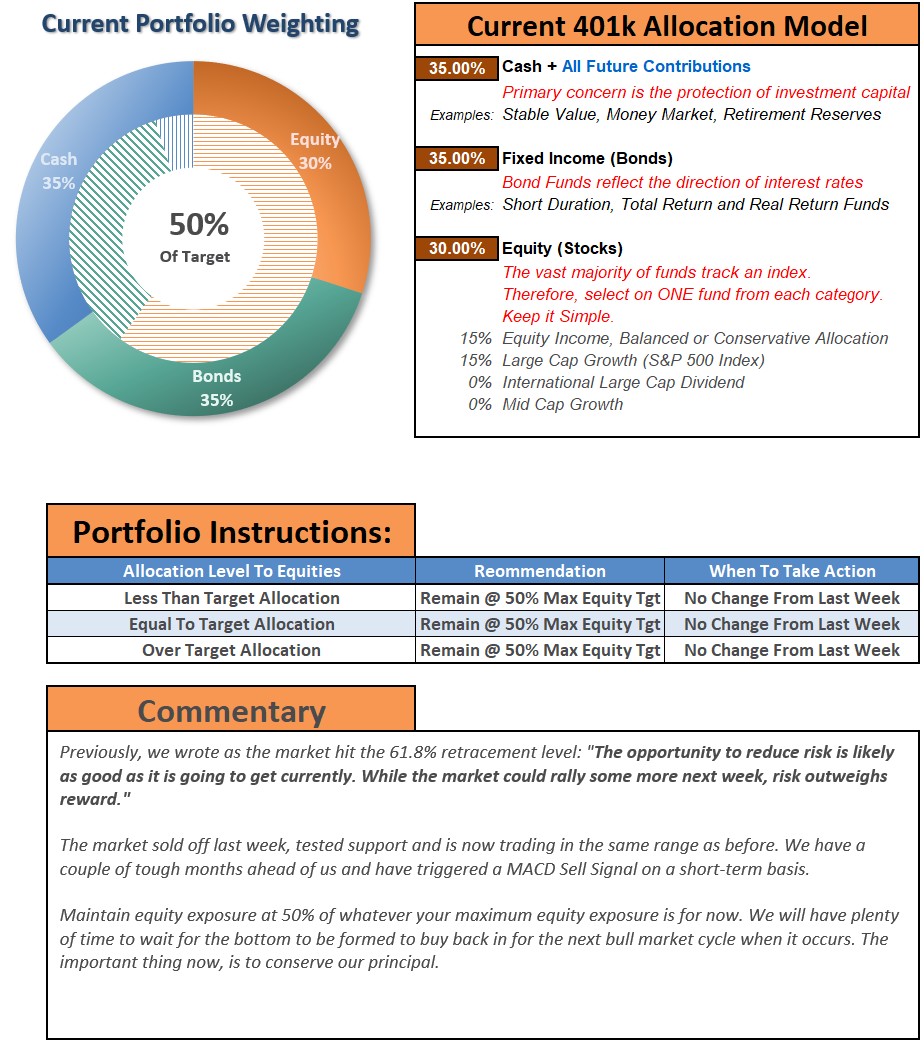
Positioning Update
With seasonal sell signals in place, we are very focused on our positioning. While we did modestly increase our equity exposure during last week’s pullback, we did so in areas which remain defensive. We also balanced that increase in exposure with matched weights in shorter-duration Treasury bonds to hedge our risk.
Taking profits in our trading positions continues to be a “staple” in our management process. Such is particularly the case in positions like Clorox (CLX), which have become grossly extended. Importantly, as noted in the sector performance analysis above, we also continue to rebalance portfolios into outperforming areas of the market.
The process is simple. As we continue to adjust our equity exposures to participate with the markets, we are balancing those increases with offsetting hedges, and a larger than average level of cash, to protect against sudden declines.
As I concluded last week:
“There is only one thing I am sure of, a raging bull market in stocks can NOT co-exist with a depressionary economy for long. The stock market is NOT the economy. But the economy is a reflection of the very thing that supports higher asset prices – corporate profits.”
We don’t like the risk/reward of the market currently, and suspect we will have a better opportunity to increase equity risk later this summer.
But, if things change, we will also.

The MacroView
If you need help or have questions, we are always glad to help. Just email me.
See You Next Week
By Lance Roberts, CIO
Market & Sector Analysis
Data Analysis Of The Market & Sectors For Traders
MISSING THE REST OF THE NEWSLETTER?
This is what our RIAPRO.NET subscribers are reading right now! Risk-Free For 30-Day Trial.
- Sector & Market Analysis
- Technical Gauges
- Sector Rotation Analysis
- Portfolio Positioning
- Sector & Market Recommendations
- Client Portfolio Updates
- Live 401k Plan Manager

THE REAL 401k PLAN MANAGER
A Conservative Strategy For Long-Term Investors
If you need help after reading the alert; do not hesitate to contact me
Model performance is a two-asset model of stocks and bonds relative to the weighting changes made each week in the newsletter. Such is strictly for informational and educational purposes only and should not be relied on for any reason. Past performance is not a guarantee of future results. Use at your own risk and peril.

401k Plan Manager Live Model
As an RIA PRO subscriber (You get your first 30-days free) you have access to our live 401k plan manager.
Compare your current 401k allocation, to our recommendation for your company-specific plan as well as our on 401k model allocation.
You can also track performance, estimate future values based on your savings and expected returns, and dig down into your sector and market allocations.
If you would like to offer our service to your employees at a deeply discounted corporate rate, please contact me.


