
Inside This Week’s Bull Bear Report
- Rally Into Year End?
- How We Are Trading It
- Research Report – Jobs & Retail Sales Data
- Youtube – Before The Bell
- Market Statistics
- Stock Screens
- Portfolio Trades This Week
It’s Make Or Break Time For The Market
On Wednesday, Jerome Powell’s speech sparked a broad rally in stocks and bonds as market expectations for further rate hikes collapsed. There was nothing new about the Fed’s recent policy announcement as they maintained that higher Treasury yields are doing their work in slowing economic activity and, ultimately, inflation. However, they did, again, as expected, leave open the possibility of further rate hikes as needed.
- POWELL: PROCESS OF GETTING INF. TO 2% HAS A LONG WAY TO GO
- *POWELL: FULL EFFECTS OF TIGHTENING YET TO BE FELT
- *POWELL: NOT CONFIDENT WE’VE REACHED STANCE FOR 2% INFLATION
Given that the Fed did little to talk up the projections of further rate hikes, the market took this as meaning the Fed is likely done hiking rates. Of course, that means, from the market’s perspective, the subsequent actions will be “rate cuts.”
With that, risk assets and bonds surged as buyers jumped in to buy the recent dip. The break of the 200-DMA was reversed on Thursday, and the 50-DMA was breached on Friday. Those actions set the market up for a rally into year-end.
The problem with the market rallying and yields dropping is that it undoes the financial constriction they provided on the economy. Higher asset prices boost consumer confidence, and lower yields provide buying power. Both of those actions create the possibility of a resurgence in inflation, putting the Fed back into “hawkish” mode to make sure inflation falls.
Notably, inflation falls when economic activity declines, so it will be a tricky balancing act next year to achieve lower inflation without crashing the economy. But that is something we will discuss in January.
For now, as noted, the rally is on. The question is how long it will last and how to trade it.
Need Help With Your Investing Strategy?
Are you looking for complete financial, insurance, and estate planning? Need a risk-managed portfolio management strategy to grow and protect your savings? Whatever your needs are, we are here to help.

Rally Into Year End?
Last week, we discussed the possibilities and probabilities of a rally into year-end. To wit:
“What’s the history when turmoil grips the planet in October, heading into the Best Six Months of the year? Since WWII, there has been an ongoing war or international conflagration going on practically all the time. Things have come to a head in October many times, with several happening in the Mideast. Current events in the Middle East are especially tense.
We’ve tried to pinpoint the Recent High related to the crisis and then the nearest Subsequent Low around October. We included the nearest Crisis Low, the Q4, Year, Best Six Months, and Next Year % Changes.
We find ourselves today at a similar crossroads with the Hamas attack, Israel’s reaction and unrest in Mideast and on the world stage. If this situation can be contained the market will likely rally sharply. If it drags on or escalates that will likely negatively impact the market.”
![[Best Six Months Global Turmoil]](https://realinvestmentadvice.com/wp-content/uploads/2024/04/AIN_1123_20231026_Turmoil_900-jpg.webp)
“We are still in the window of October weakness, but many seasonal factors suggest the possibility of a year-end rally.”
While the last three months have discouraged investors, the psychological shift from bullish to bearish since the July peak is unsurprising. As I noted then:
“This past week, the market pushed well past our previous price target and is moving well into 3-standard deviations above the 50-DMA. Furthermore, the market is very overbought on multiple levels. Lastly, the volatility index is at extremely low levels, which has almost uniformly preceded corrections of 5-10% during both bull and bear markets.“
We also discussed that when that correction came, the “bears would reassert themselves, and the bulls would throw in the towel.” Such has indeed been the case, with both professional and retail investor sentiment becoming negative.

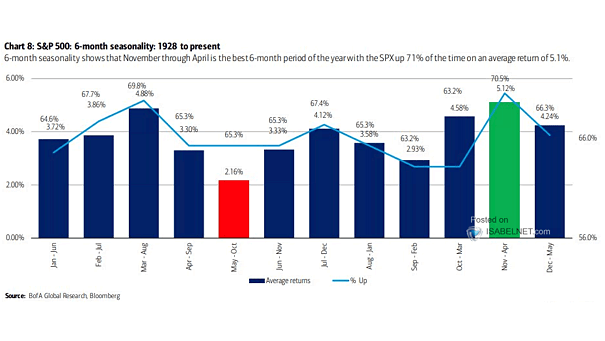
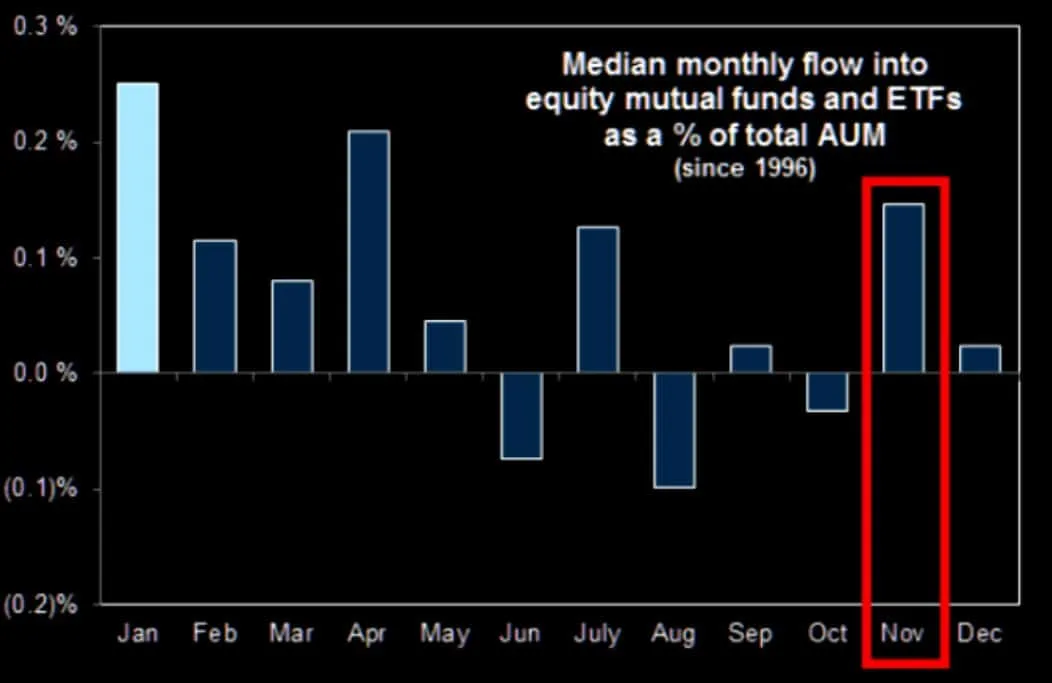
With a rather brutal October behind us, the seasonal statistics of November and December provide a more optimistic outlook for a rally. From a historical perspective, November through April is the best 6-month period of the year, with the S&P 500 index rallying 71% of the time with a 5.1% average annual return.
However, it isn’t just negative sentiment and seasonality that will fuel a potential rally into year-end.
Technical Support For A Rally
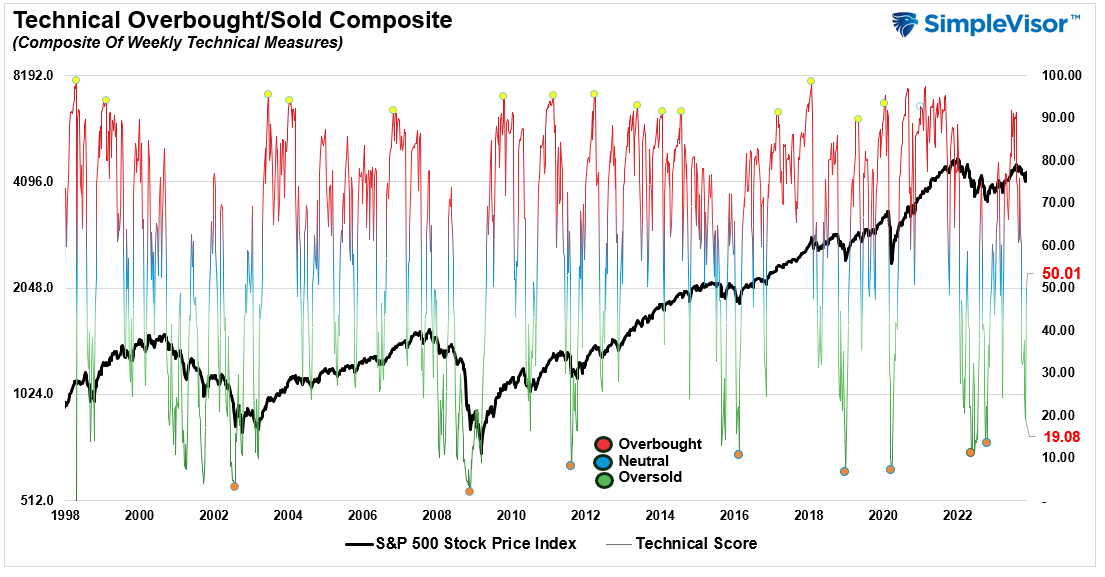
As noted last week, our weekly composite technical gauge reached more extreme levels that have often been associated with bear market bottoms and correction lows.
“Given the very negative levels of investor sentiment and oversold technical conditions, as shown, the possibility of a counter-trend rally is decent. Our weekly technical composite indicator has not been this oversold since October 2022 and is near levels that have historically always marked correction and bear market bottoms.”
The chart is updated to show the current position, which improved sharply from last week’s low.
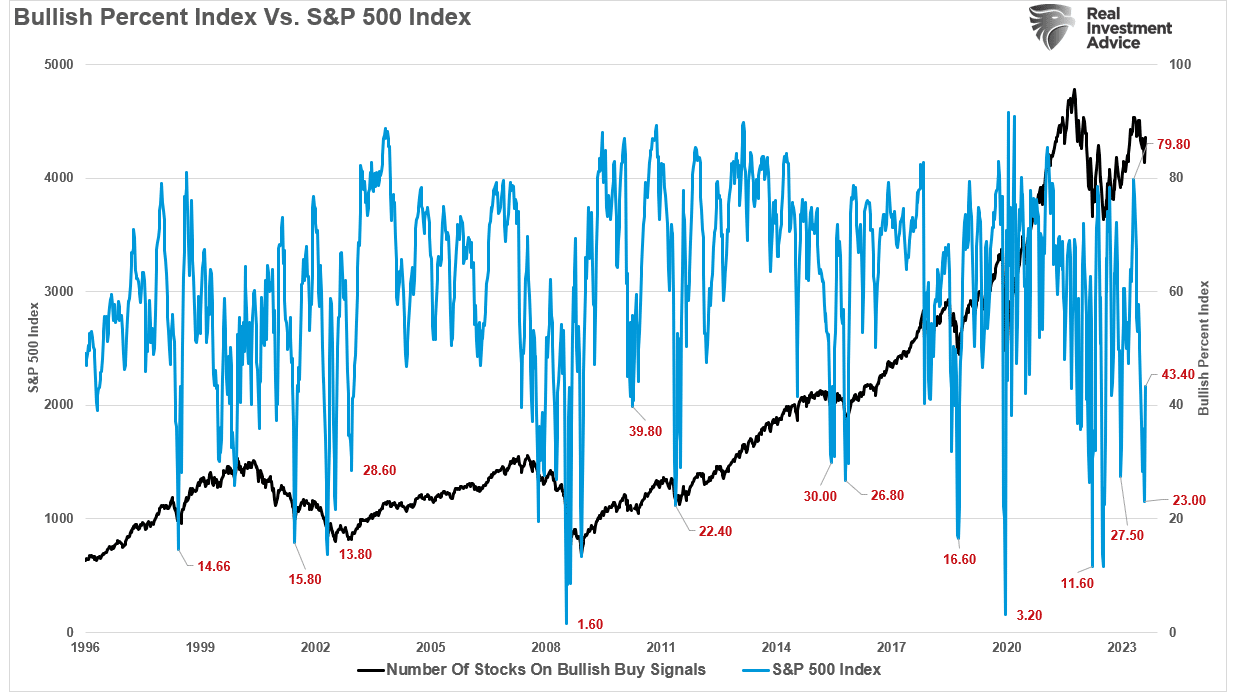
However, it isn’t just the oversold condition of the market; other technical indicators also point to readings that are associated with reflexive market rallies. For instance, the percentage of stocks on “bullish buy signals” has fallen very low.
The chart is updated from last week’s low.
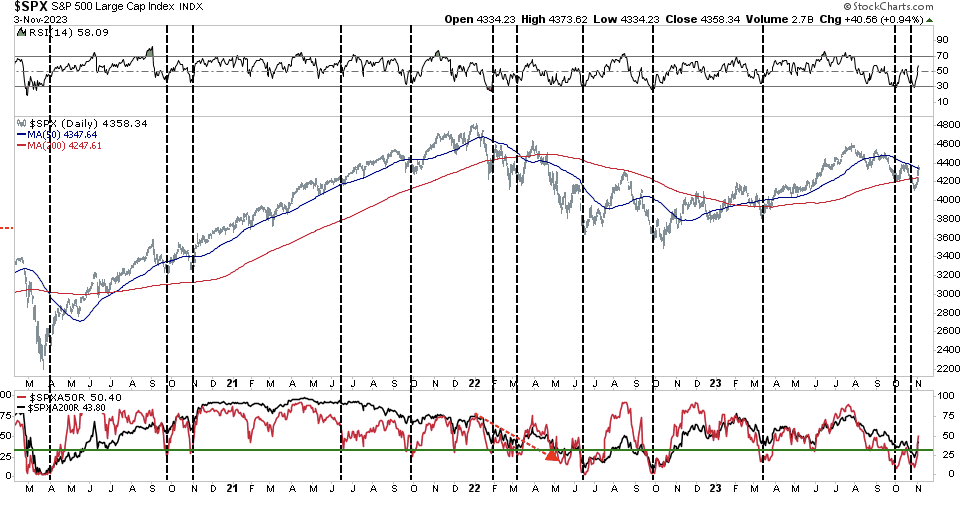
Combine that reading with the percentage of stocks trading below their respective 50-DMA and 200-DMA. When the percentage of stocks trading above their respective 50-DMA falls below 30%, such has been a strong contrarian signal. With a large majority of stocks trading below the 50- and 200-DMA and the Relative Strength Index (RSI) at low levels, a counter-trend rally into year-end would be unsurprising.
Bose indicators suggest that selling has reached an exhaustion level, which will bring buyers back into the market. Adding to that buying power, as noted by Goldman Sachs on Wednesday, are the fund flows that occur into year-end as professional managers have to allocate capital for year-end reporting. To wit:
“Goldman estimates that we should see $2.5 billion per day coming to the market in November in terms of equity fund inflows. Add buybacks estimated to run at close to $5 billion per day at peak later in November. And then potentially add to that the more than $100 billion in short positions that CTAs might have to reverse.”
While there is no guarantee that the market will rally into year-end, the combination of sentiment, technicals, and sentiment certainly tilts the odds in favor of being long.
Such is especially true when the market has been negative for three months consecutively.
3-Negative Months In A Row
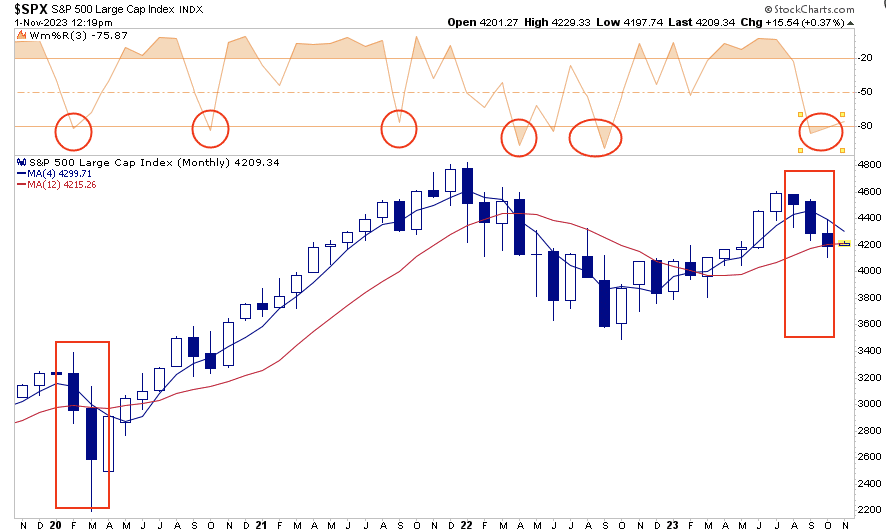
It is interesting that in July, I wrote “Trading An Unstoppable Bull Market.” At that time, the thesis was that “artificial intelligence” had changed the game and the market would not drop anytime soon. We argued differently.
“As shown below, the S&P 500 is set to close out its fifth straight month of gains. In addition to being up six out of the seven months this year, returns are unusually high, with the S&P advancing 18% year-to-date.
Historically, when prices move toward the upper bands of 2- or 3-standard deviations above the 50-day moving average (dma), the Williams %R is overbought, and the MACD is crossing lower from a high level, stock prices generally correct to some degree. Such is the potential environment we will likely deal with in the next few weeks as earnings season concludes. Such is also why we have suggested holding off trading portfolios and increasing equity exposure until some of these more overbought conditions are corrected.“
Of course, that was the market’s peak before the August-October decline.
We wrote about such abnormally strong streaks previously as well. In August 2021, we discussed the 6-month win streak for the market, noting:
“The table shows that nearly 40% of the time, two months of positive performance gets followed by at least one month of negative performance. Conversely, three consecutive positive months occur 23% of the time, and only 14% of occurrences stretch to 4-months.
Since 1871, there have only been 12-occurrences of 6-month or greater stretches of positive returns before a negative month appeared. In total, there are just 40 occurrences; out of 245 periods of 2-months or more, the market ran 6-months or longer without a correction.
However, the run ended in at least a negative return month in every period, but the vast majority ended with much deeper corrections.
The point is that while long stretches of advances happen, they always inevitably end. Unsurprisingly, the bullish stretch of gains in 2021 ended in the 2022 correction.
Currently, the markets have had 3-consecutive months of declines. While there have historically been longer stretches, the current 3-month span is the longest since March 2020. While we currently don’t have the Federal Reserve and the Government throwing trillions of dollars into the economy, the length of the decline is worth noting. Even during the 2022 correction, we never experienced more than two months of consecutive declines.
While 3-months of consecutive declines by itself is not necessarily a buy signal, there have only been a few cases where such has occurred heading into November.
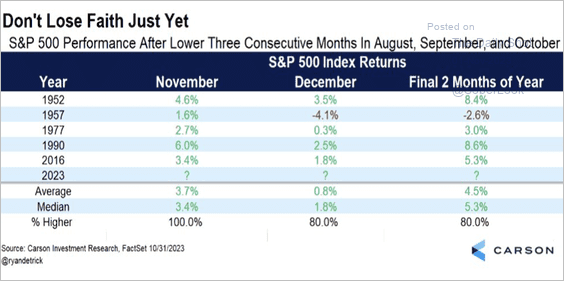
Combined with unfavorable internals, oversold conditions, and bearish sentiment, a rally into year-end becomes a much higher probability event.
We suggest patience and waiting for a better opportunity to reduce risk and rebalance portfolios accordingly.
How We Are Trading It
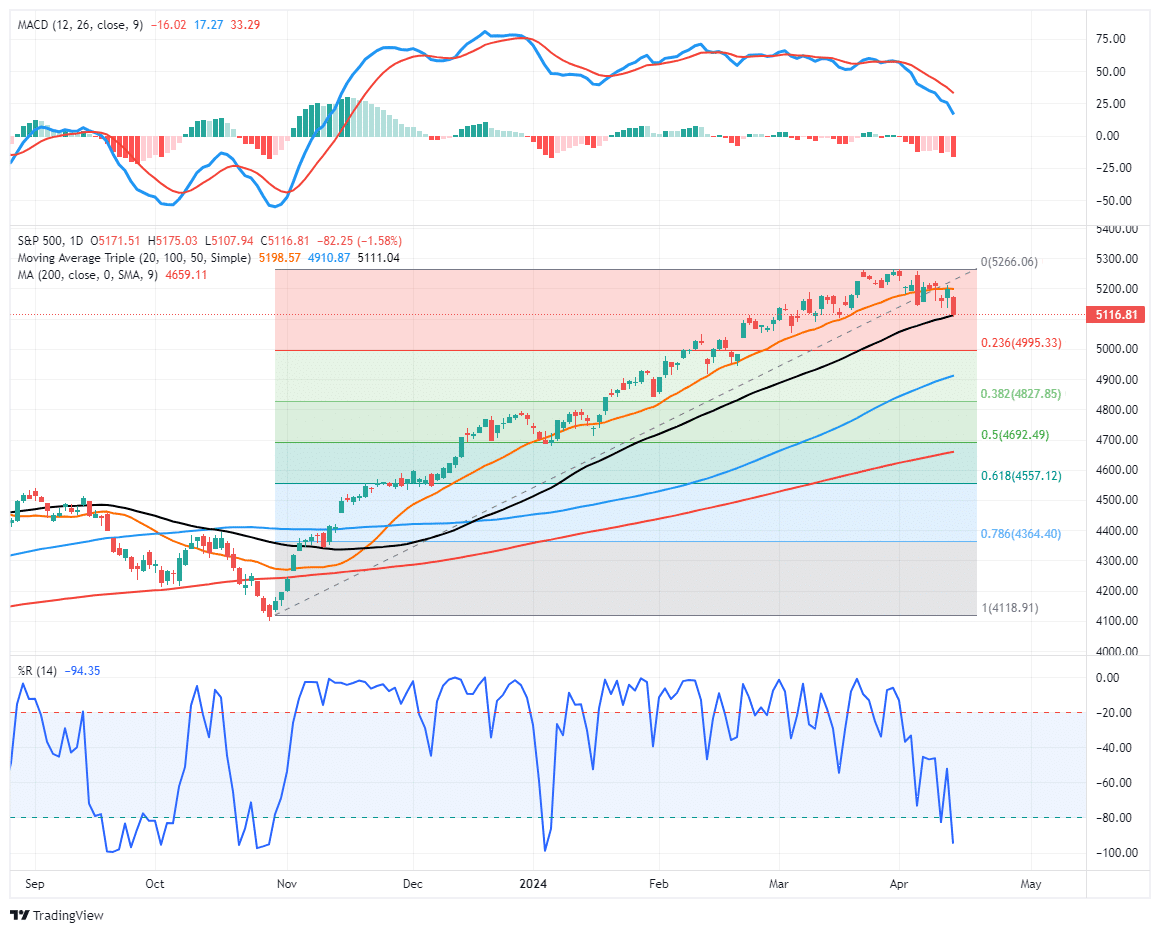
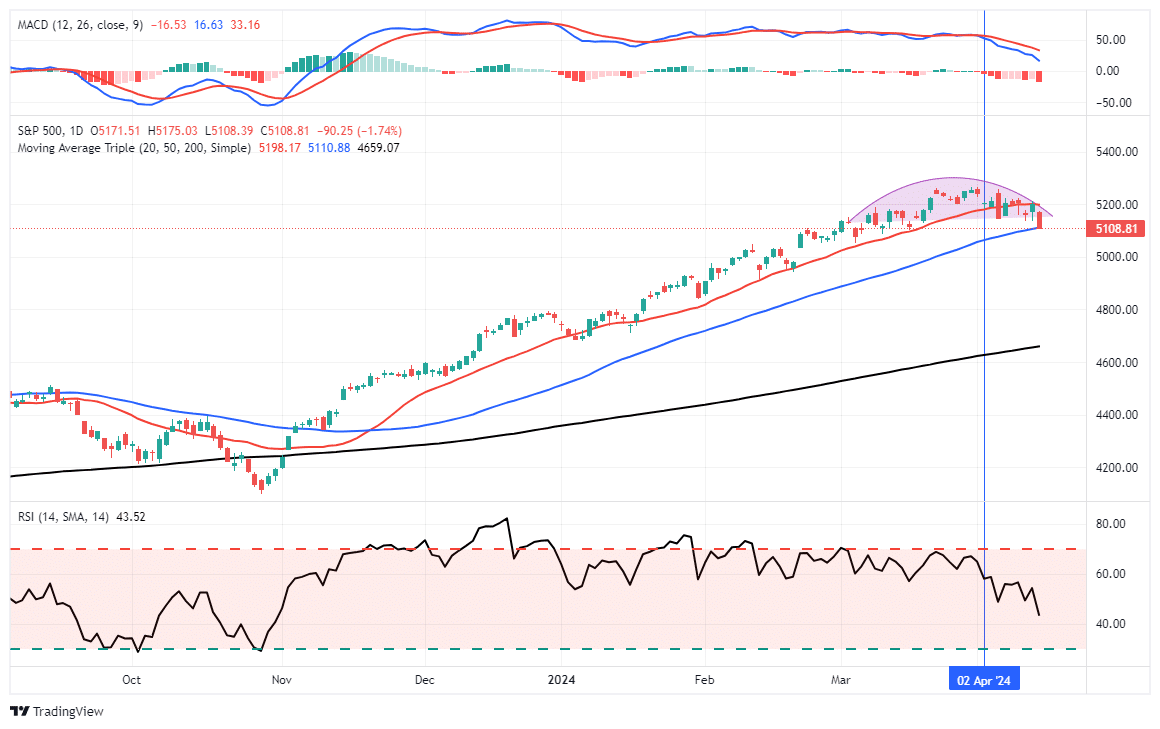
While there is support for a rally into year-end, there are also substantial risks ahead. As shown in the chart below, while we are looking for a rally, we also have several levels that will provide resistance where we will look to rebalance risks. We pushed through the 50% retracement level, which is also the 50-DMA. As noted above, that clears the way for a rally higher with a more bullish tone. That now sets the next targets at the 61.8% and 78.6% levels, then this year’s highs. While the highs are possible, it is likely a lower probability event heading into 2024.
Regardless of the eventual outcome, the market will not go to those levels in a straight line. Therefore, as we noted last week:
“The market is oversold, and the recent selling pressure across all assets is nearing exhaustion. If you are worried about what is happening overseas or with the Fed and the economy, use rallies to reduce risk at better price levels.”
- Tighten up stop-loss levels to current support levels for each position.
- Hedge portfolios against more significant market declines.
- Take profits in positions that have been big winners.
- Sell laggards and losers.
- Raise cash and rebalance portfolios to target weightings.
From a portfolio management perspective, we have to trade the market we have rather than the one we think should be. This can make the challenge of battling emotions difficult from week to week. However, the rally we expected has arrived and is providing a better risk/reward opportunity to rebalance equity exposure.
As noted last week, “Periods like this are never fun, but the market never goes straight up or down. However, the psychological strain during periods of market weakness leads to a host of behavioral mistakes that lead to longer-term underperformance. This period will pass, and the next bullish cycle will begin. Sometimes, turning off the television can help reduce the emotional toll of headline news.”
It may have passed for now, but such doesn’t mean the risk is entirely removed. Trade accordingly.
See you next week.
Research Report
Subscribe To “Before The Bell” For Daily Trading Updates
We have set up a separate channel JUST for our short daily market updates. Please subscribe to THIS CHANNEL to receive daily notifications before the market opens.
Click Here And Then Click The SUBSCRIBE Button
Subscribe To Our YouTube Channel To Get Notified Of All Our Videos
Bull Bear Report Market Statistics & Screens

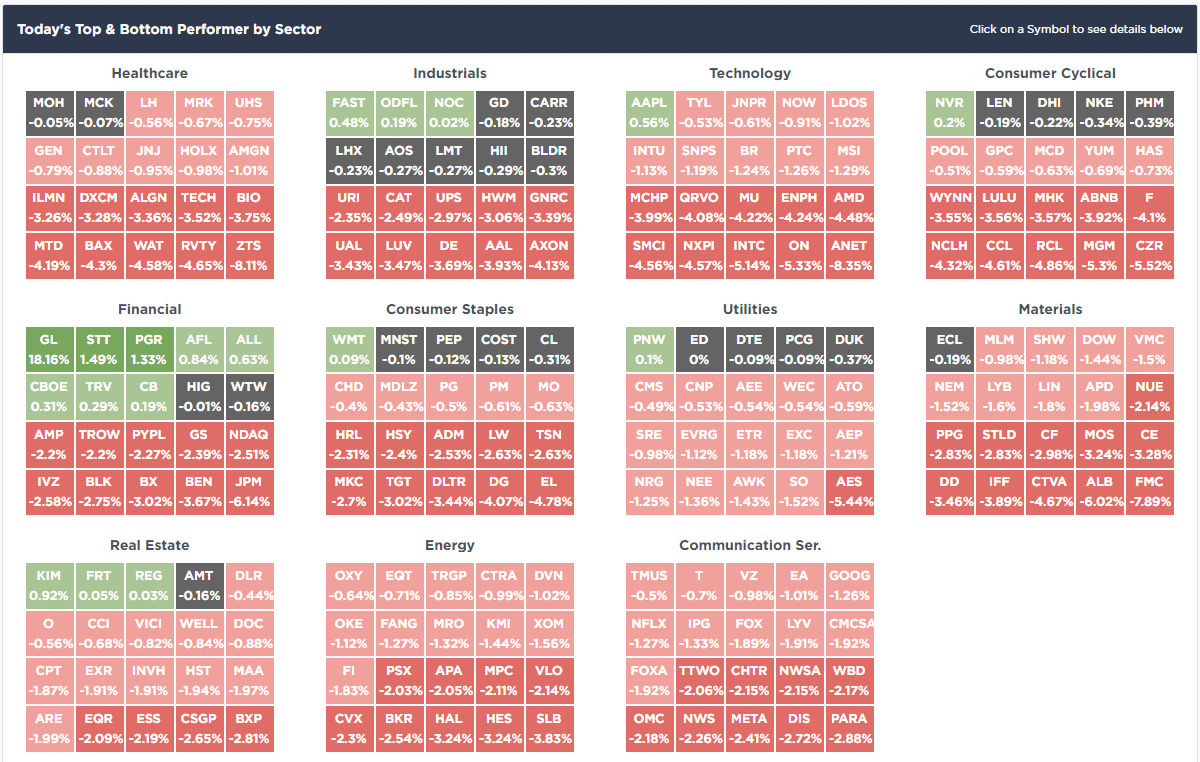
SimpleVisor Top & Bottom Performers By Sector
S&P 500 Weekly Tear Sheet

Relative Performance Analysis
Last week, we stated:
“Unfortunately, the market did not rally last week, but the deviations and oversold conditions only deepened further, which provides the fuel for a counter-trend rally. Use rallies to reduce risk and rebalance exposures for now until the overall technical footings significantly improve.”
As shown below, that rally came with a vengeance this past week, with the S&P and Nasdaq rallying near 6%, respectively. The markets are returning to short-term overbought conditions, so a bit of consolidation next week is likely. If you have been waiting for a rally to reduce risk or rebalance allocations, this is likely the best opportunity we will have over the next few days. Look for pullbacks to support if you want to add exposure to your portfolio for a year-end push.
Technical Composite
The technical overbought/sold gauge comprises several price indicators (R.S.I., Williams %R, etc.), measured using “weekly” closing price data. Readings above “80” are considered overbought, and below “20” are oversold. The market peaks when those readings are 80 or above, suggesting prudent profit-taking and risk management. The best buying opportunities exist when those readings are 20 or below.
The current reading is 50.01 out of a possible 100.
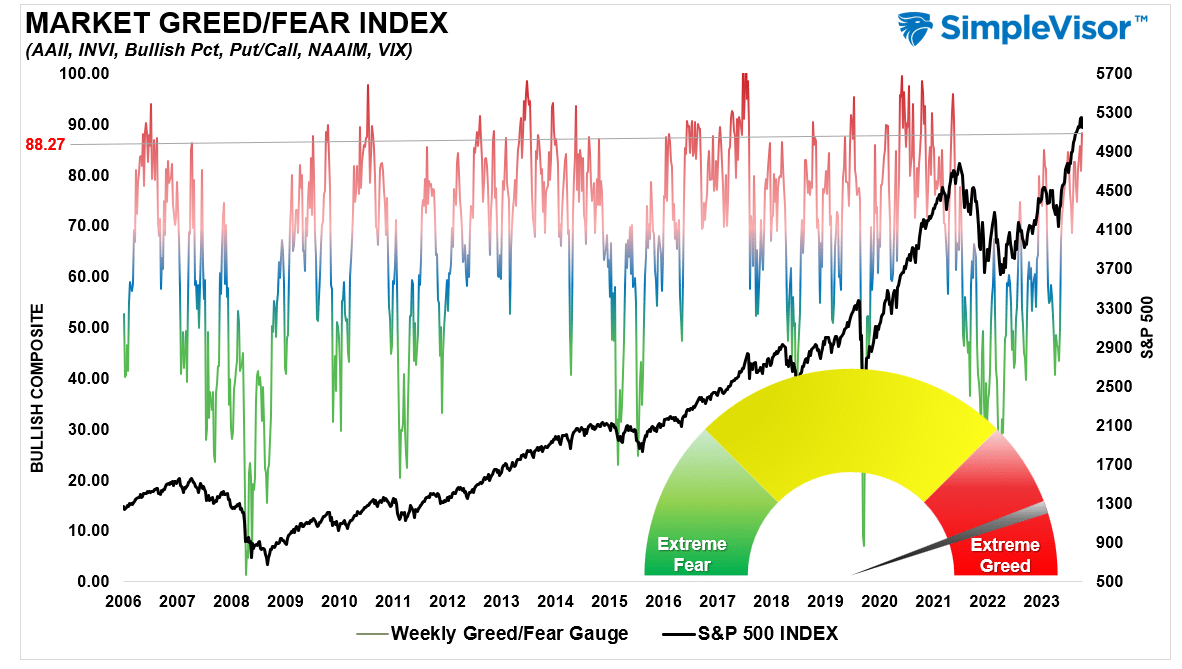
Portfolio Positioning “Fear / Greed” Gauge
The “Fear/Greed” gauge is how individual and professional investors are “positioning” themselves in the market based on their equity exposure. From a contrarian position, the higher the allocation to equities, the more likely the market is closer to a correction than not. The gauge uses weekly closing data.
NOTE: The Fear/Greed Index measures risk from 0 to 100. It is a rarity that it reaches levels above 90. The current reading is 42.13 out of a possible 100.
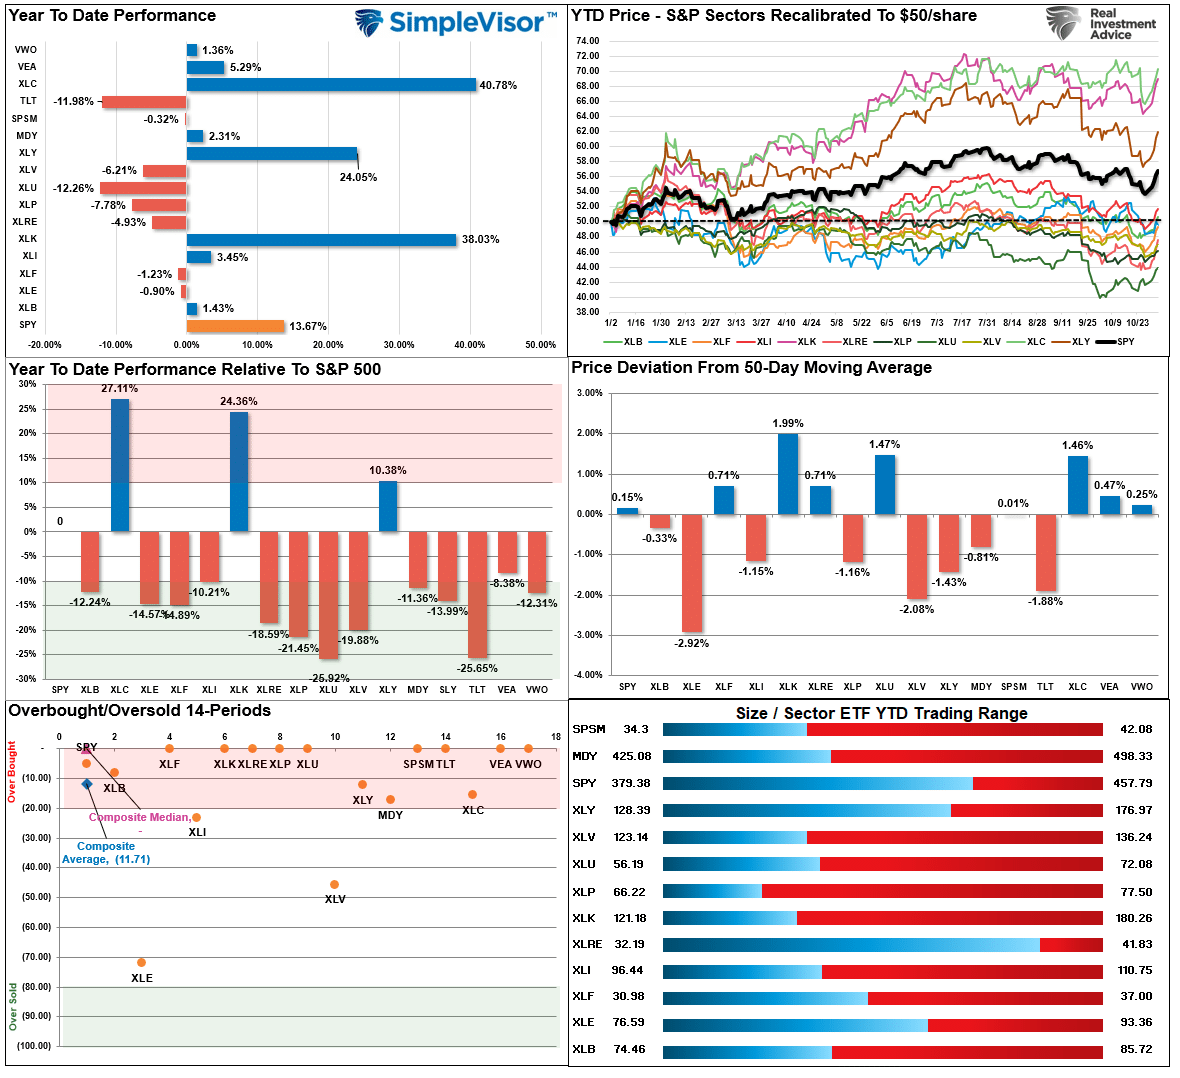
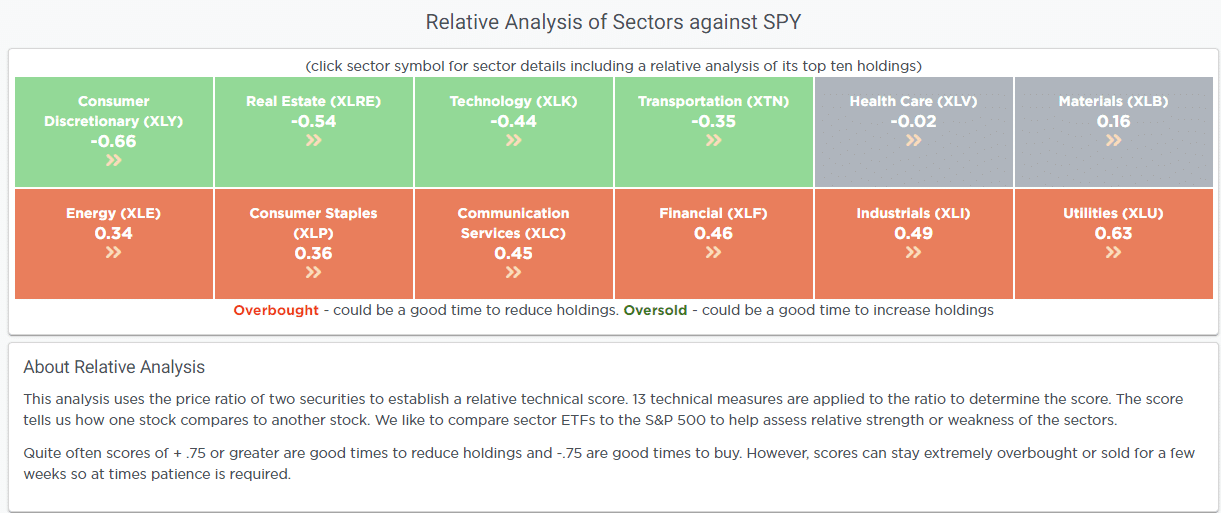
Relative Sector Analysis
Oversold Sector Analysis

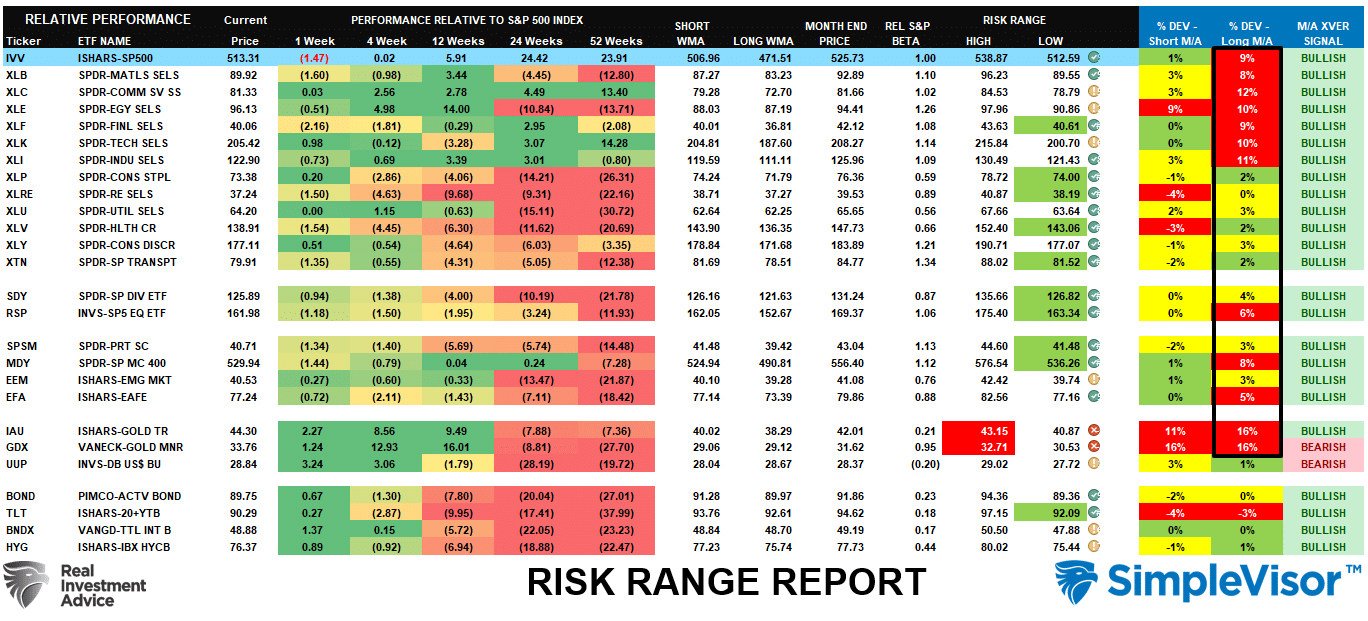
Sector Model Analysis & Risk Ranges
How To Read This Table
- The table compares the relative performance of each sector and market to the S&P 500 index.
- “MA XVER” (Moving Average Crossover) is determined by the short-term weekly moving average crossing positively or negatively with the long-term weekly moving average.
- The risk range is a function of the month-end closing price and the “beta” of the sector or market. (Ranges reset on the 1st of each month)
- The table shows the price deviation above and below the weekly moving averages.
As noted last week, “Most every other sector and market, including Bonds, are profoundly oversold and should see buying near-term, particularly as we head into year-end and portfolio managers need to rebalance holdings.” This past week, that buying showed up with a vengeance, pushing almost every major market and sector outside of normal monthly ranges. Consider taking profits and rebalancing holdings and use pullbacks to support to add to new or existing positions.
Weekly SimpleVisor Stock Screens
We provide three stock screens each week from SimpleVisor.
This week, we are searching for the Top 20:
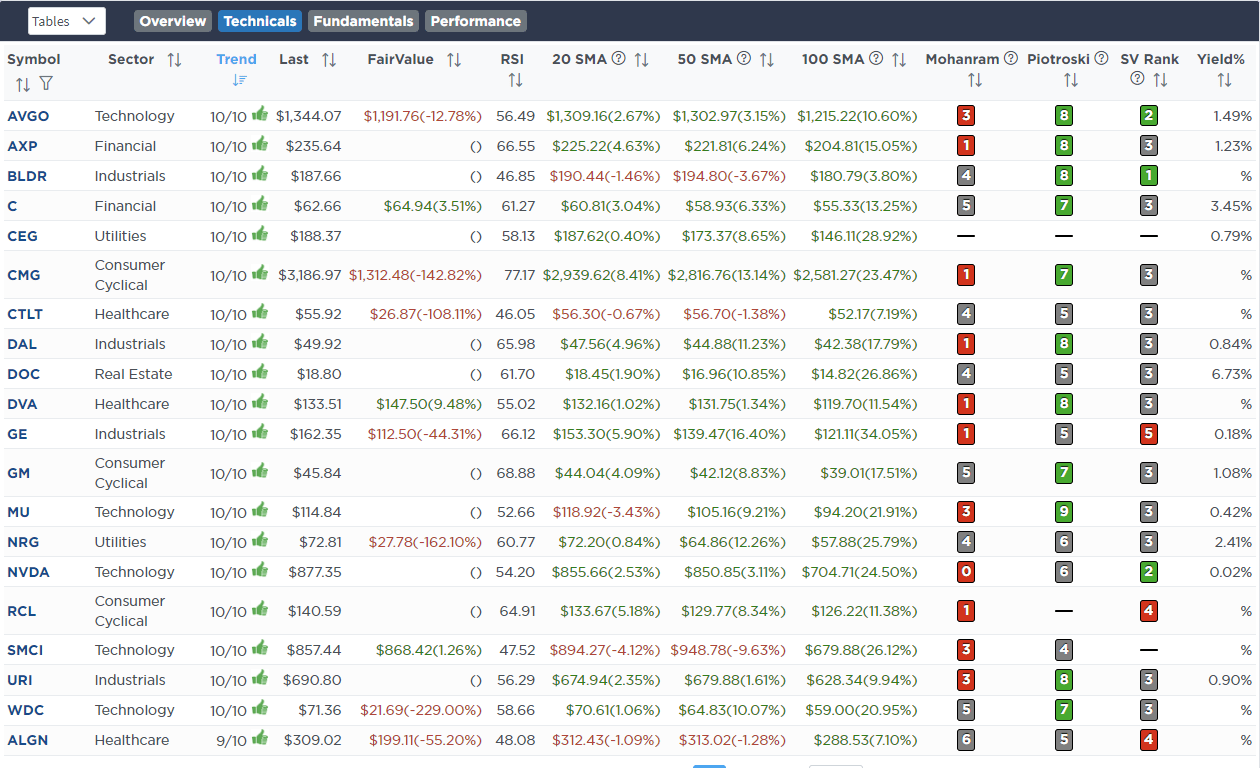
- Relative Strength Stocks
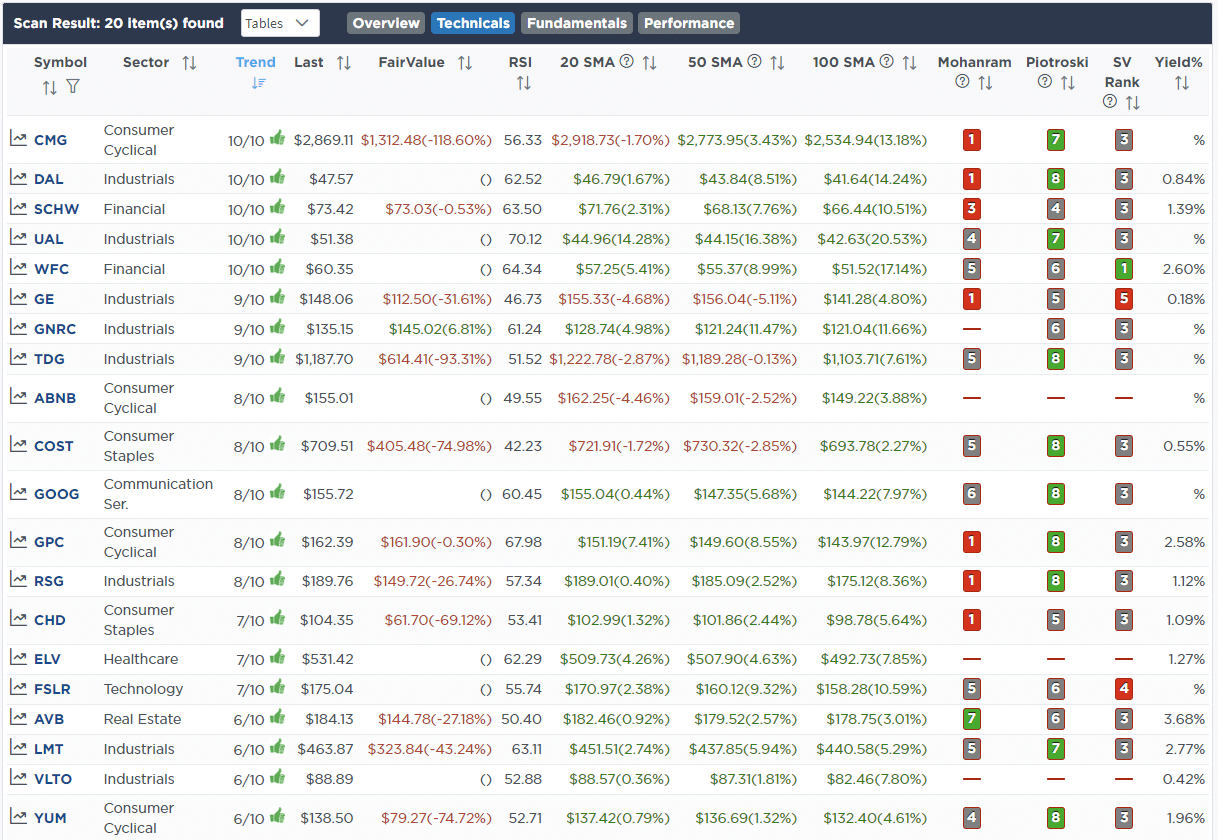
- Momentum Stocks
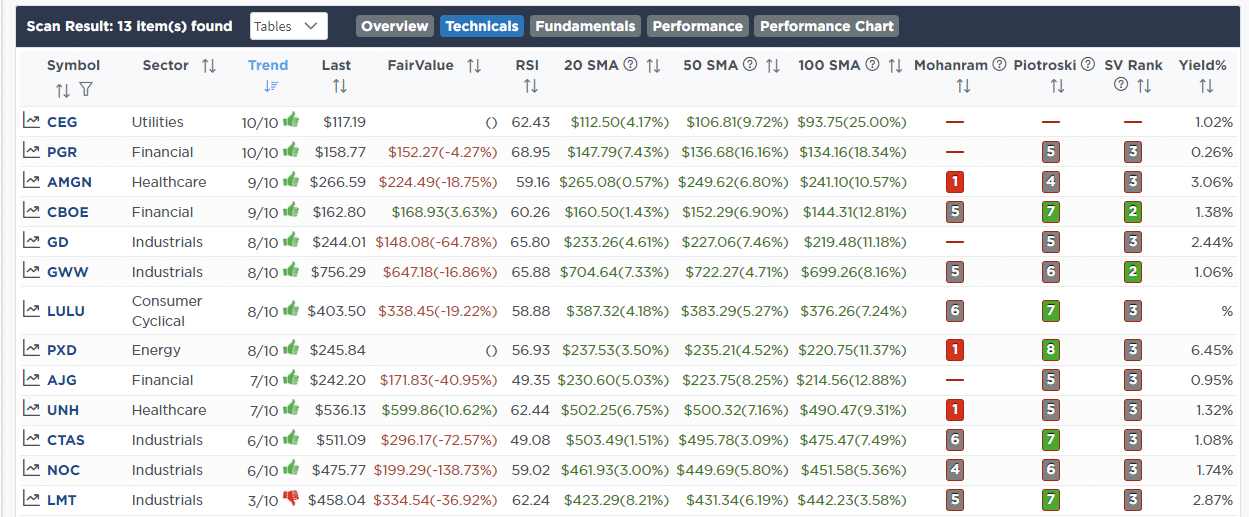
- Fundamental & Technical Strength
(Click Images To Enlarge)
R.S.I. Screen
Momentum Screen
Fundamental & Technical Strength
SimpleVisor Portfolio Changes
We post all of our portfolio changes as they occur at SimpleVisor:
Oct 30th
Trade Alert – Equity Model Only
“The drubbing in stocks this past week has opened up an opportunity to add to beaten-up holdings. Today, we are using the earnings-driven sell-off in Abbvie (ABBV) and Google (GOOG), both of which had strong earnings and revenue growth, to add to those stakes.
Technically, both are pretty washed out and should turn to buy signals shortly. With the additions, GOOG is now 3.5%, and ABBV is at our maximum holding of 5%.”
Equity Model
- Increase Abbvie (ABBV) to 5% of the portfolio.
- Increase Google (GOOG) to 3.5% of the portfolio.

Lance Roberts, C.I.O.
Have a great week!

