Bullish Markets And The End Of Bears


Inside This Week’s Bull Bear Report
- Fed’s Hawkish Pause Ignites The Bulls
- Bullish Markets And The End Of Bears
- How We Are Trading It
- Research Report – New Bull Market? It’s Different This Time.
- Youtube – Before The Bell
- Stock Of The Week
- Daily Commentary Bits
- Market Statistics
- Stock Screens
- Portfolio Trades This Week
Market Review & Update
This bullish market is getting harder to deny as many indicators continue to improve. Last week, we reviewed our previous commentary discussing that the break above resistance would suggest a continued move to our target of 4300.
“The S&P 500 has scored seven weekly closes above its 40-week moving average, which is a positive sign. In addition, the market has cleared the 40-week DMA downtrend line from January and December 2022, suggesting a potential bullish turn in the trend. Assuming supports hold, the next major resistance beyond the post-FOMC peak at 4195 is the August 2022 peak at 4325 (orange dashed line).” – March 7th
This past week, the FOMC opted to “skip” a rate hike to monitor the lag effect of their previous actions on the economy. To wit:
“Nearly all committee participants expect it will be appropriate to raise interest rates somewhat further by the end of the year. But at this meeting, considering how far and how fast we’ve moved, we judged it prudent to hold the target range steady. The committee will take into account the cumulative tightening of monetary policy, the lags with which monetary policy affects economic activity and inflation, and economic and financial developments.”
While the statement is hawkish and suggests that the Fed could hike rates further to combat inflation, the markets have dismissed the impact of every rate hike this cycle. The break above 4400 removed minor resistance and put 4535 as the next major Fibonacci resistance level. After that, it’s essentially the all-time high as the last major roadblock.
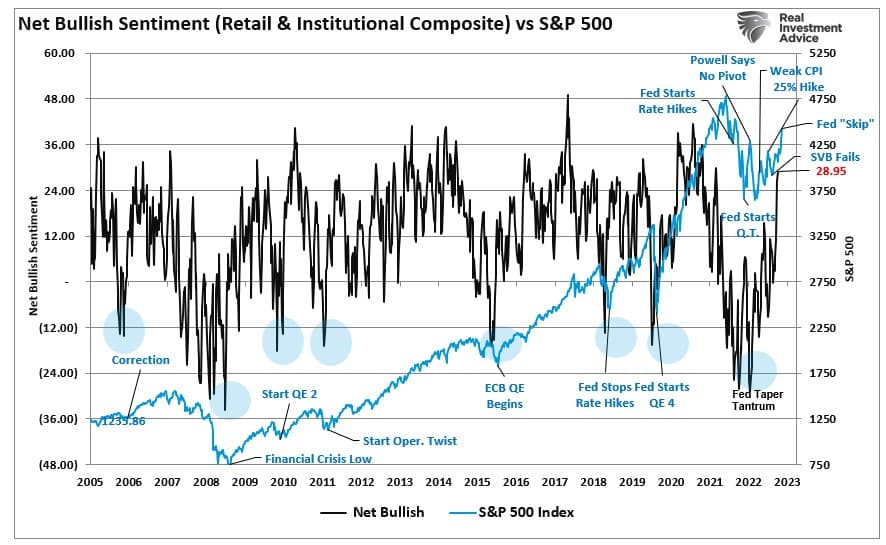
As noted on Tuesday, the rally has finally convinced the bears to come off the sidelines, with professional and retail investors getting substantially more “bullish” over the last two weeks.
As discussed previously, the Fed is in a difficult position as rising equity prices boost consumer confidence. With the Fed trying to reduce demand to cool inflation by tightening liquidity, rising stock market prices work against that agenda. Nonetheless, the market has found a new reason to be bullish on the “artificial intelligence” wave.
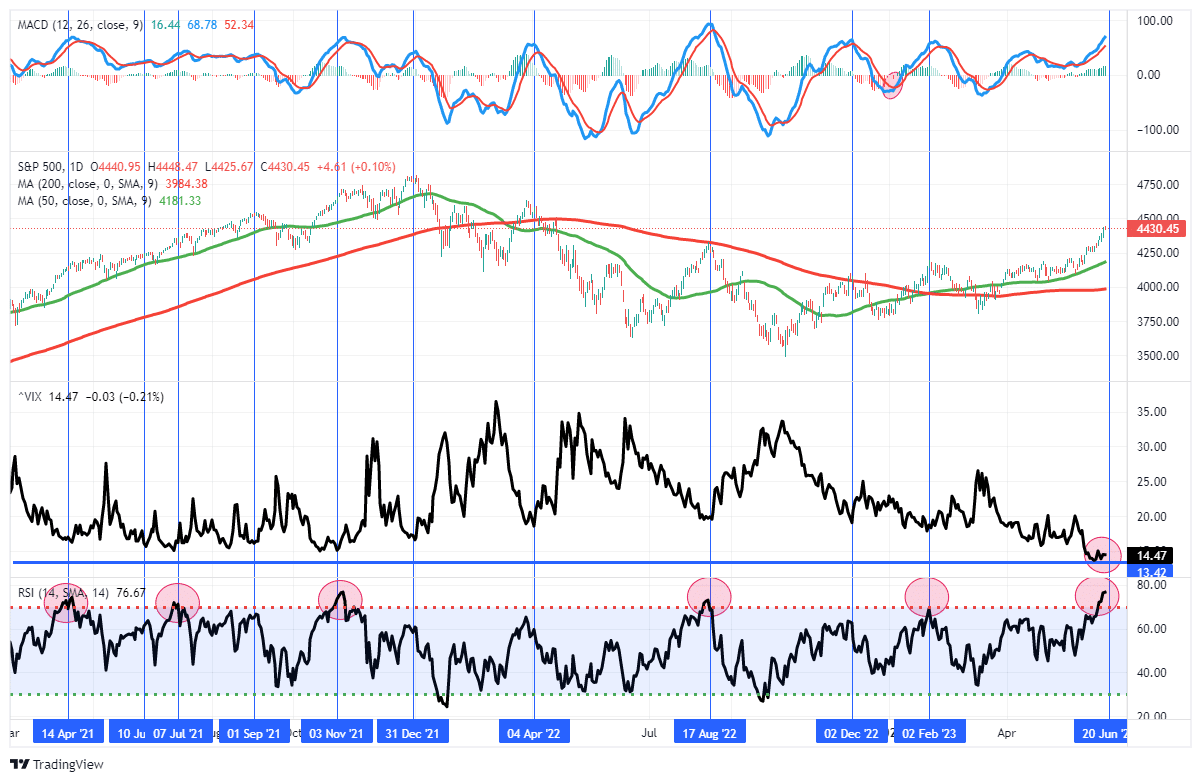
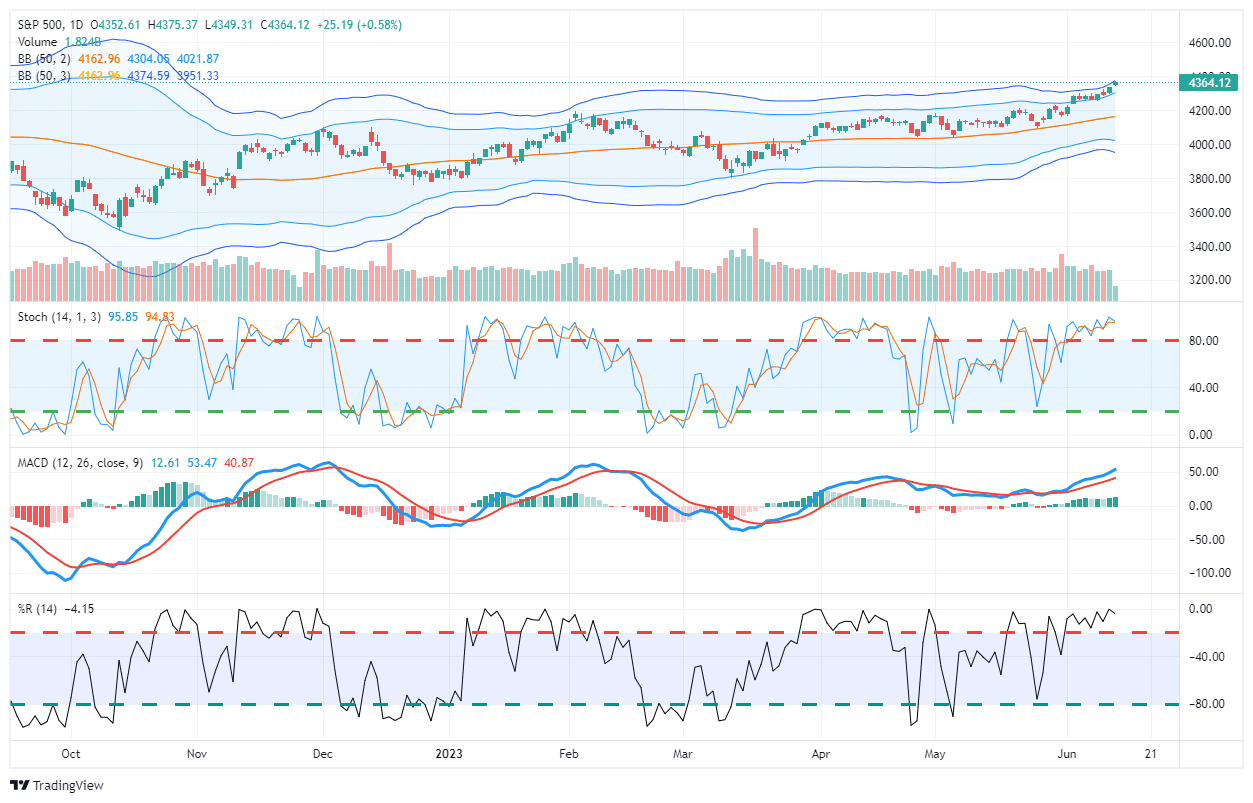
This past week, the market pushed well past our previous price target and is moving well into 3-standard deviations above the 50-DMA. Furthermore, the market is very overbought on multiple levels. Lastly, the volatility index is at extremely low levels, which has almost uniformly preceded corrections of 5-10% during both bull and bear markets.
However, what does that mean? While there are many reasons to be bearish, the bullish market environment suggests that such concerns are fading. For now, bullish market technicals appear to remain intact, and pullbacks are likely buying opportunities short term. However, I want to start with a section from yesterday’s #MacroView blog on the differentiation between “bear markets” and “corrections.”
Need Help With Your Investing Strategy?
Are you looking for complete financial, insurance, and estate planning? Need a risk-managed portfolio management strategy to grow and protect your savings? Whatever your needs are, we are here to help.

Bear Markets Versus Corrections
We previously discussed that the 2020 and 2022 declines were not “bear markets.”
Instead, they were “corrections” within an ongoing bull market. To wit:
“What defines a bear market? To answer that question, let’s agree on a basic definition.“
- A bull market is when the market price trends higher over a long-term period.
- A bear market is when the previous positive trend breaks and prices trend lower.
“The chart below provides a visual of the distinction. When looking at price “trends,” the difference becomes apparent and valuable.“
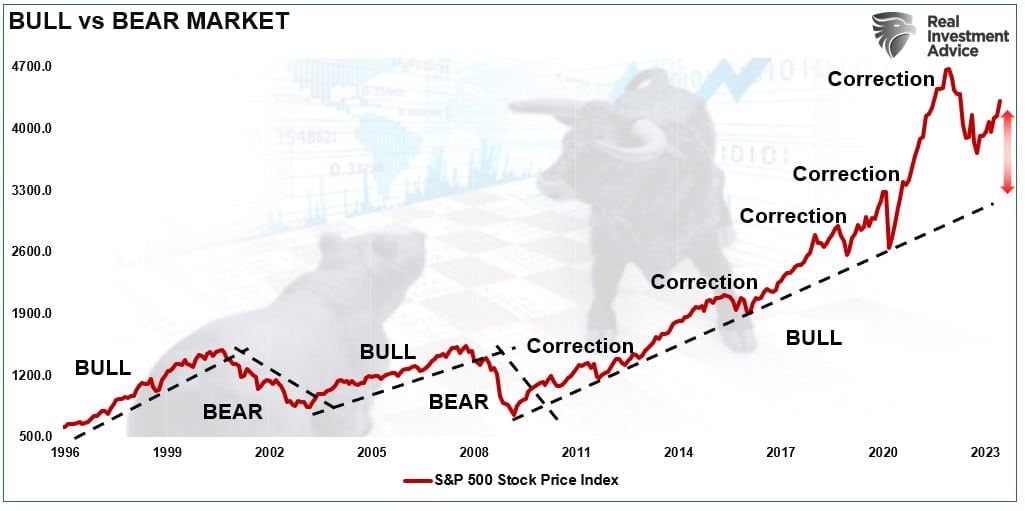
This distinction is essential to understanding the difference between “corrections” and “bear markets.”
- “Corrections” occur over short time frames, do not break the prevailing trends, and quickly resolve by reversing to new highs.
- “Bear Markets” are long-term affairs where prices grind sideways or lower over long periods as valuations revert.
The price decline in March 2020 was unusually swift using monthly closing data. However, that decline did not break the long-term bullish trend. It also quickly reversed to new highs, suggesting it was a “correction.”
Likewise, the decline in 2022 did not significantly test the long-term uptrend or revert valuations. Such also suggests it was a correction and not a bear market.
In both cases, the market was so stretched above the long-term bullish uptrend those 20% plus corrections were needed to reverse those deviations. The decline was not significant enough to break the bullish rising price trends.
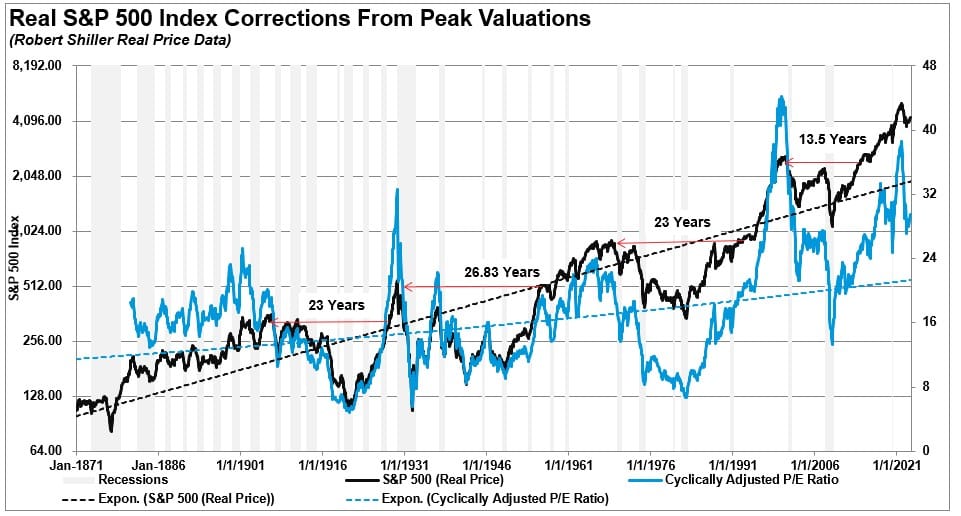
It is hard to suggest that we are in a “bear market” when the bullish price trend from the 2009 lows remains intact. But history also suggests that the bullish market backdrop has historically denoted the end of bear markets.
Bullish Markets And The End Of Bears
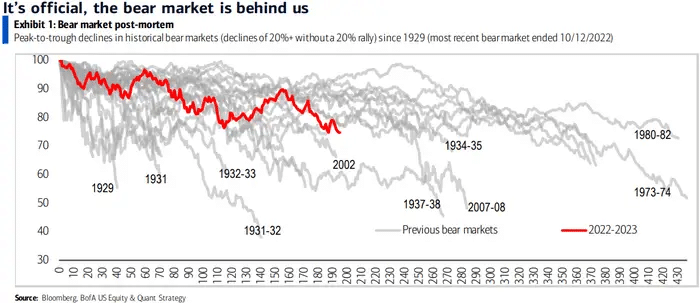
While it may seem that a bear market won’t end in the short term, they do. Below is a table and chart of bear markets back to 1900.
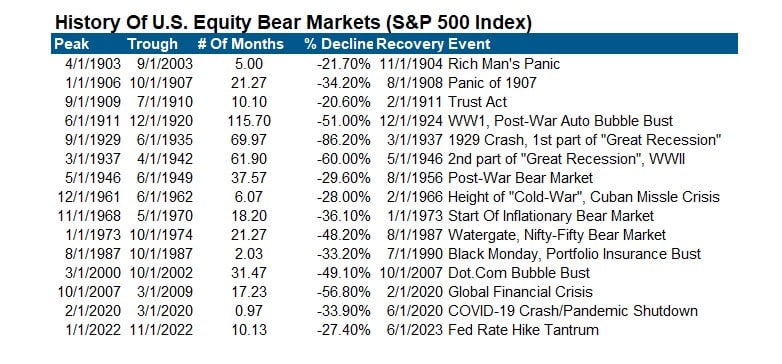
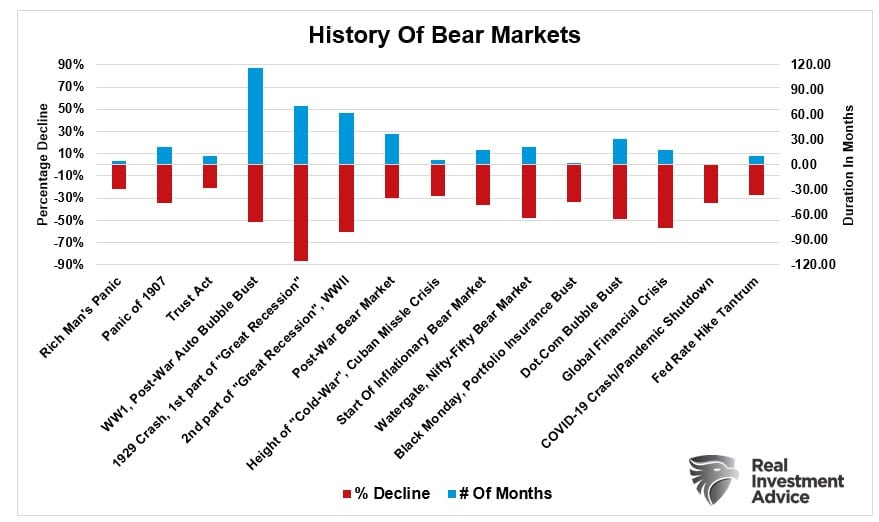
The end of these bear markets was often confirmed by the market hitting a new 52-week high. Such occurred last week, with the market hitting that mark after 300 days. That is the longest stretch without a 52-week high since the “Financial Crisis.” Notably, previous 300-day stretches have a high percentage of favorable future returns.
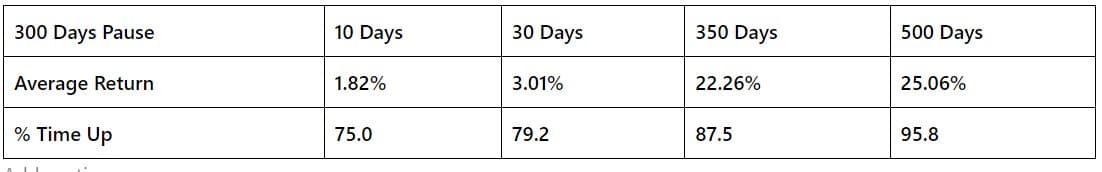
However, such does NOT preclude a short-term correction of 5-10% along the way.
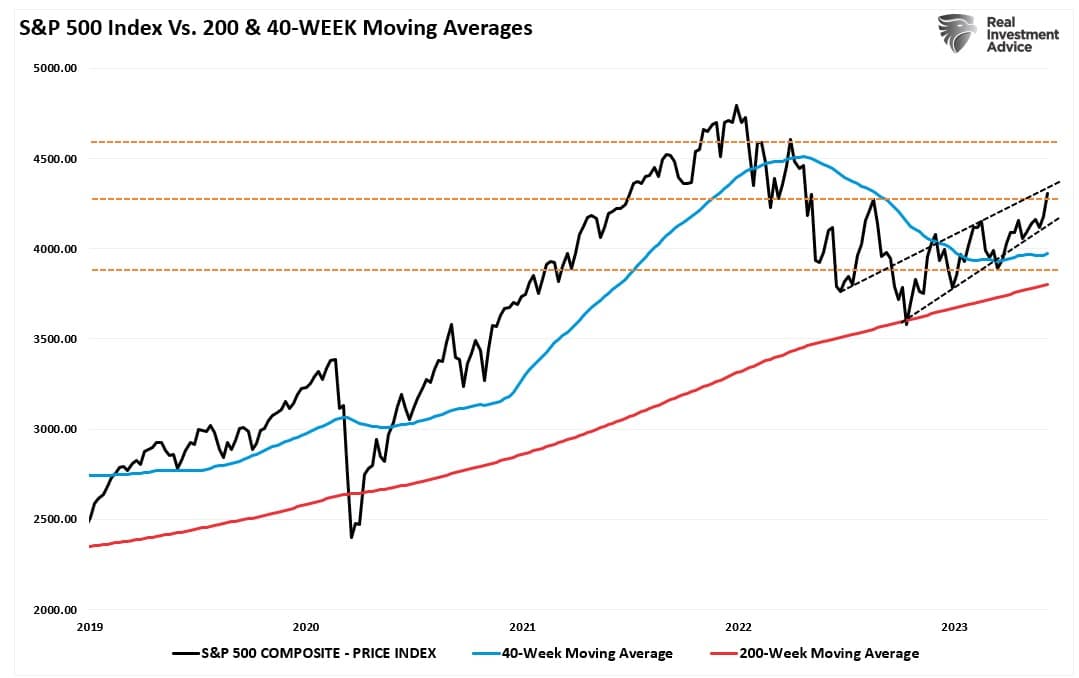
Does such a statement preclude that market from returning to a bear market? Absolutely not. While such an outcome is certainly possible, statistically, it is more improbable. The chart below shows the S&P 500 index versus its 50-WEEK moving average (WMA) and the 200-WMA.
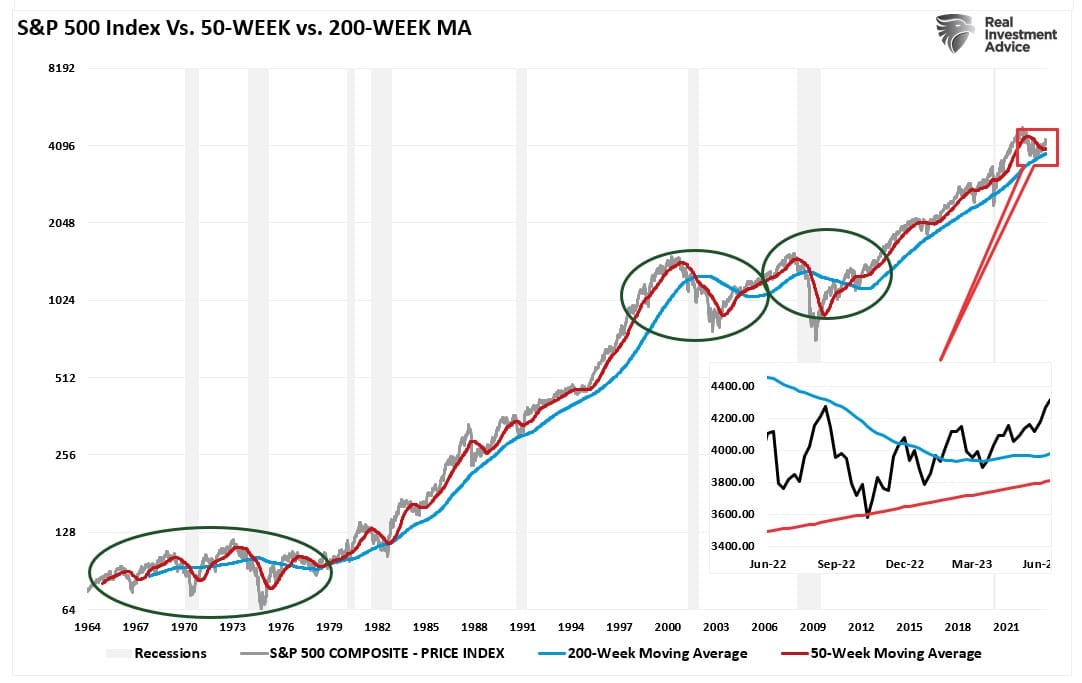
There are two critical points to note. Firstly, “bear markets” occur when the stock market violates the 200-WMA, which tends to act as a bullish trend. Secondly, bear markets were previously confirmed by the 50-WMA crossing below the 200-WMA.
Notably, bullish markets were confirmed by stocks trading above the 50-WMA and the 50-WMA above the 200-WMA. While there are many reasons to be concerned about the current economic environment, the market has remained in a “technical bull market” since 2009. With the market now trading above the 50-WMA and those moving averages trending higher, the bullish market dynamics suggest that the bear market risk is over for now.
Rotation May Broaden The Bull
With sentiment improving and positioning moving from bearish to bullish, the support for higher prices and limited pullbacks remain.
As discussed last week, the market is due for a rotation from leaders to laggards. (Read for more discussion on sector rotation analysis.) Such was a point made by Savita Subramanian at BofA. To wit:
“The obvious beneficiaries, capex takers, are semis and select software companies that can provide AI services. But not all Tech wins. Many need to spend just to remain competitive. The larger benefit may be had by old economy, inefficient companies that can increase earnings power more permanently from efficiency and productivity gains.”
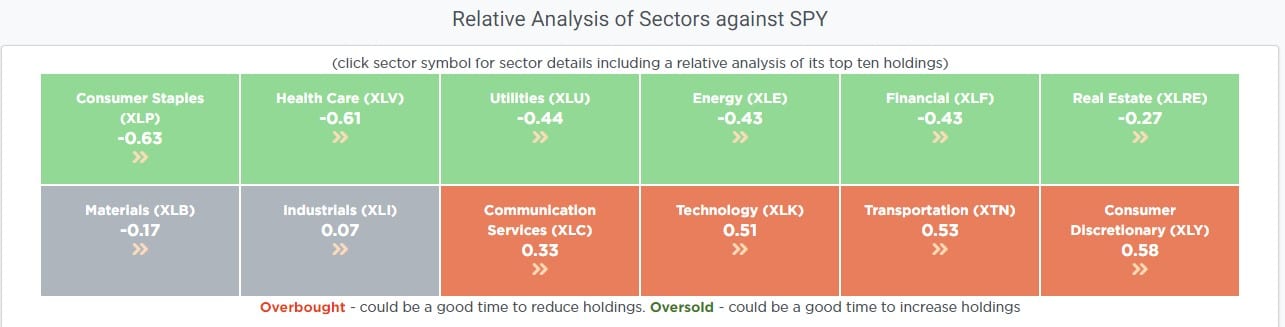
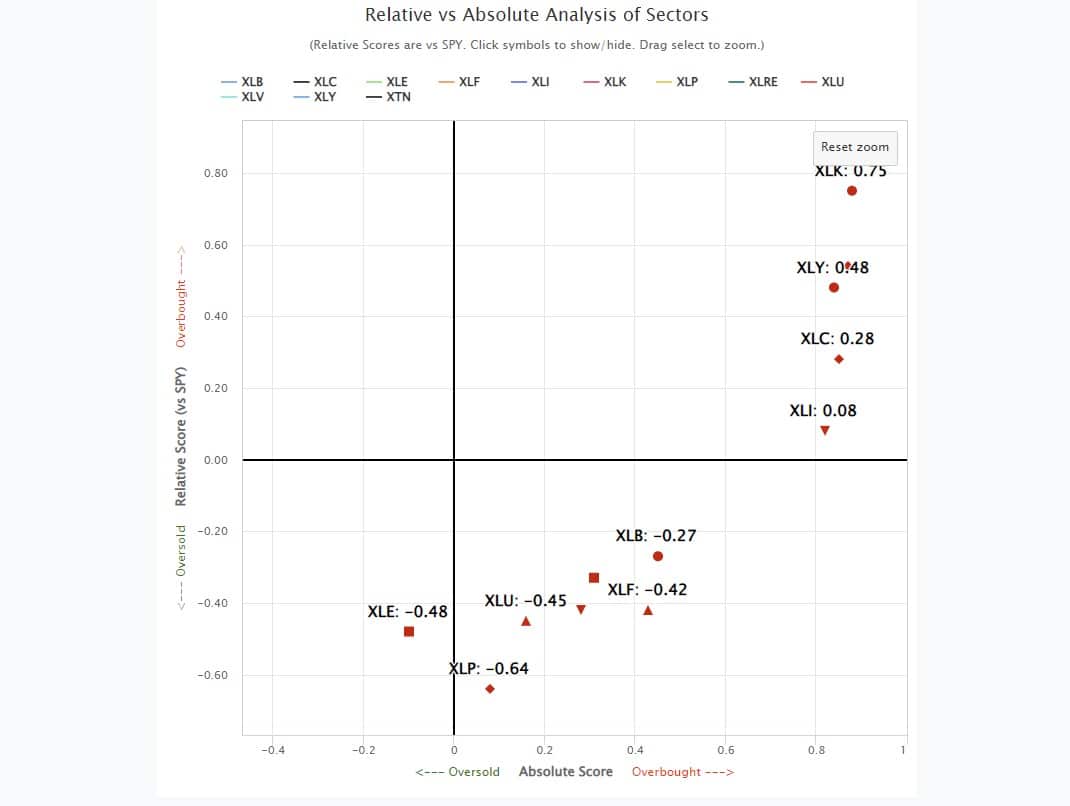
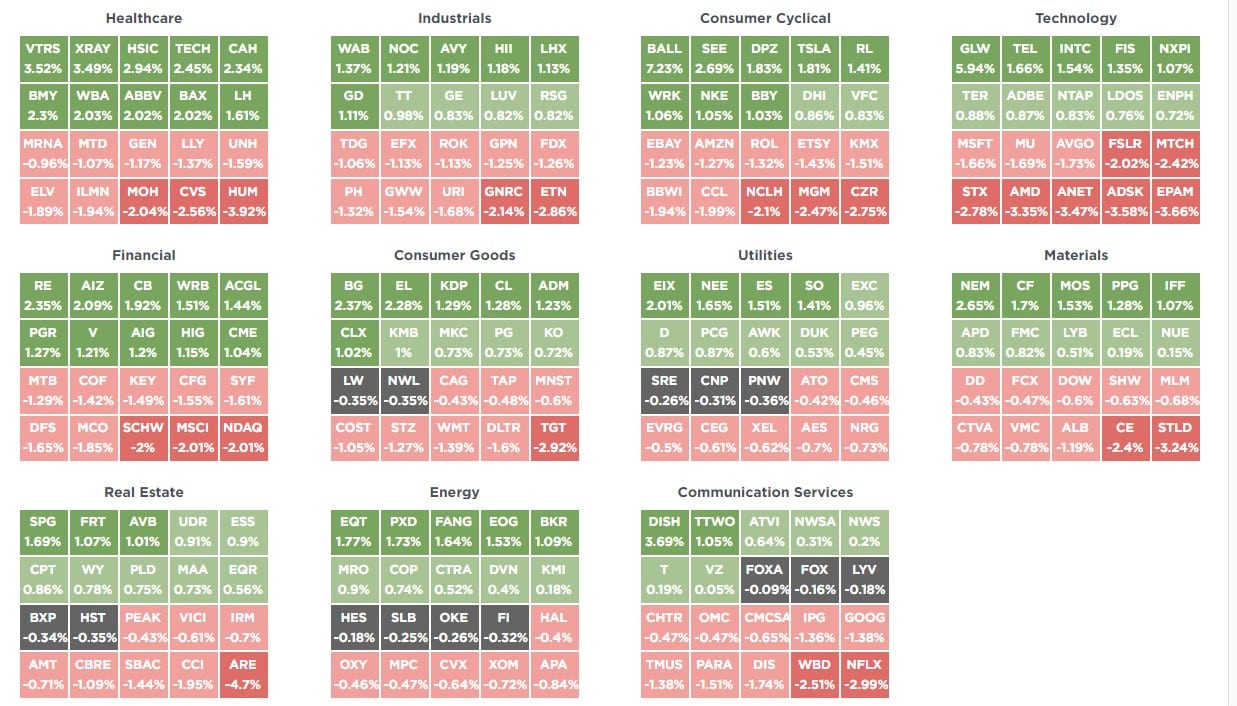
That rotation did pick up this past week, with money moving from some of the recent winners into more defensive and “unloved” sectors. Note: This analysis is available daily at SimpleVisor.com
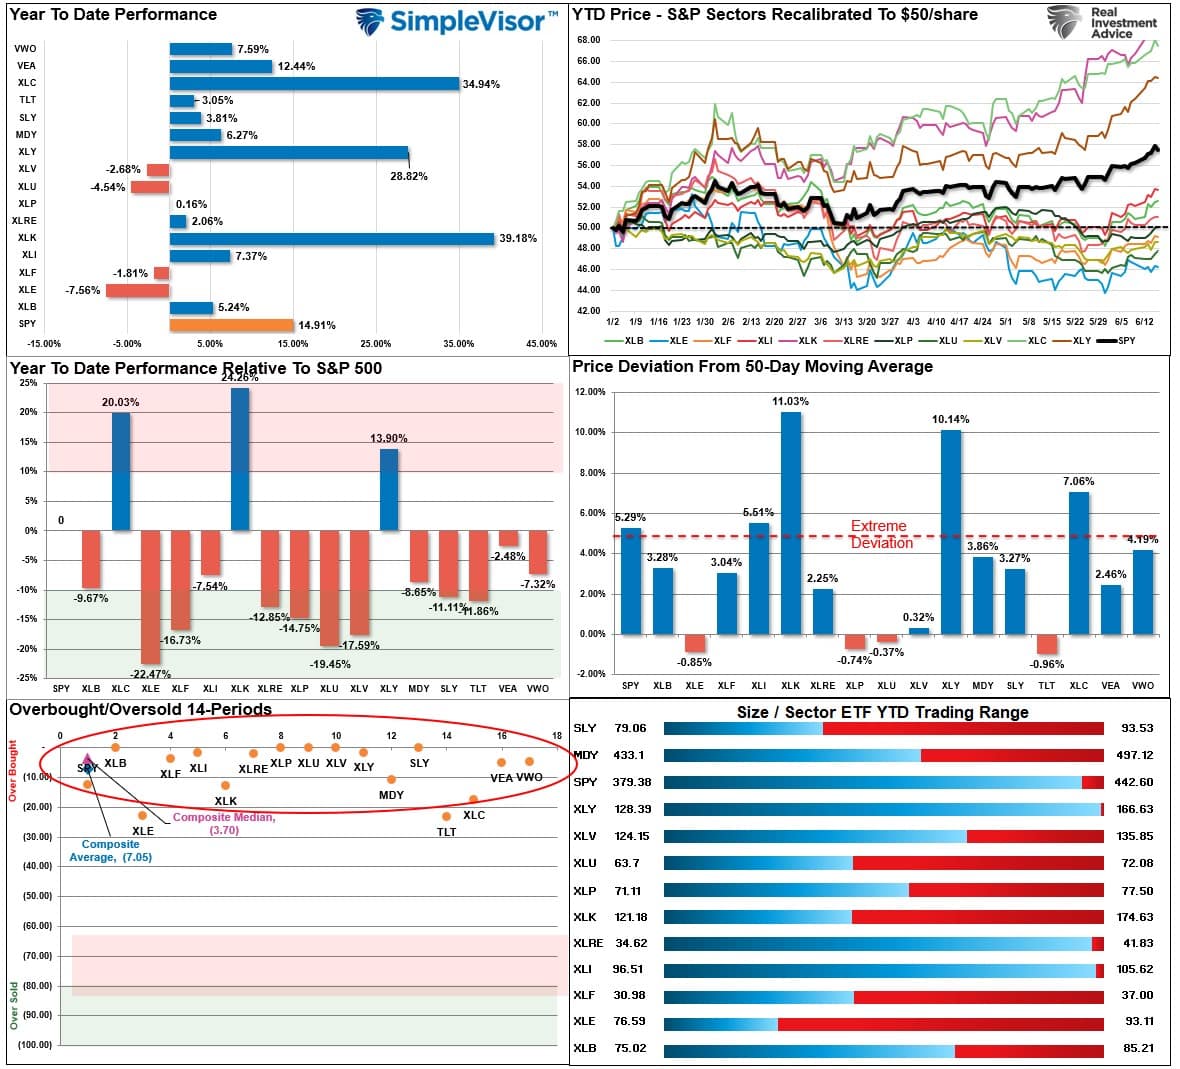
“We can look at the year-to-date performance chart above with this basic understanding of rotations. It should be evident that such huge gains in Technology, Discretionary, and Communications in the first half of this year are unsustainable. As such, it is logical that market participants will eventually seek out investments with more potential upside in the short term.”
Over the past two weeks, most sectors, except for staples, have improved performance. While Technology, Discretionary, and Communications are still leading the charge, other sectors have seen improvement, with the overall breadth of the market beginning to broaden. If this bullish market is going to continue, broader breadth is a requirement.
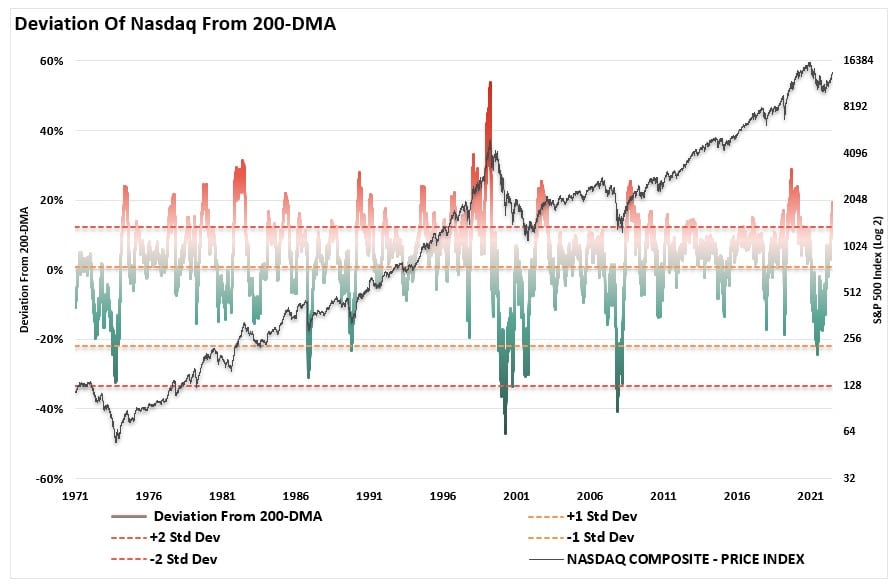
However, as noted, while the market suggests the bull market has resumed after last year’s correction, such does not preclude further corrections in the future. As mentioned in Friday’s blog post, the Nasdaq, in particular, is trading nearly 20% above its 200-DMA.
Furthermore, the S&P 500 index trades well into the 3-standard deviation territory above its 50-DMA. The index is also highly overbought on multiple measures.
Such suggests that a 5-10% correction is possible and probable. As noted, those corrections will be buying opportunities as long as the bullish market trend remains intact.
For now, the bear market is over.
How We Are Trading It
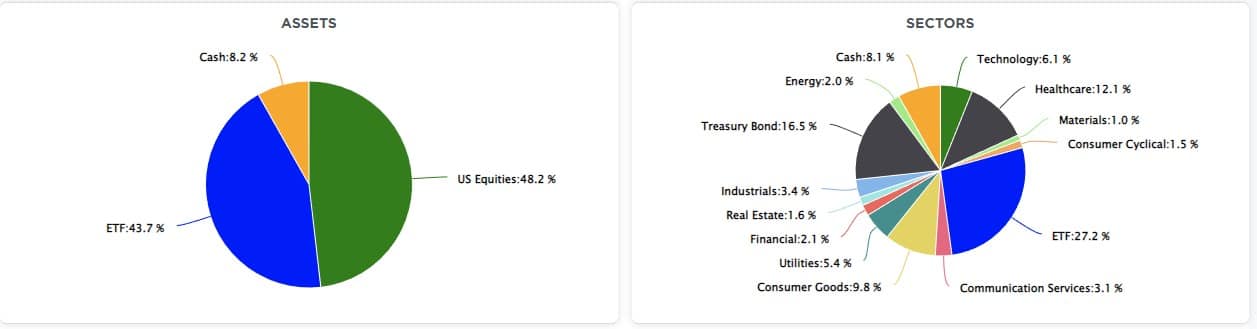
“Overall, we continue to make tiny moves to align the risk profile of portfolios to the market. Given the recent buy signals from our indicators, we cautiously added needed exposure. However, we remain underweight in equities and overweight cash currently. The improvement in the overall price action confirms that downside risk is somewhat limited in the current environment.”
We continued to see a bit more rotation this past week as small caps continued to pick up the pace. This week, we rebalanced our Healthcare sector, reducing insurers and adding medical devices. We had previously added to our staples position for this rotation as well. We are more heavily weighted toward defensive stocks, which got some attention this past week. However, we will opportunistically use pullbacks in the cyclical stocks to add further weight to that sector.
While this has been a tough market to navigate this year, the risks remain prevalent despite the broader market seemingly ignoring them.
As a contrarian investor, excesses get built by everyone on the same side of the trade. Previously, everyone was so bearish that the bullish trade higher was inevitable. As Sam Stovall, the investment strategist for Standard & Poor’s, once stated:
“If everybody’s optimistic, who is left to buy? If everybody’s pessimistic, who’s left to sell?”
Regardless of your personal views, the bull market that started in October remains intact. Therefore, we must continue to follow the investment rules practiced by the greatest investors in history.
- Cut Losers Short And Let Winners Run.
- Investing Without Specific End Goals Is A Big Mistake.
- Emotional And Cognitive Biases Are Not Part Of The Process.
- Follow The Trend.
- Don’t Turn A Profit Into A Loss.
- Odds Of Success Improve Greatly When Technical Analysis Supports Fundamental Analysis.
- Try To Avoid Adding To Losing Positions.
- In Bull Markets, You Should Be “Long.” In Bear Markets – “Neutral” Or “Short.”
- Invest First with Risk in Mind, Not Returns.
- The Goal Of Portfolio Management Is A 70% Success Rate.
There are plenty of reasons to be very concerned about the market over the next few months. However, markets can often defy logic in the short term despite the apparent weight of evidence to the contrary.
Have a great week.
Research Report

Subscribe To “Before The Bell” For Daily Trading Updates (Formerly 3-Minutes)
We have set up a separate channel JUST for our short daily market updates. Please subscribe to THIS CHANNEL to receive daily notifications before the market opens.
Click Here And Then Click The SUBSCRIBE Button
Subscribe To Our Youtube Channel To Get Notified Of All Our Videos
Stock Of The Week In Review
Last week’s screen was based on the preferred factors that infamous investor Peter Lynch used. This week we move on to Warren Buffet. Not only do we rank stocks based on a handful of Buffet’s preferred fundamental factors, but we do so on the 47 stock holdings in his portfolio holding company Berkshire Hathaway.
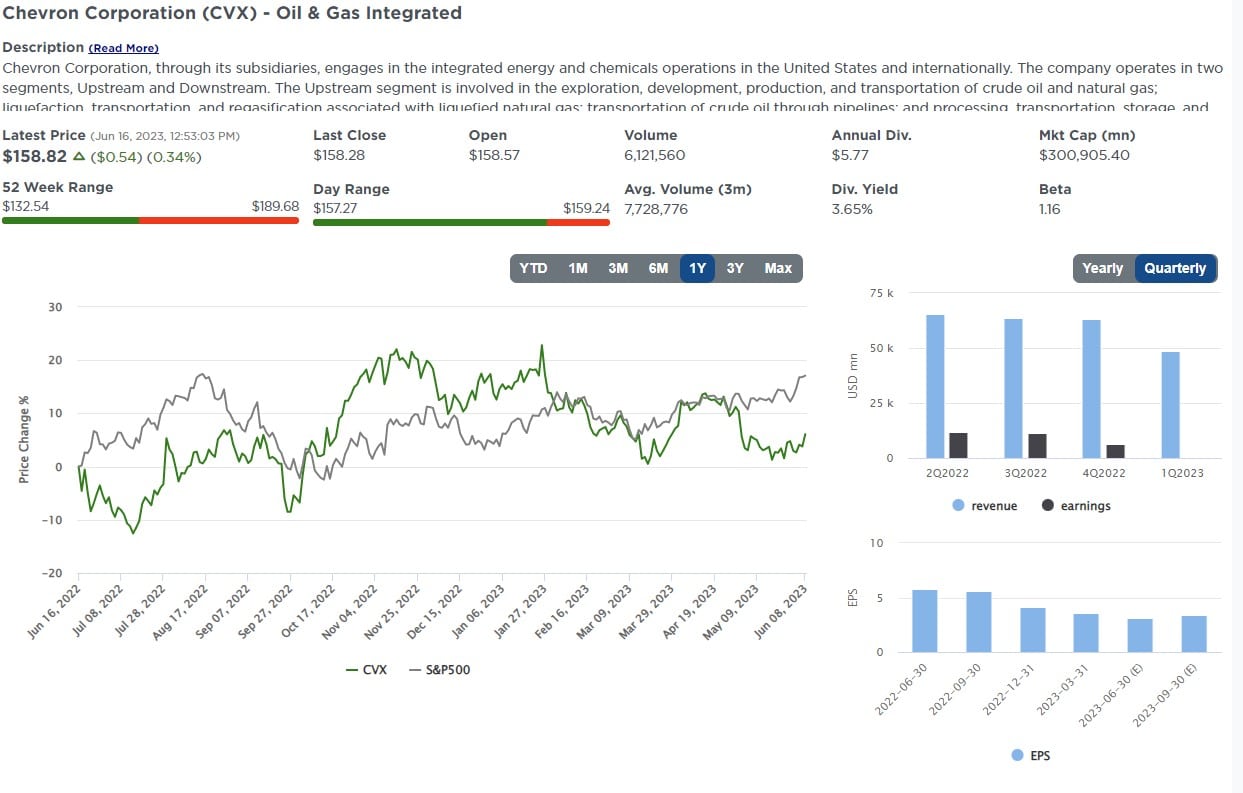
Apple comprises over half of Berkshire’s holdings, and 30 of its 47 stocks constitute less than half a percent of its portfolio. Of the stocks that ranked in the top five of this screen, only one, Chevron (CVX – 6.65%), has a meaningful contribution to the portfolio.
Login to Simplevisor.com to read the full 5-For-Friday report.
Daily Commentary Tidbits
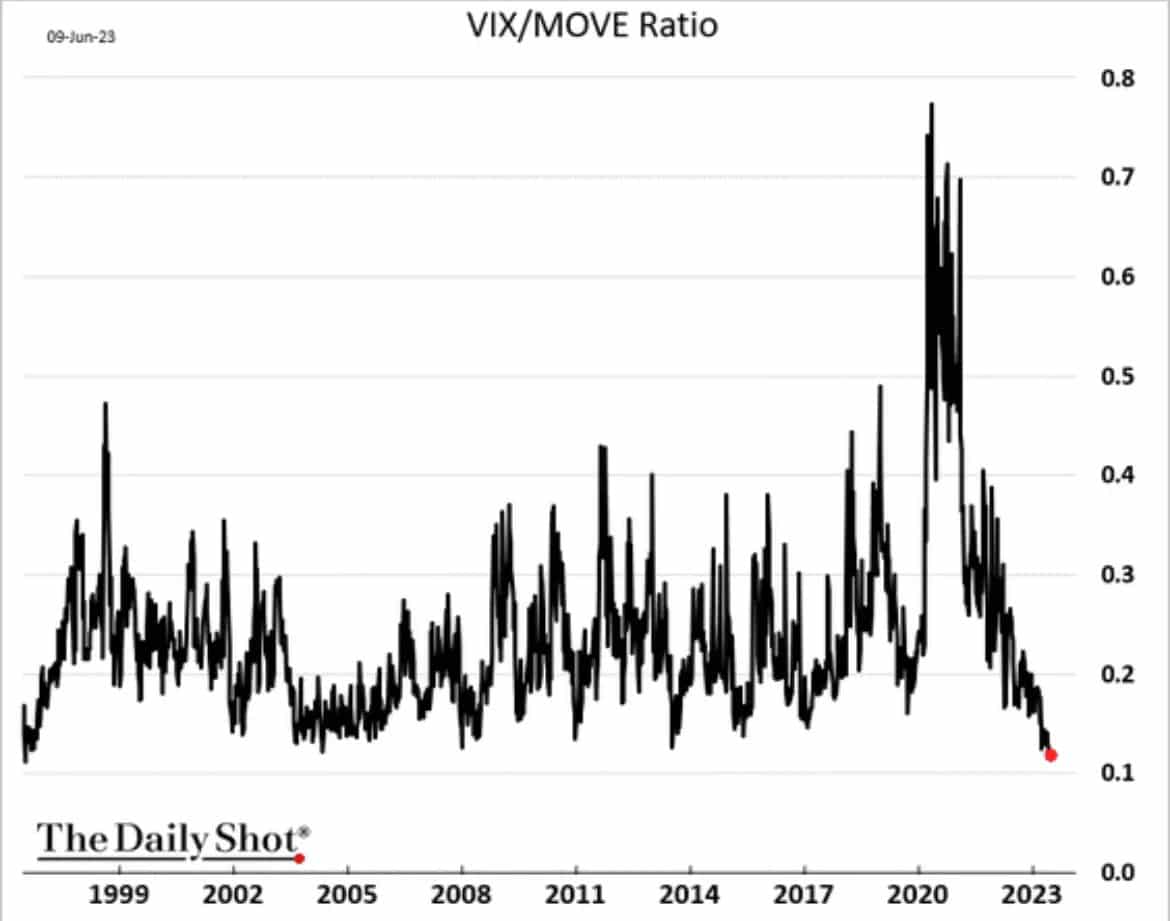
VIX and MOVE – A Tale Of Two Markets
Implied volatility in the stock (VIX) and bond markets (MOVE) tell an unusual tale of investor sentiment. Implied volatility uses options contracts to measure the expected price movement of a security or index. The ratio of the VIX to the MOVE index is at its lowest level in 27 years. Such tells us that bond traders expect significant volatility in the future in bond yields, while stock investors are relatively complacent. The VIX, currently at 14, is well below its 30+ year average of 19.7. It is also below levels preceding the pandemic. Unlike the complacent VIX, the MOVE index is at 116, about 15% above the recent average and nearly double its longer-term average.
So why does the MOVE index voice concern that interest rates will be volatile, while the VIX shows investors don’t seem to care? For starters, the MOVE tends to run about 3x higher than the VIX as yield changes on a percentage basis are more volatile than stock prices. Further, realized, or actual volatility, has been much higher in bonds than stocks. Stock and bond investors may believe the status quo in both markets will continue. However, given the economy is powered by debt, the level of interest rates is a crucial factor in determining economic activity. When yields are unpredictable, as the MOVE alludes, the ability to forecast stock earnings, debt costs, and valuations is more complicated. The VIX/MOVE ratio will likely converge back to normal levels. Will the VIX catch up to MOVE, or will the Fed calm bond markets this Wednesday, allowing MOVE to normalize?
(Subscribe To The Daily Market Commentary For A FREE Pre-Market Email)
Bull Bear Report Market Statistics & Screens

SimpleVisor Top & Bottom Performers By Sector
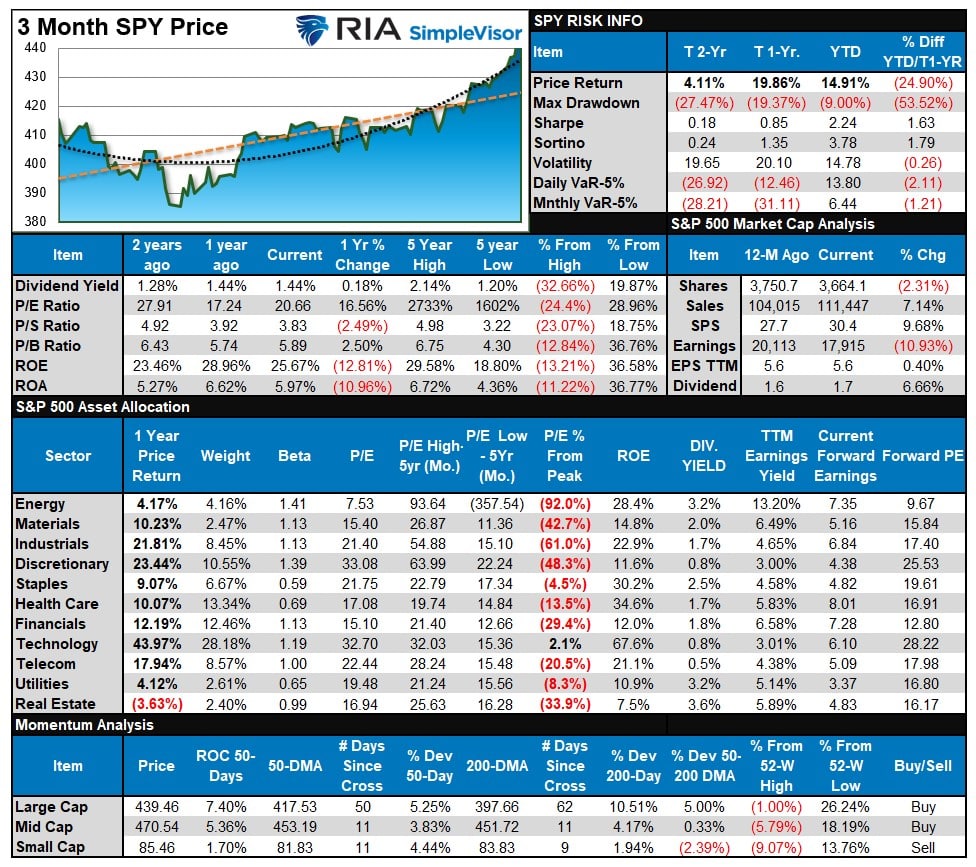
S&P 500 Weekly Tear Sheet
Relative Performance Analysis
As noted last week, the market is broadly overbought and needs a pullback after last week’s surge, and most sectors are now stretched above their moving averages. Performance is still highly bifurcated between Technology, Communications, Discretionary, and everything else.
That remains the case this week, and large swaths of the market are very overbought after last week’s push higher. What will cause the market to correct is unknown. However, quarter-end rebalancing is approaching, which could bring some selling into the market.
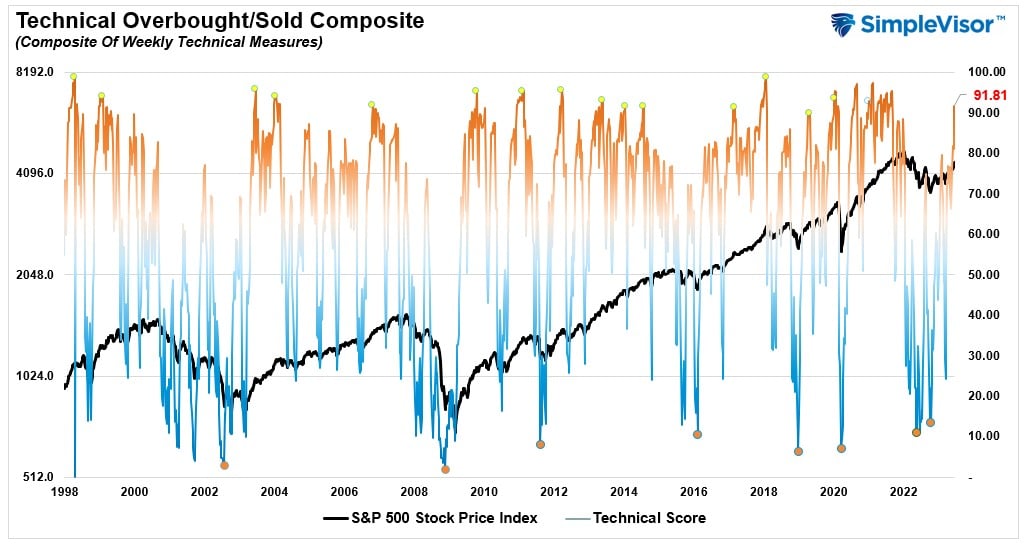
Technical Composite
The technical overbought/sold gauge comprises several price indicators (R.S.I., Williams %R, etc.), measured using “weekly” closing price data. Readings above “80” are considered overbought, and below “20” are oversold. The market peaks when those readings are 80 or above, suggesting prudent profit-taking and risk management. The best buying opportunities exist when those readings are 20 or below.
The current reading is 91.81 out of a possible 100.
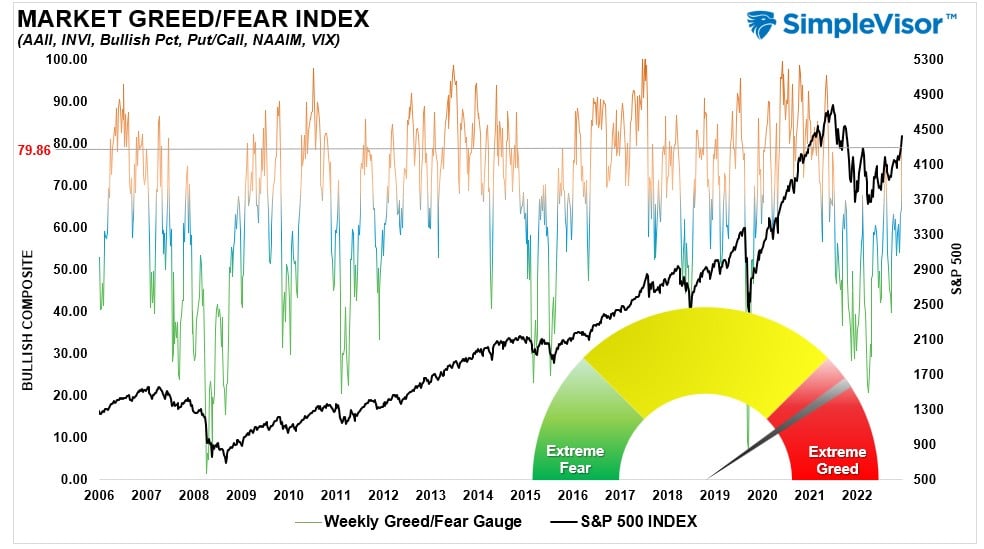
Portfolio Positioning “Fear / Greed” Gauge
The “Fear/Greed” gauge is how individual and professional investors are “positioning” themselves in the market based on their equity exposure. From a contrarian position, the higher the allocation to equities, the more likely the market is closer to a correction than not. The gauge uses weekly closing data.
NOTE: The Fear/Greed Index measures risk from 0 to 100. It is a rarity that it reaches levels above 90. The current reading is 79.86 out of a possible 100.
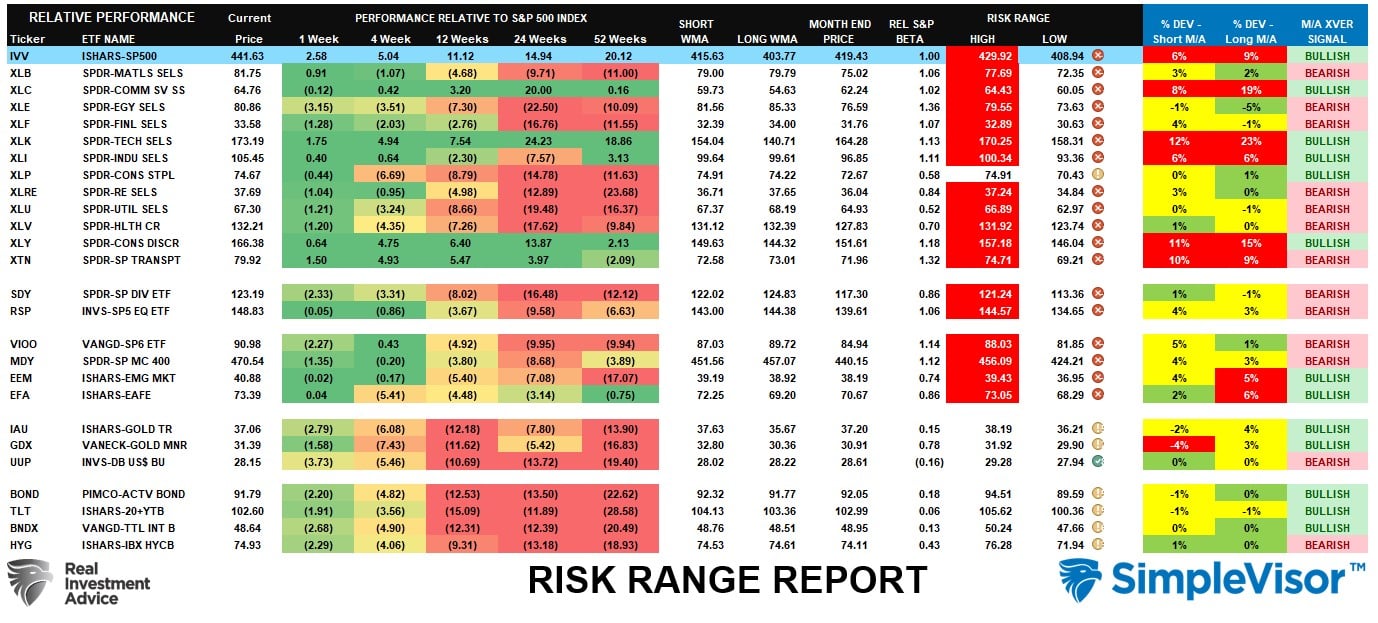
Sector Model Analysis & Risk Ranges
How To Read This Table
- The table compares the relative performance of each sector and market to the S&P 500 index.
- “MA XVER” (Moving Average Cross Over) is determined by the short-term weekly moving average crossing positively or negatively with the long-term weekly moving average.
- The risk range is a function of the month-end closing price and the “beta” of the sector or market. (Ranges reset on the 1st of each month)
- The table shows the price deviation above and below the weekly moving averages.
Last week’s push to 4400 has pushed most sectors into more extreme overbought levels for the month. Combined with very overbought readings in our technical gauge above, the market is due for a pullback. This seems more like a panicked move to gain allocation to a market by managers, which may be short-lived. We have started to see a bit of a rotation from cyclical to defensive sectors, which could be an early warning for corrective action.
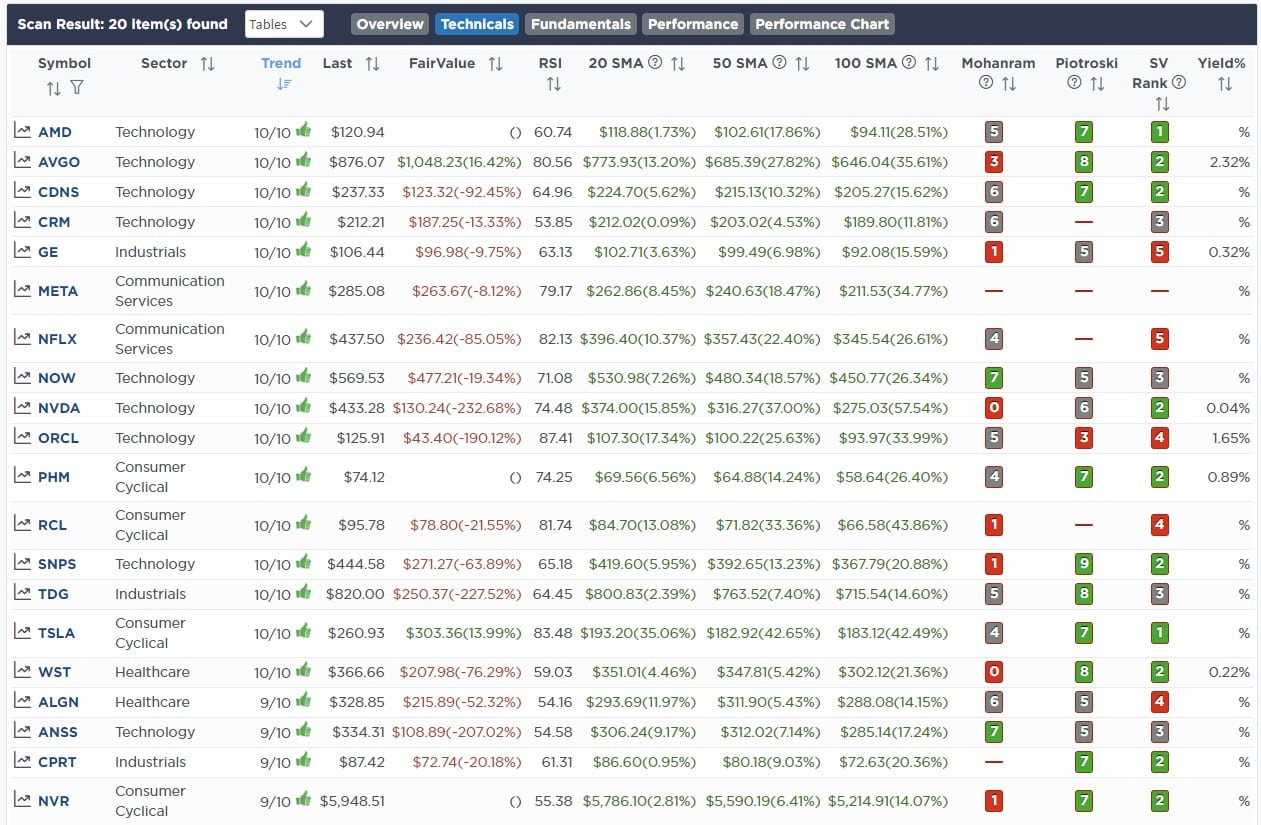
Weekly SimpleVisor Stock Screens
We provide three stock screens each week from SimpleVisor.
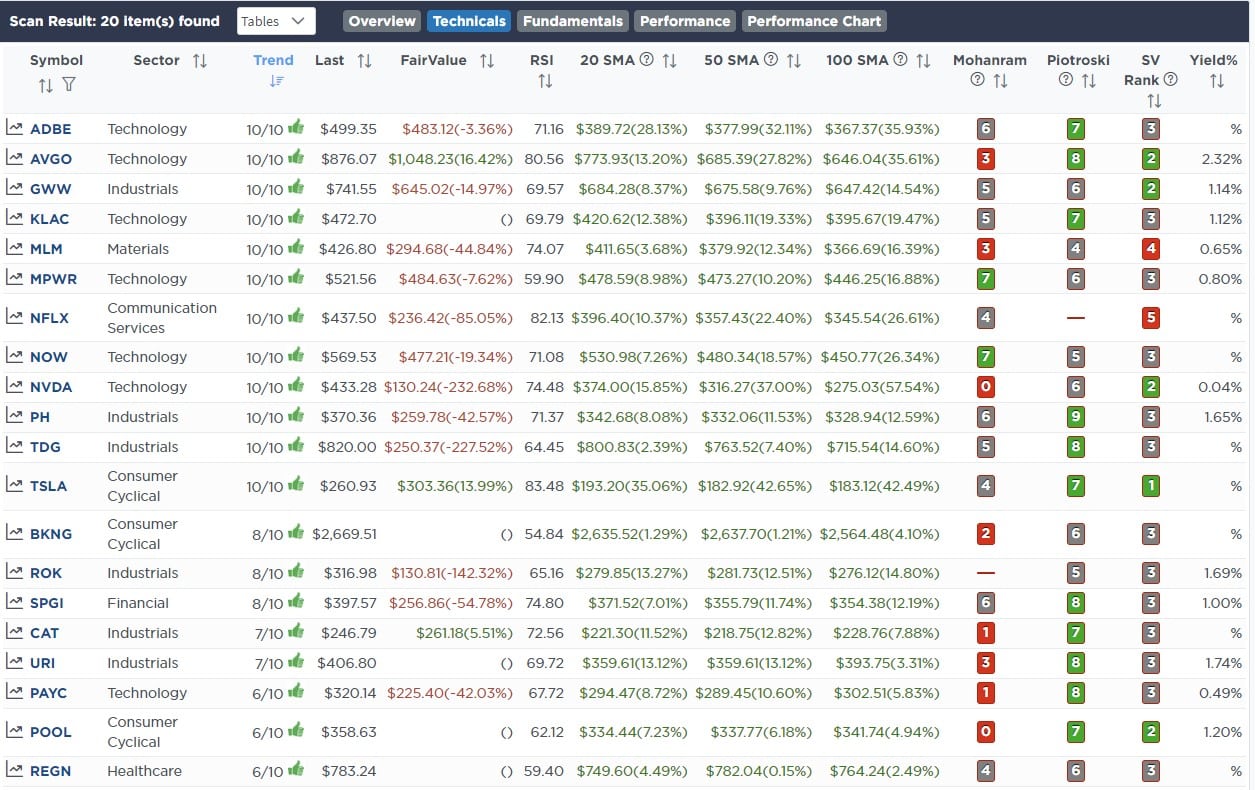
This week we are searching for the Top 20:
- Relative Strength Stocks
- Momentum Stocks
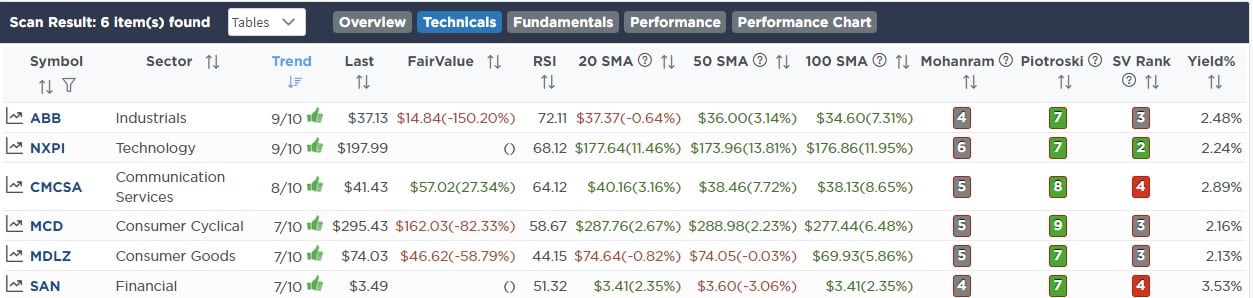
- Technically Strong Stocks With Dividends
(Click Images To Enlarge)
R.S.I. Screen
Momentum Screen
Technically Strong With Dividends
SimpleVisor Portfolio Changes
We post all of our portfolio changes as they occur at SimpleVisor:
June 14th
“The health insurers are selling off markedly this morning as the CEO of UNH said, “We’re seeing that more seniors are just more comfortable accessing services for things that they might have pushed off a bit like knees and hips.”
Insurers, like UNH, Humana, and CVS, are trading off, while medical device companies are rising. As a result, we are adjusting our equity healthcare exposure. We sold our position in United Healthcare (UNH) to reduce our exposure to insurers while maintaining our holding in CVS (CVS). We also increased our stake in Abbott Laboratories (ABT) and opened a new position in Stryker Medical (SYK), which is a medical devices company. Stryker will also benefit from advances in AI technology.
In the ETF Model we are selling 2% of the iShares Healthcare Sector ETF (XLV) and swapping into a 2% position of iShares US Medical Devices ETF (IHI).
Our net exposure to healthcare is not changing.”
Equity Model
- Sell 100% of United Healthcare (UNH)
- Add 1% of the portfolio to the existing Abbott (ABT) position.
- Initiate a new 2% portfolio position in Stryker Medical (SYK).
ETF Model
- Sell 2% of the portfolio in the iShares Healthcare Sector (ETF)
- Initiate a 2% position in the iShares US Medical Devices ETF (IHI)
June 15th
“This morning, we shifted 5% from BIL to SHY (1-3yr UST). With the Fed approaching its terminal rate for the cycle and odds increasing that they start lowering rates aggressively over the next two years, we want to get the 4.70% two-year yield with the possibility of earning a few percent in principal gains as well. BIL will yield a little more over the shorter term, but that will likely come down over time with zero principal gains.”
Both Models
- Sell 5% Of The Portfolio Value Of The SPDR Barclay’s 1-3 Month Treasury Bill ETF (BIL)
- Add 5% Of The Portfolio Value To The Existing iShares 1-3 YEAR Treasury Bill ETF (SHY)

Lance Roberts, C.I.O.
Have a great week!


