Commodity Surge Is A Bearish Indicator


In this 03-04-22 issue of “Commodity Surge Is A Bearish Indicator.”
- Market Review & Update
- Commodity Surge Is A Bearish Indicator
- Portfolio Positioning
- Sector & Market Analysis
Follow Us On: Twitter, Facebook, Linked-In, Sound Cloud, Seeking Alpha
Need Help With Your Investing Strategy?
Are you looking for complete financial, insurance, and estate planning? Need a risk-managed portfolio management strategy to grow and protect your savings? Whatever your needs are, we are here to help.
Schedule your “FREE” portfolio review today.

Weekly Market/Strategy Recap With Adam Taggart
Market Review – Stocks Struggle As Russia Advances
Friday morning, stocks sank back to previous support on news Russia had taken Ukraine’s nuclear power facility. It is not surprising with the ongoing Russia conflict; no one wants to hold equities over the weekend if something happens.
While the market continues to grind out a downtrend, so far, it remains a very steady decline without much sign of visible panic. Such was a point made by Sentiment Trader this past week.
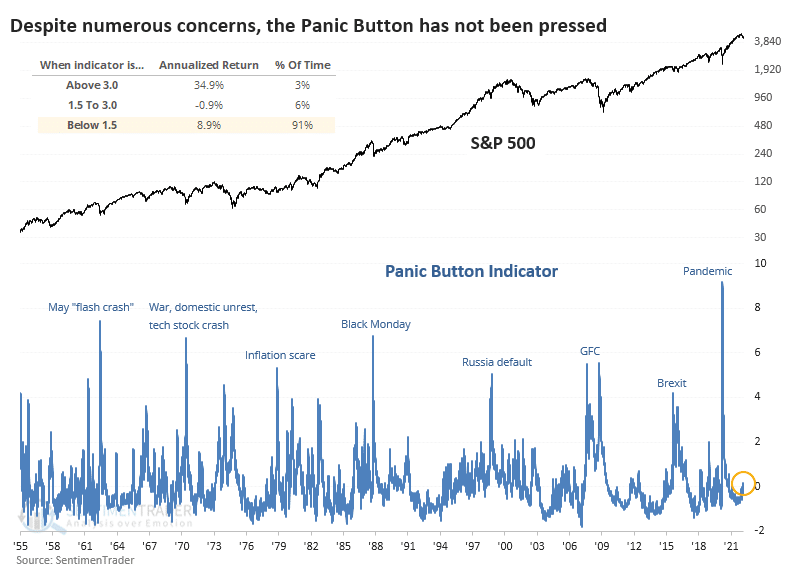
The problem with a declining market with no real “fear” is that signals become less reliable. Trading signals work best when they trade at extremes but give “false” signals when in the middle. Does that mean we should abandon our analysis and go with our “gut?” Of course, not. However, it does mean we should be more cautious in making portfolio changes.
- Give postions a little more “wiggle” room
- Maintain stops at critical support levels
- Reduce position sizes temporarily until certainty returns.
- Add hedges to reduce risk
With those guidelines, we can review the current market setup.
As discussed last week, the market has given us a decent roadmap to follow near term. With a short-term buy signal still intact and not overbought yet, there are three rally targets and a critical support level for the market currently:
Rally targets are:
- The 200-dma (red line)
- The current downtrend line; and,
- The 50-dma (black line)
Critical support level:
- January and October lows.
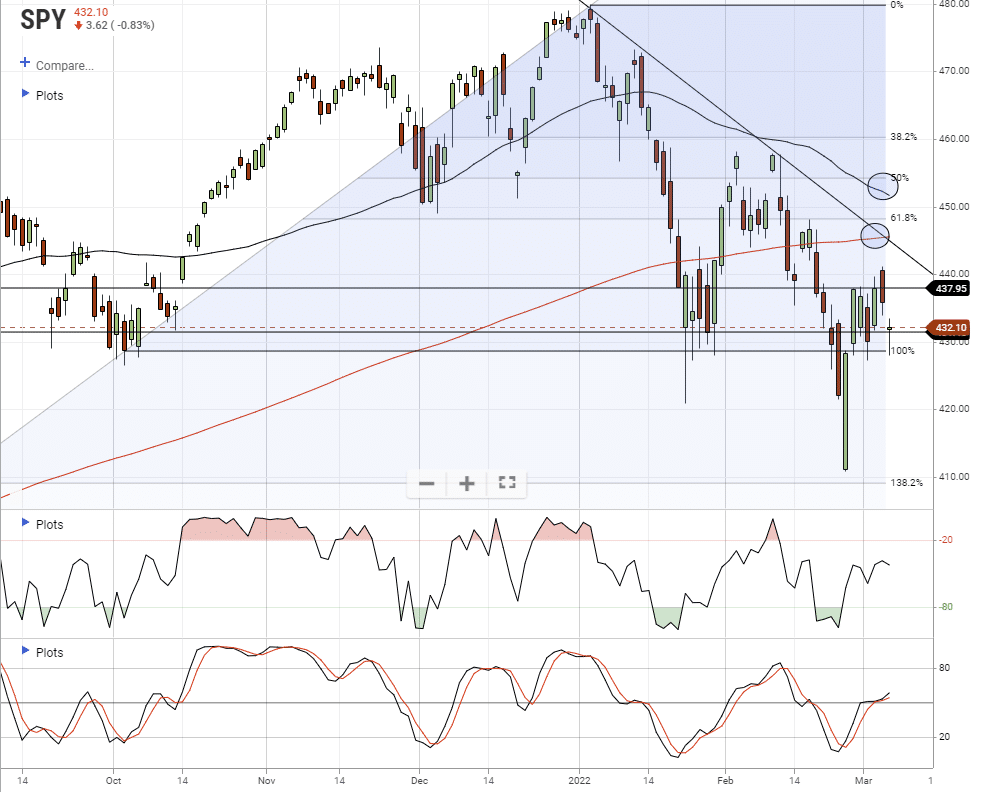
Unfortunately, most of the “fuel” for a stronger rally got squandered. Therefore, we will re-hedge risk on any rally next week, particularly as the markets struggle with geopolitical risk.
The surge in commodities is a more concerning bearish indicator.
A History Of Commodity Cycles
Since 1980, the start of my data feed for the CRB Index, there have been 4-distinct cycles in commodities.
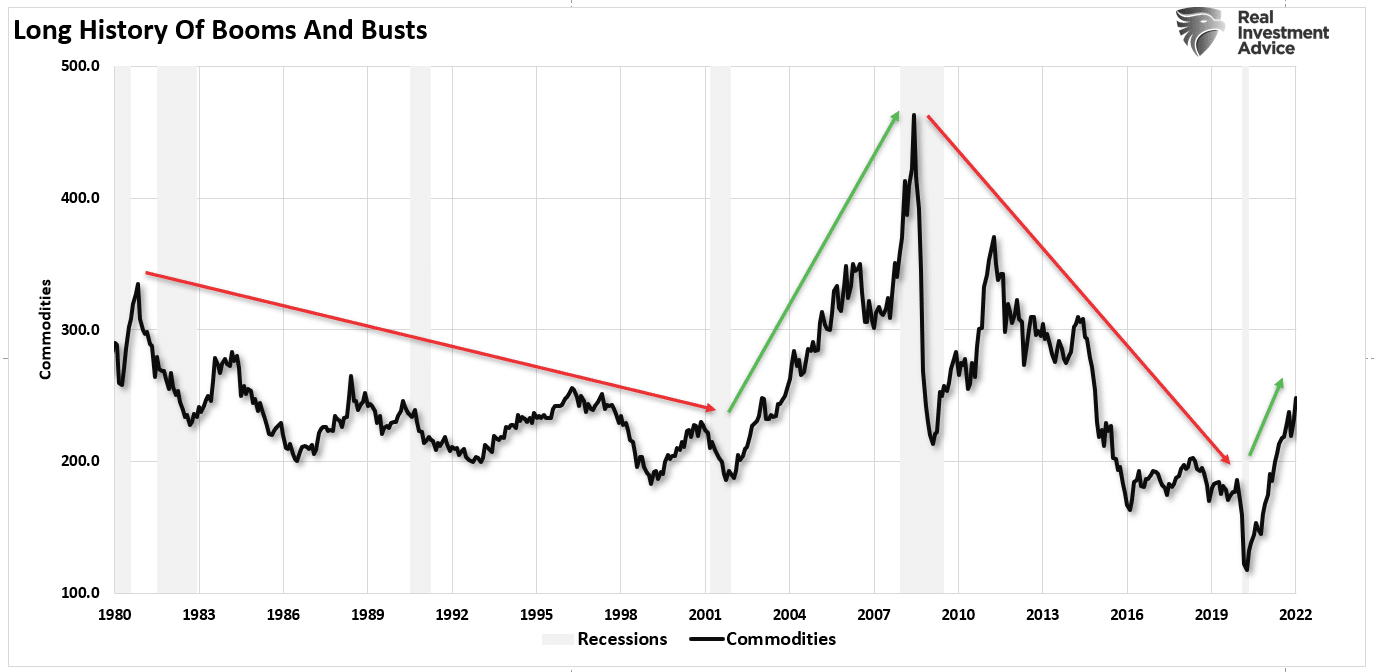
Commodity prices fell from 1980 to 2000 as the economy shifted from manufacturing to financialization. Beginning in 2001, as the dot.com era ended, investment flows shifted to commodities and emerging markets in anticipation of a global resurgence. Housing demand boomed as mortgage rates fell, and energy demand rose on fears of “peak oil production.”
However, as quickly as it came, the demand for commodities faded as the financial crisis crippled the entire global economy. That deflationary trend continued until March 2020.
The current commodity spike is a natural byproduct of too much money chasing too few goods. As the Covid-pandemic shut down production, governments injected billions of dollars to stimulate demand. That imbalance of demand versus supply created the current inflation surge.

However, since the demand-side of the equation was a function of artificial liquidity, the question is the sustainability of higher prices?
We must understand that commodities and hard assets generally do not live in a vacuum to answer that question. Instead, they are subject to the supply-demand equation, ultimately setting their price. Therefore, and not surprisingly, economic growth, interest rates, the dollar, and the money supply weigh heavily on that equation.
This Week’s MacroView
A Hard Landing
Several indicators point to the ongoing demand for those assets if commodities and hard assets are driven by demand, particularly in manufacturing.
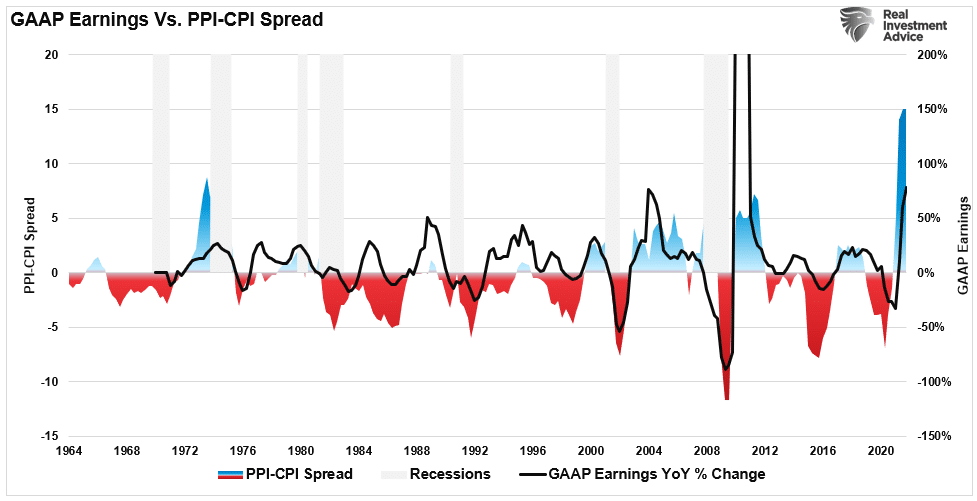
As discussed previously, the current spread between the Producer Price Index (PPI) and the Consumer Price Index (CPI) suggests that companies cannot pass along the entirety of higher input costs. As such, there is a high correlation to earnings growth. Eventually, companies will react to protect profits through layoffs, automation, and cost reductions. Such actions typically precede the onset of a recession.
Interest rates are equally crucial as rates reflect the strength of economic growth, inflation, wages, and overall demand. There is a decent correlation between the annual change in interest rates (reflecting economic strength or weakness) and commodity prices.
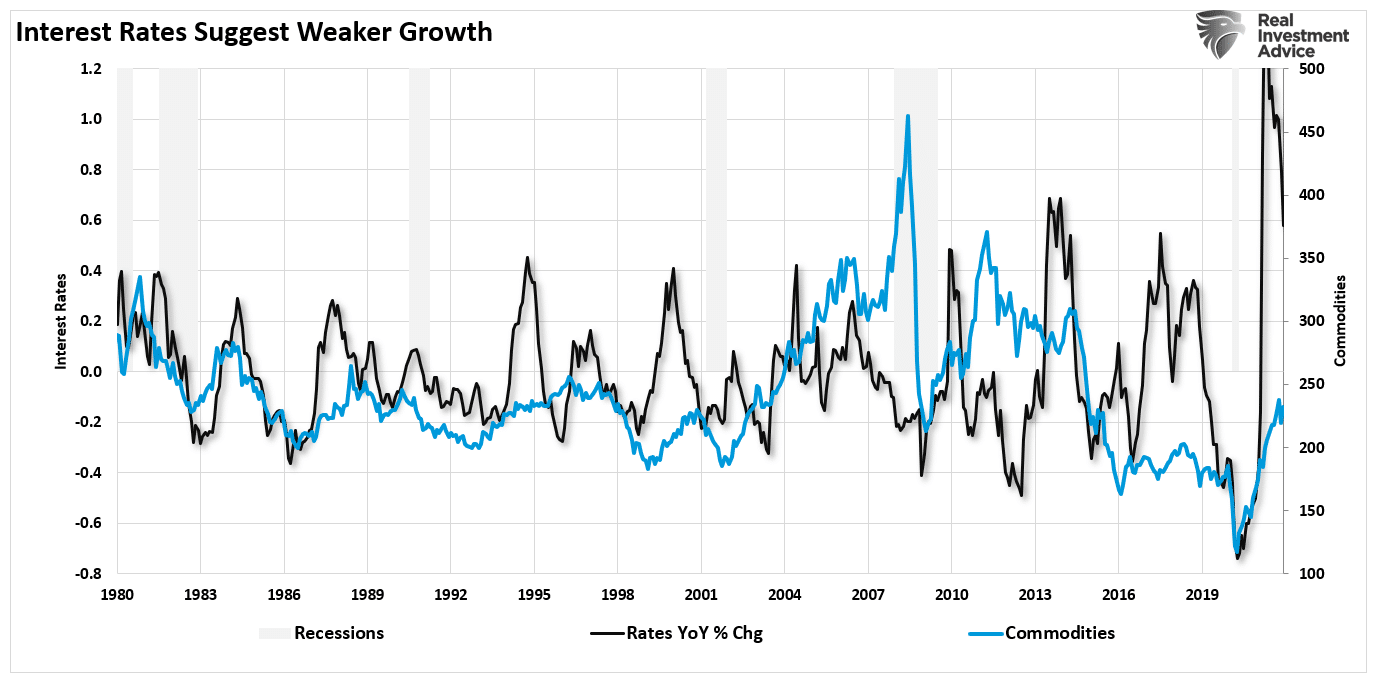
The recent surge in commodity prices from the 2020 lows corresponds with the jump in rates. Such fits with the flood of fiscal policy, allowing demand to outpace the economic production capacity. However, with the liquidity now reversed, rates will reverse to levels consistent with weaker economic growth rates.
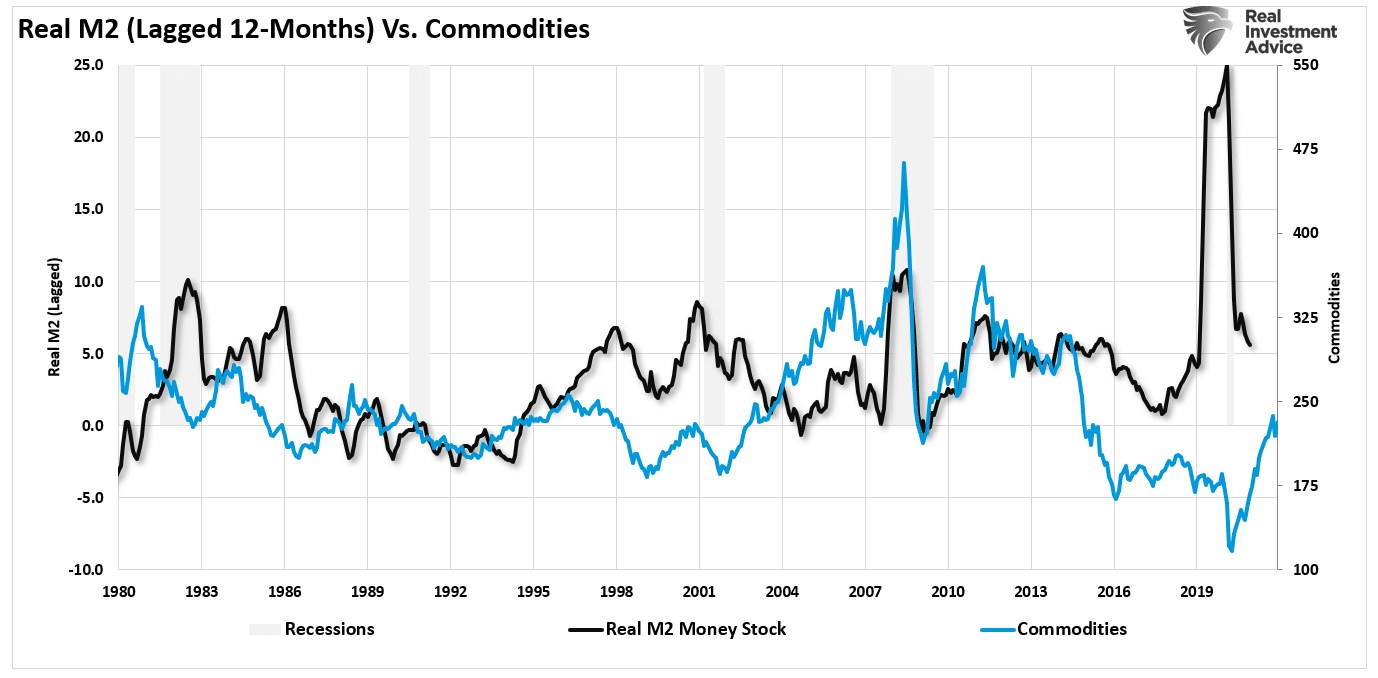
A consequence of that reversal in liquidity, as measured through M2, is the reversal of inflation over the next 9-months. Again, since commodities are highly correlated to inflation, it suggests the peak in the “hard asset” trade as the economy normalizes.
Not surprisingly, commodities track nominal GDP growth.

The surge in economic growth following the pandemic-driven shutdown was, as stated, an artificial “sugar rush” of liquidity flooding the system. Such caused a massive rise in money supply, leading to inflation given the lack of productive capacity. However, as is already the case, economic activity is reverting to more normal levels.
Commodity Surge & Markets
With that background, it is not surprising that peaks in commodity prices tend to align with peaks in the financial markets. Such is because earnings ultimately get derived from economic activity. If economic activity slows due to high commodity prices, the market will reprice valuations accordingly.
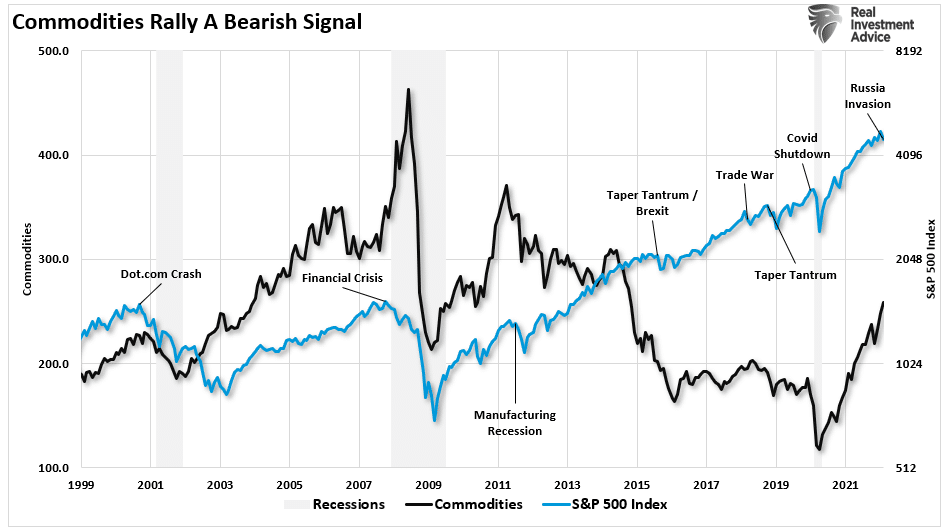
Following the financial crisis, the markets became more insulated from commodity declines due to the massive monetary support from the Federal Reserve. Nonetheless, declines in commodity prices, which, as noted above, are tied to the economic cycle, resulted in market corrections.
The current commodity surge will once again trigger an economic slowdown. Commodity surges are equivalent to monetary tightening by reducing the consumptive power of Americans. However, when that commodity surge coincides with the Fed’s more aggressive monetary policy, the results will likely be disappointing.
In other words, as the Fed hikes rates, a “hard landing” is almost assured.

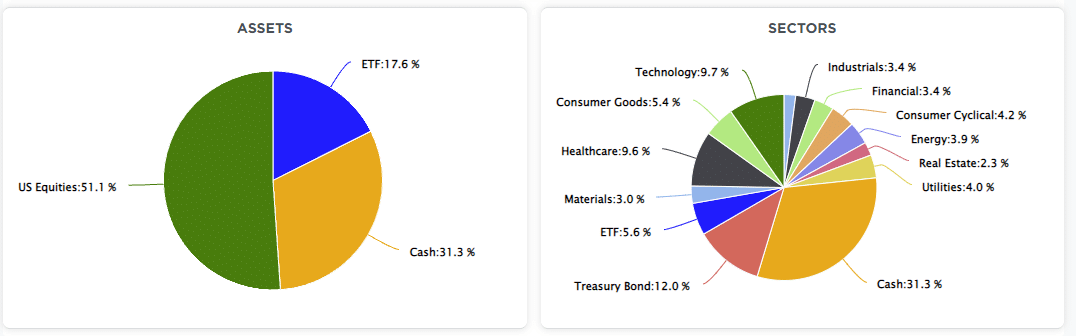
Portfolio Update
The main point of this week’s discussion is that many retail traders are now chasing the “commodity bull market” under the assumption that we are returning to the “inflation” of the 1970s. There is a considerable difference between the two periods.
The 1970s inflation surge was a function of a strongly growing economy, rising wages, and high savings rates, versus today’s “artificial” demand surge from a massive liquidity program. However, as is always the case, surges in commodities, particularly oil prices, have an almost immediate negative impact on economic growth. As high prices quell demand, supply builds, driving down prices.
From that view, our expectation is the Fed will likely hike rates more quickly than needed in an already slowing economy leading to a deflationary drag. Such keeps our portfolios aligned to a defensive posture currently.
However, we did reduce our hedges early this week due to the short-term oversold condition of the market. We are looking for a bounce to current resistance levels, as discussed above, to rebuild those hedges and reduce risk further.
While we are not currently expecting a substantial bear market, the risk of a more profound decline is undoubtedly present. That risk becomes more elevated as the Federal Reserve begins its rate-hiking campaign. As shown below, the markets tend to weather rate hikes until the Fed eventually “breaks something.”
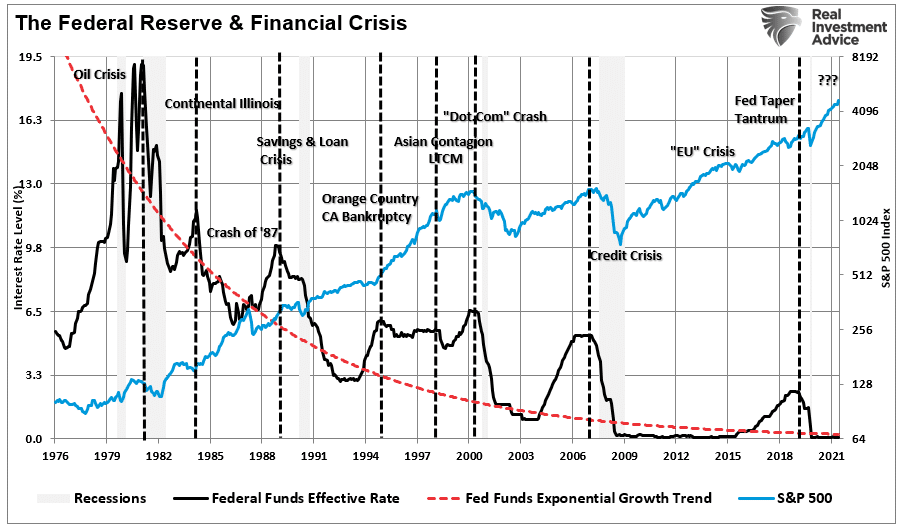
We suspect this time will be no different, and we are hedging our risks accordingly.
Market & Sector Analysis
S&P 500 Tear Sheet
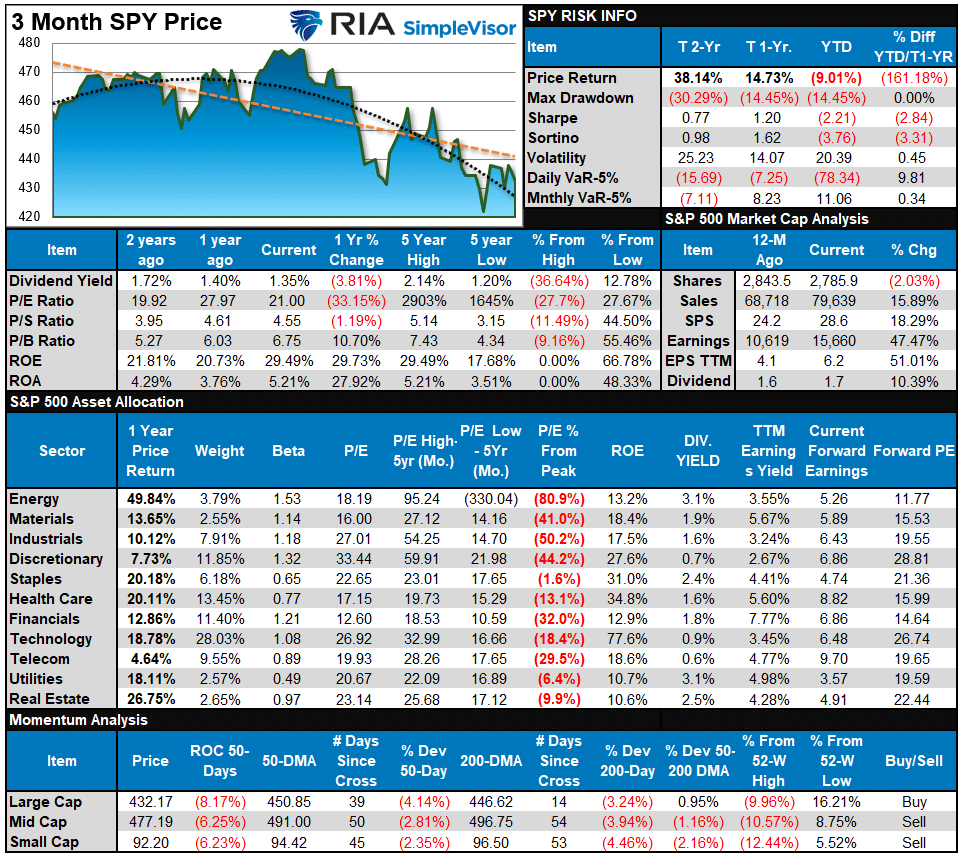
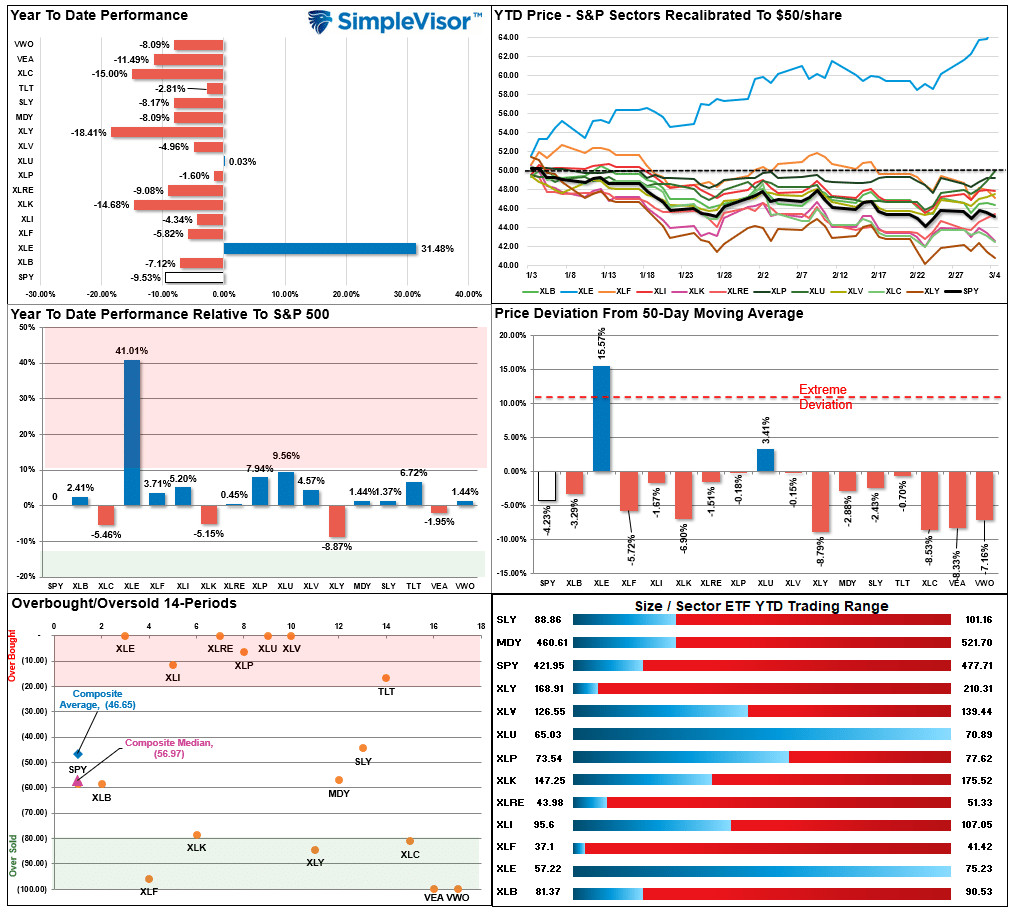
Relative Performance Analysis
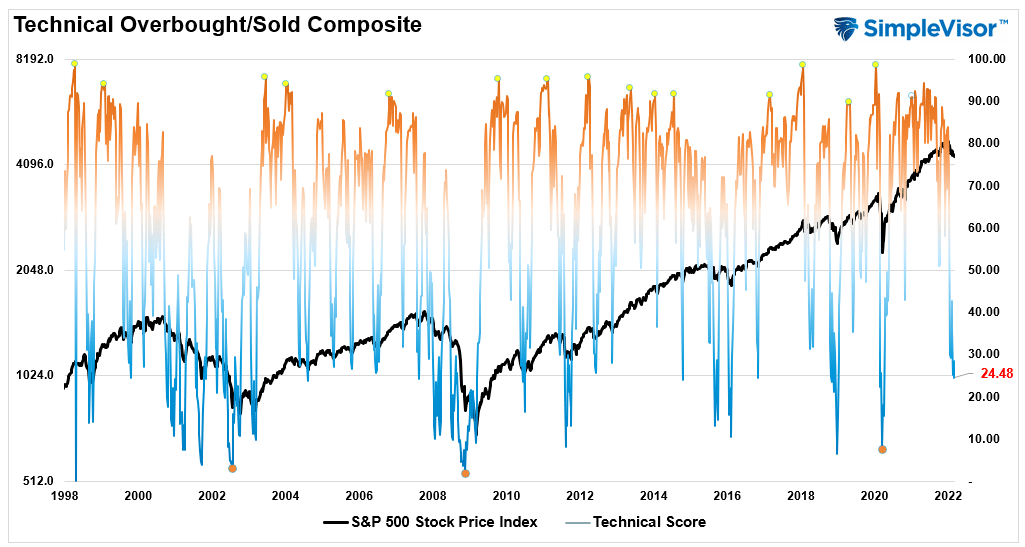
Technical Composite
The technical overbought/sold gauge comprises several price indicators (RSI, Williams %R, etc.), measured using “weekly” closing price data. Readings above “80” are considered overbought, and below “20” are oversold. The current reading is 24.48 out of a possible 100.
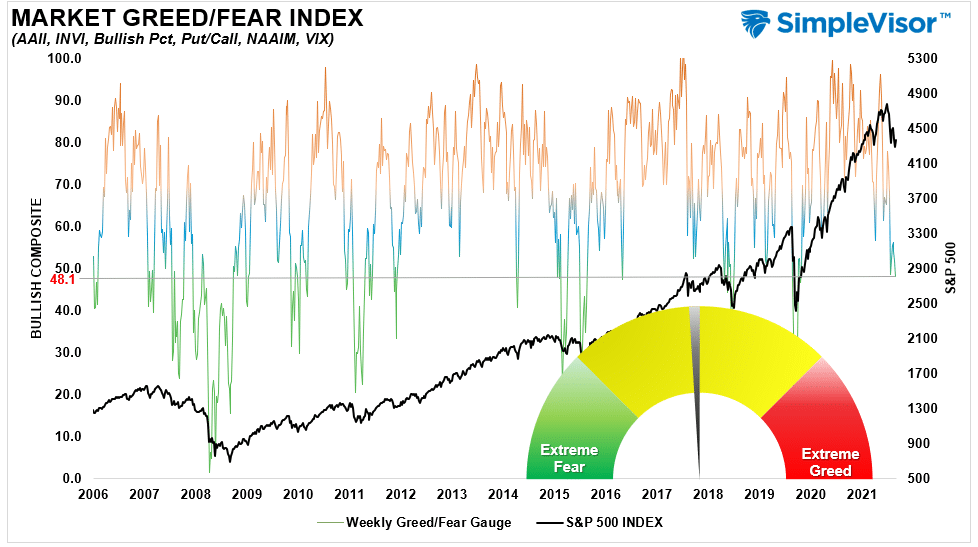
Portfolio Positioning “Fear / Greed” Gauge
Our “Fear/Greed” gauge is how individual and professional investors are “positioning” themselves in the market based on their equity exposure. From a contrarian position, the higher the allocation to equities, to more likely the market is closer to a correction than not. The gauge uses weekly closing data.
NOTE: The Fear/Greed Index measures risk from 0-100. It is a rarity that it reaches levels above 90. The current reading is 48.09 out of a possible 100.
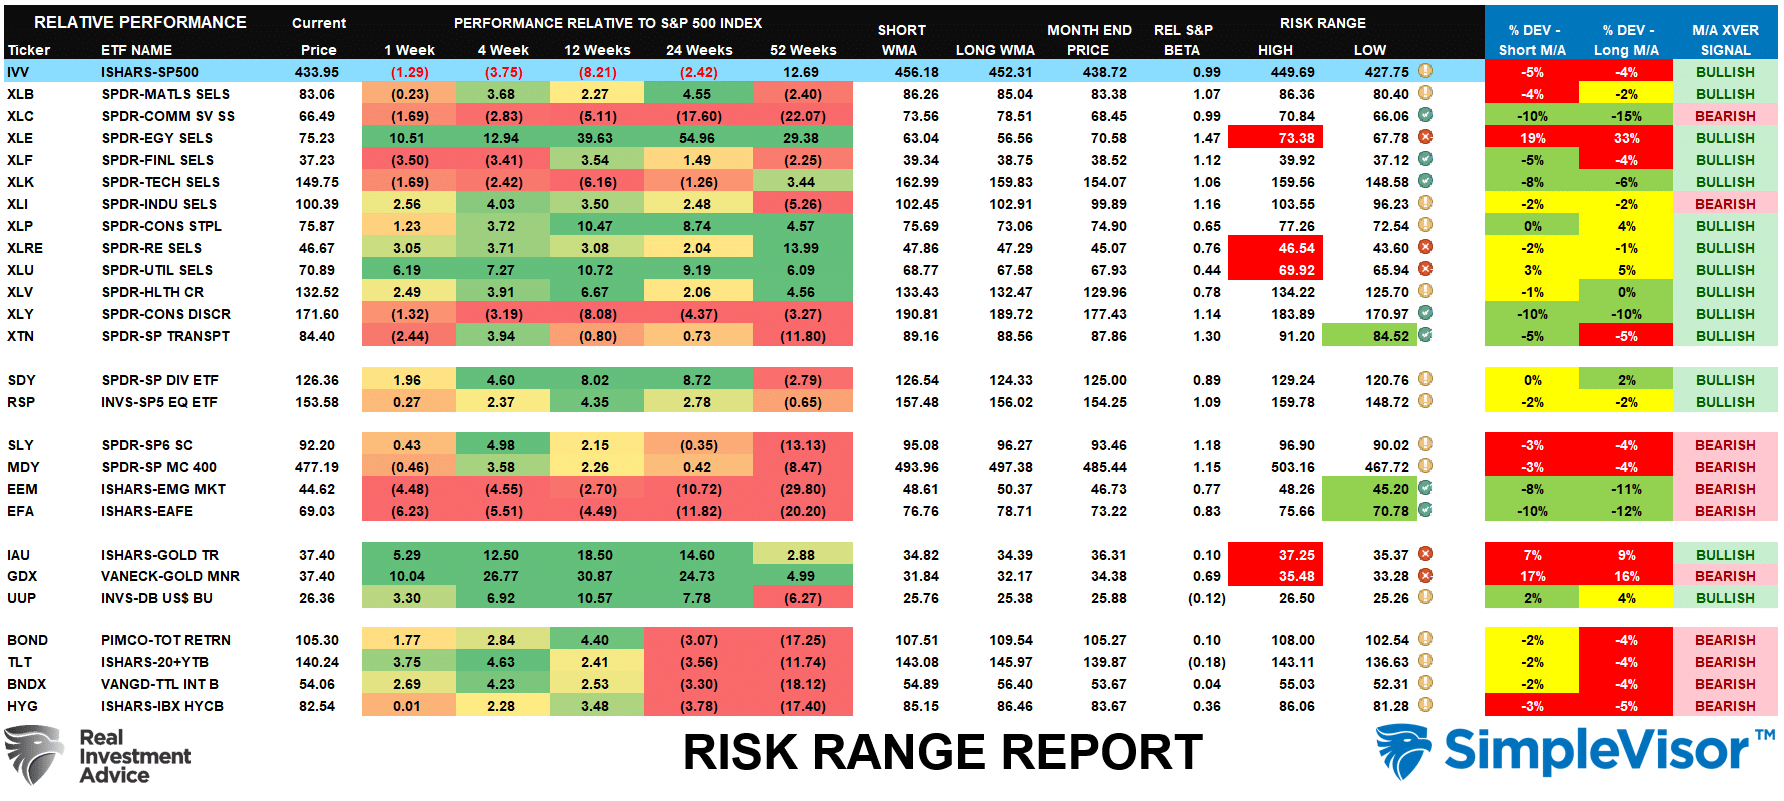
Sector Model Analysis & Risk Ranges
How To Read This Table
- The table compares each sector and market to the S&P 500 index on relative performance.
- “MA XVER” is determined by whether the short-term weekly moving average crosses positively or negatively with the long-term weekly moving average.
- The risk range is a function of the month-end closing price and the “beta” of the sector or market. (Ranges reset on the 1st of each month)
- Table shows the price deviation above and below the weekly moving averages.
- The complete history of all sentiment indicators is on under the Dashboard/Sentiment tab at SimpleVisor
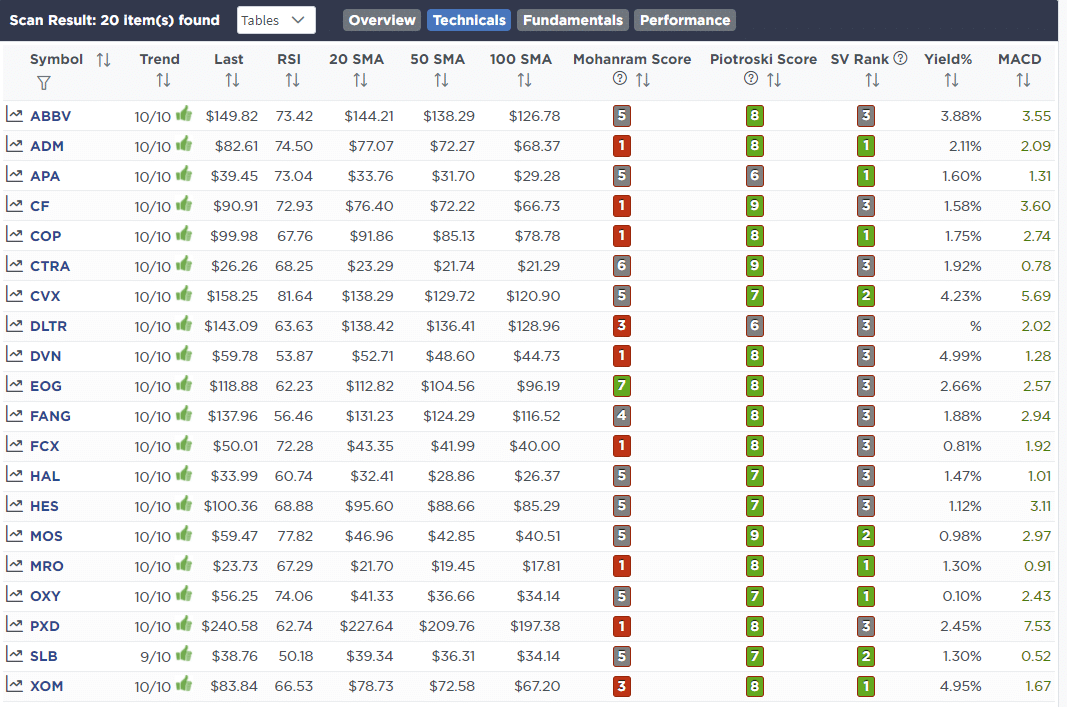
Weekly Stock Screens
Each week we will provide three different stock screens generated from SimpleVisor: (RIAPro.net subscribers use your current credentials to log in.)
This week we are scanning for the Top 20:
- Relative Strength Stocks
- Momentum Stocks
- Technically Strong With Strong Fundamentals
These screens generate portfolio ideas and serve as the starting point for further research.
(Click Images To Enlarge)
RSI Screen
Momentum Screen

Technical & Fundamental Strength Screen

SimpleVisor Portfolio Changes
We post all of our portfolio changes as they occur at SimpleVisor:
February 28th
With the market oversold, a registered “buy signal” on the S&P 500, investor sentiment extremely negative, we are removing our short-S&P 500 hedge and raising some additional cash. As noted in this morning’s blog post “March Rally,” there is a reasonable expectation we could see the market rally into the FOMC meeting. If we do get that rally, we will likely reset the short-position in the portfolio again.
Equity & ETF Portfolios
- Sell 100% of S&P 500 Short Position (SH)
- Sell 100% of IShares Preferred ETF (PFF)
March 2nd
“This morning we reduced exposure slightly by selling 1% of Ford (F) and 0.5% of XLB and LIT in portfolios. Ford is up almost 5% this morning on plans to split the company between electric and traditional. However, with the economy slowing, semiconductors still in short supply, and the Fed reducing monetary support, there is a risk to Ford’s earnings later this year. We also reduced basic materials in advance of a slower economic environment as well.
From a trading perspective, we recently added to our bond holdings (TLT) at lower levels and the sharp rally over the last couple of days pushed yields into resistance. We are taking profits in the 2% of TLT we recently added but are holding the balance for a slower economic environment later this year.”
Equity Model
- Reduce Ford (F) from 3% of the portfolio to 2%.
- Reduce TLT from 10% to 8% of the portfolio.
ETF Model
- Reduce SPDR Basic Materials (XLB) and the Global X Lithium (LIT) by 0.5% each.
- Reduce TLT from 10% to 8% of the portfolio.

Lance Roberts, CIO
Have a great week!


