Stocks Surge As Earnings Roll-In, But Is Risk Gone? 10-22-21


In this 10-22-21 issue of “Stocks Surge As Earnings Roll-In, But Is Risk Gone?”
- Market Surges Toward Previous Highs
- It’s Been A Very Long-Time WIthout A Deeper Correction
- A Sea Of Liquidity
- Portfolio Positioning
- Sector & Market Analysis
- 401k Plan Manager
Follow Us On: Twitter, Facebook, Linked-In, Sound Cloud, Seeking Alpha
Is It Time To Get Help With Your Investing Strategy?
Whether it is complete financial, insurance, and estate planning, to a risk-managed portfolio management strategy to grow and protect your savings, whatever your needs are, we are here to help.
Schedule your “FREE” portfolio review today.

Market Surges Toward Previous Highs
Last week, we discussed the “correction being over” for the time being.
“While the market started the week a bit sloppily, the bulls charged back on Thursday as earnings season officially got underway. With the market crossing above significant resistance at the 50-dma and turning both seasonal “buy signals” confirmed, it appears a push for previous highs is possible.
Two factors are driving the rebound. Earnings, so far, are coming in above estimates. Such isn’t surprising as analysts suppressed estimates going into reporting season. Secondly, bond yields declined.“
Chart updated through Friday.
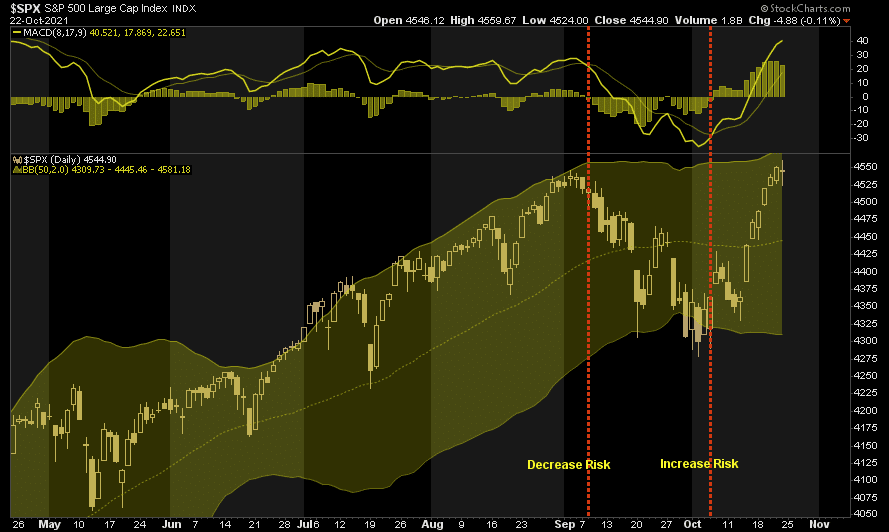
However, to expand on a point from last week, breadth remains dismal, with only 60% of stocks above their respective 50-dma even though the index is at all-time highs.
Moreover, our “money flow buy signal” has reversed to previous highs, but volume has dissipated sharply during the advance.
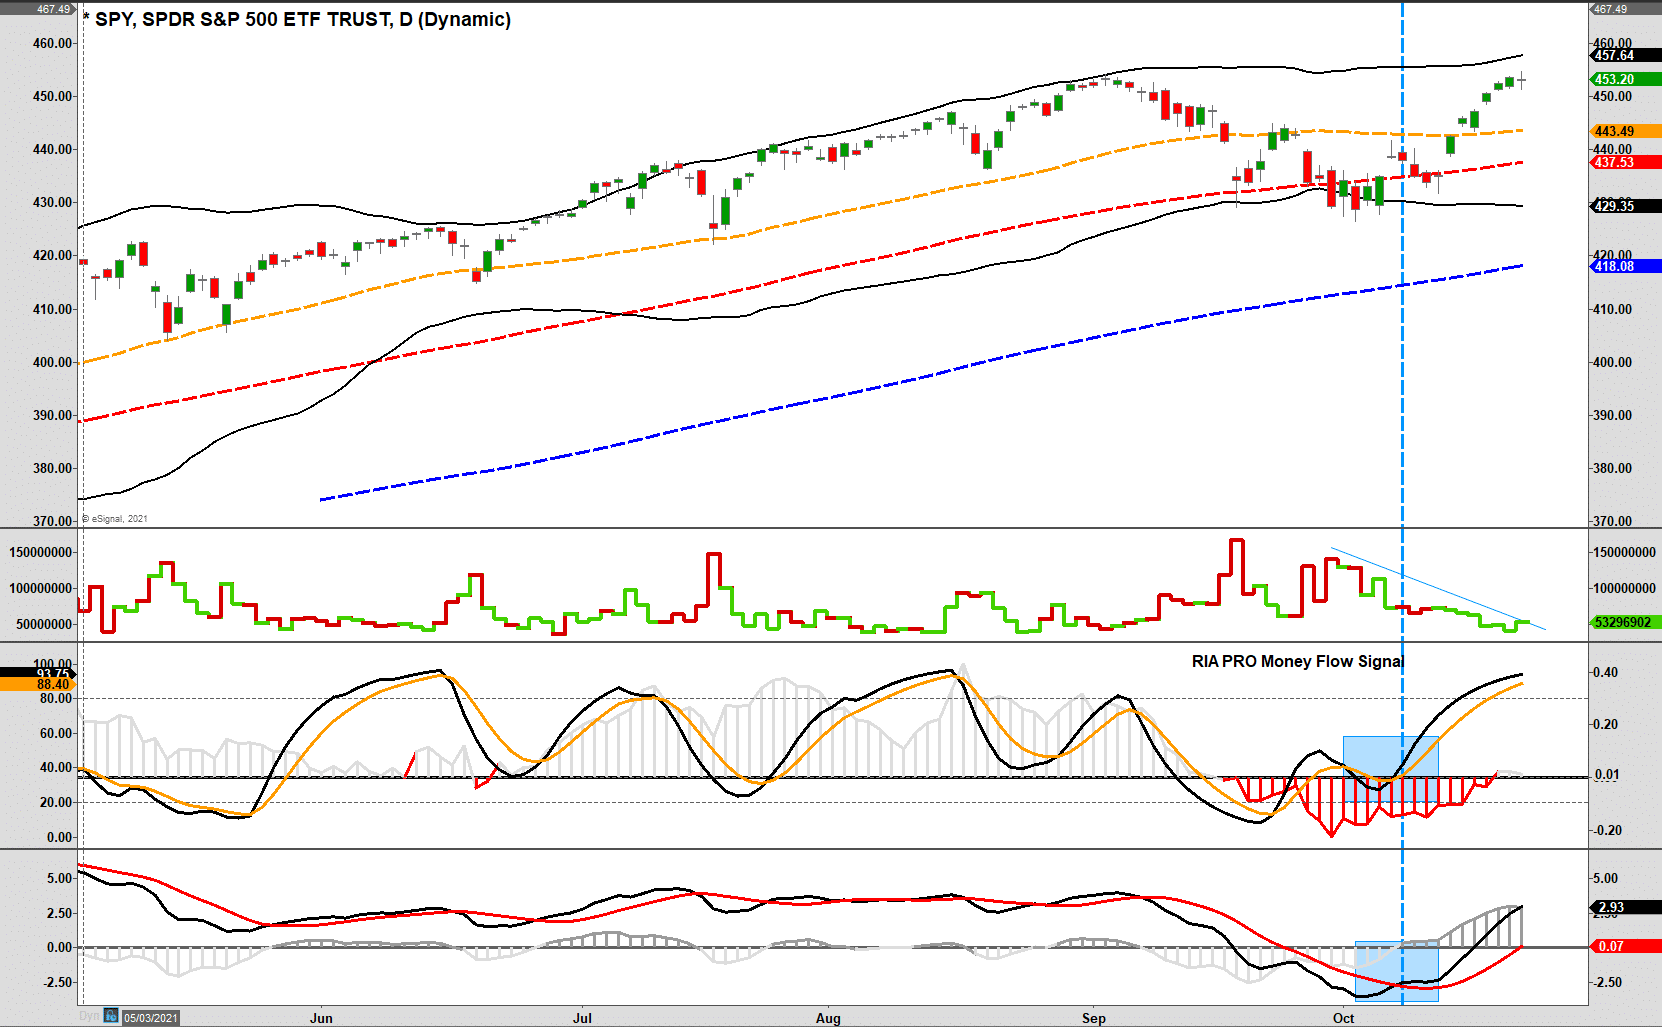
Our concern is that while the expected rally from support occurred, there has been very little “conviction” to that advance. Therefore, we tend to agree with David Tepper of Appaloosa Management when he stated:
“Sometimes there are times to make money…sometimes there are times not to lose money.“
While the market is within the seasonally strong year, the risk of a correction remains. Such is particularly the case as we head into 2022.

Its Been A Very Long Time Without A Deeper Correction
While investors are quickly returning to a more “bullish” excitement about the market, it is worth remembering the recent 5% correction did little to resolve the longer-term overbought conditions and valuations.
In mid-August, we discussed the market’s 6-straight months of positive returns, a historical rarity. To wit:
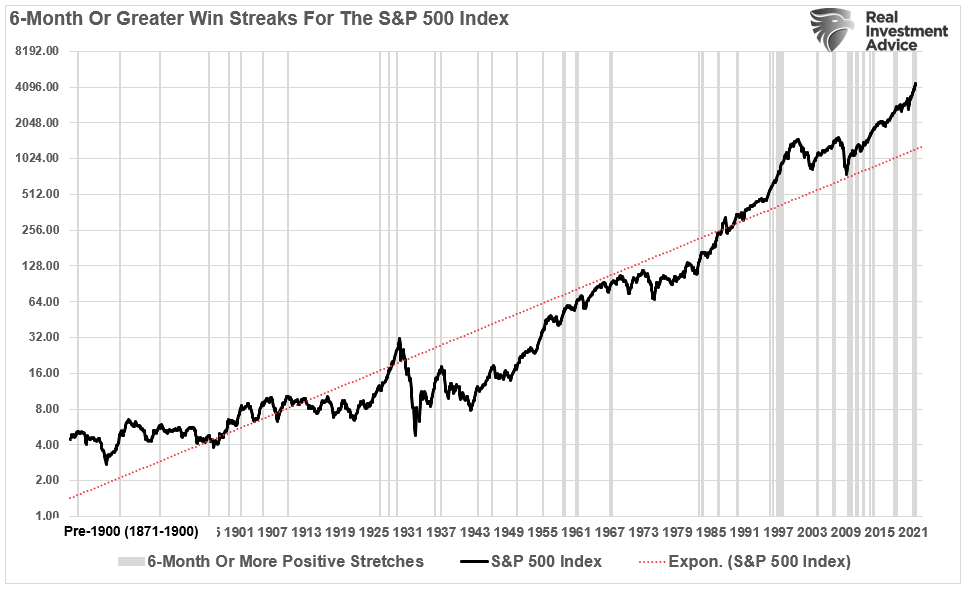
“There are several important takeaways from the chart above.”
- All periods of consecutive performance eventually end. (While such seems obvious, it is something investors tend to forget about during long bullish stretches.)
- Given the extremely long-period of market history, such long-stretches of bullish performance are somewhat rare.
- Such periods of performance often, but not always, precede fairly decent market corrections or bear markets.
Unfortunately, as we now know, that streak ended in September with a 5% correction that sent investors scurrying for cover.
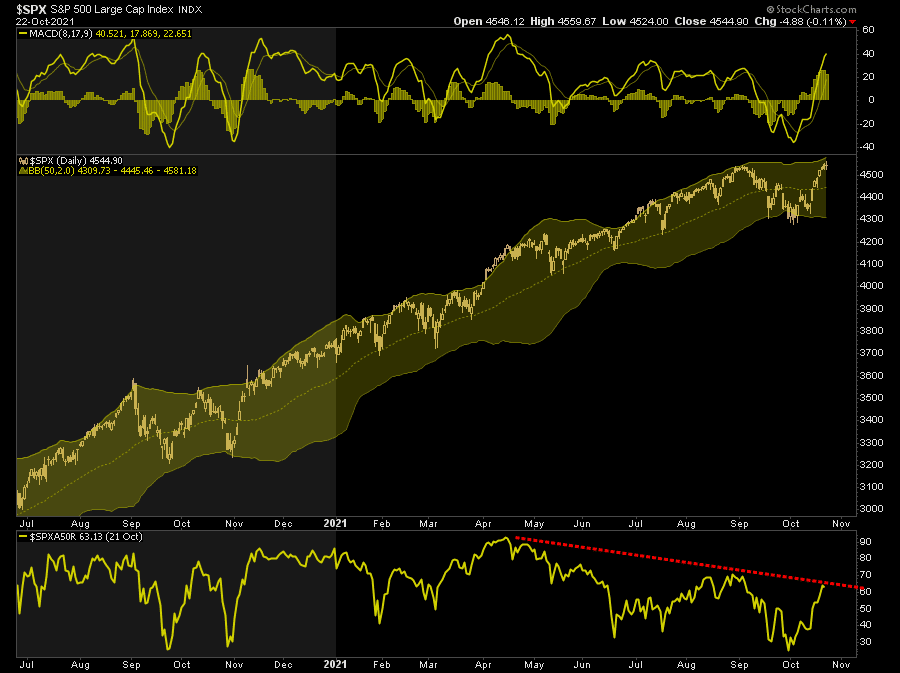
There is another streak that is also just as problematic. Currently, the S&P 500 index has gone 344-days without violating the 200-dma. Such is the sixth-longest streak going back to 1960.
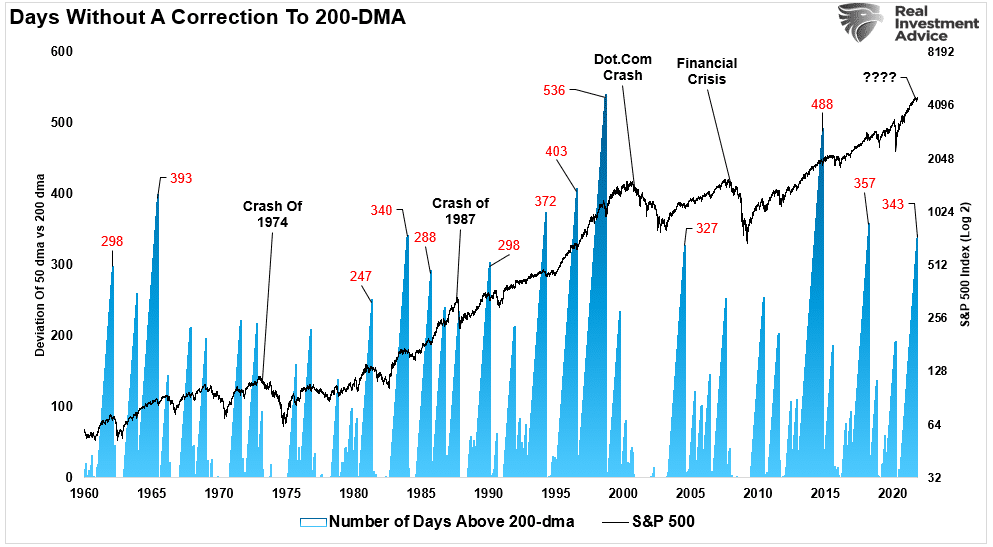
While investors are currently starting to believe that a test of the 200-dma won’t happen, there are several points to be mindful of.
- Corrections to the 200-dma, or more, happen on a regular basis.
- Long-stretches above the 200-dma are not uncommon, but all eventually resolve in a mean-reversion.
- Extremely long periods above the 200-dma have often preceded larger drawdowns.
The most crucial point to note is that in ALL CASES, the market eventually tested or violated the 200-dma. Such is just a function of math. For an “average” to exist, the market must trade both above and below that “average price” at some point.
However, a “correction” requires a “catalyst” that changes the investor psychology from “bullish” to “bearish.”
Extremely Depressed Volatility
At the moment, there are plenty of concerns, but investor psychology remains extremely bullish. Most concerns are well known, and, as such, the market discounts them concerning forward expectations, valuations, and earnings projections. However, what causes a sudden “mean reverting event” is an exogenous, unexpected event that surprises investors. In 2020, that was the pandemic-related “shutdown” of the economy.
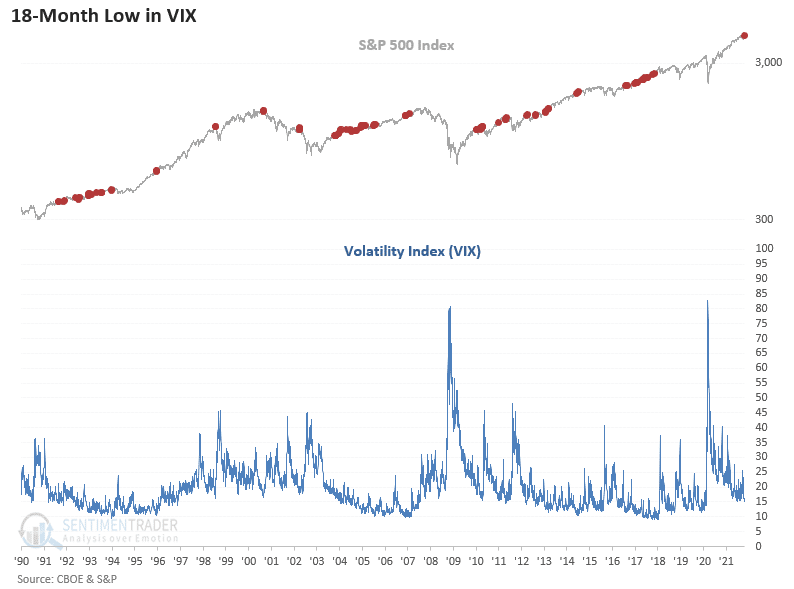
However, as with an empty “gas can,” a catalyst is ineffective if there is no “fuel” to ignite. Currently, that “fuel” is found in the high levels of market complacency, as shown by the collapse in the volatility index over the last couple of weeks.
“The Volatility Index (VIX) closed at a new 18-month low as the S&P 500 closed at a new multi-year high on Thursday, 10/21/21. If you were wondering, the 18-month low in the VIX Index represents the first occurrence since November 2017.” – Sentiment Trader
It is worth remembering the market had three 10-20% corrections in 2018 as low volatility begets high volatility.
Another measure is the P/E to VIX ratio which recently also peaked at 2.0. Previous peaks have been coincident with short-term corrections and bear markets.
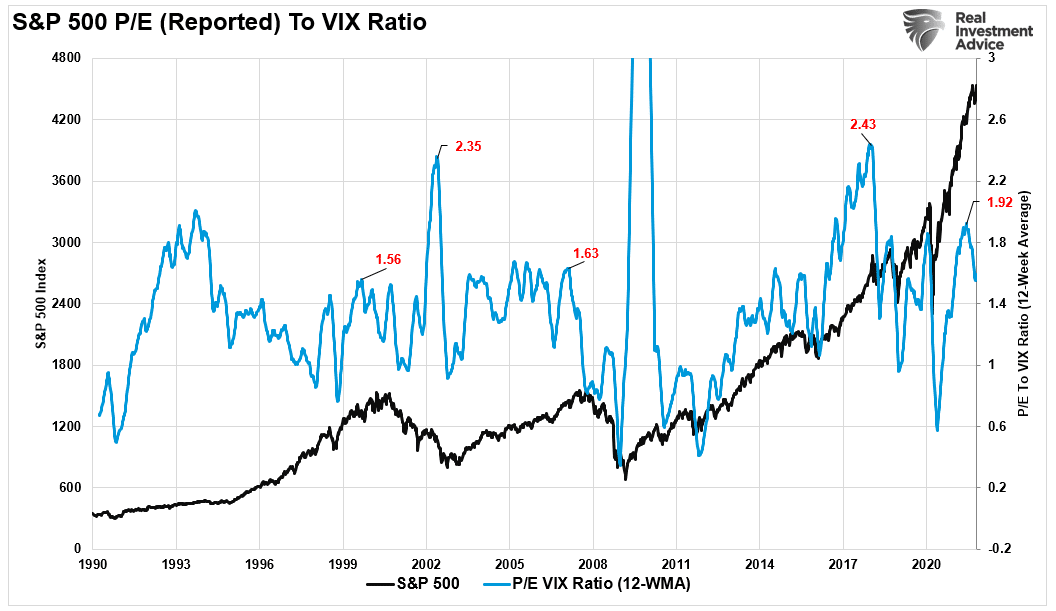
While anything is possible in the near term, complacency has returned to the market very quickly. As noted, while investors are very bullish, there are numerous reasons to remain mindful of the risks.
- Earnings and profit growth estimates are too high
- Stagflation is becoming more prevalent
- Inflation indexes are continuing to rise
- Economic data is surprising to the downside
- Supply chain issues are more persistent than originally believed.
- Inventory problems continue unabated
- Valuations are high by all measures
- Interest rates are rising
You get the idea.
But a more significant problem will set in next year – a contraction of liquidity.
In Case You Missed It

A Sea Of Liquidity
As noted, the unexpected “pandemic-driven economic shutdown” sent the Federal Reserve and Government into fiscal and monetary policy overdrive. Such led to an unimaginable influx of $5 trillion into the economy, sending the “money supply” surging well above the long-term exponential growth trend.

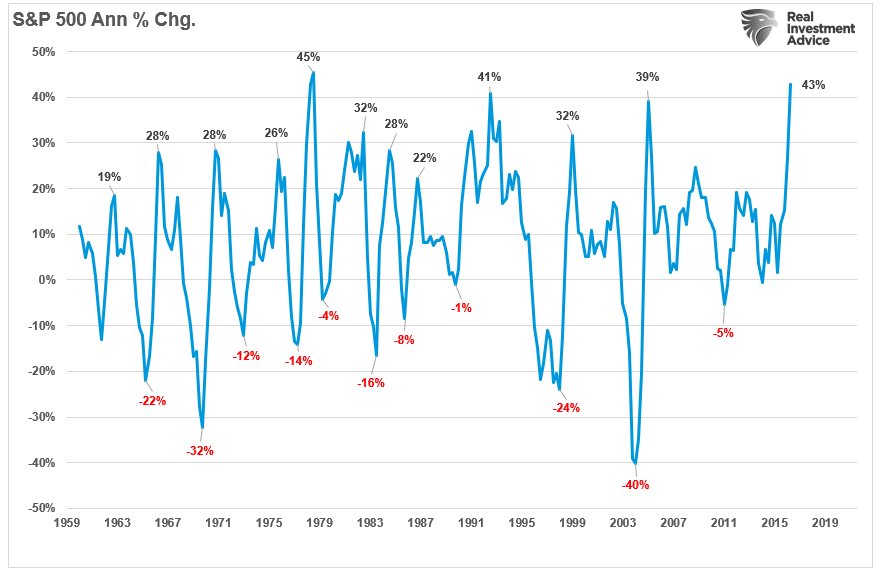
The importance of that “sea of liquidity” is both positive and negative. In the short term, that liquidity supports economic growth, the surge in retail sales into this year, and the explosive recovery in corporate earnings. That liquidity is also flowing into record corporate stock buybacks, retail investing, and a surge in private equity. With all that liquidity sloshing around, it is of no surprise we have seen a near-record surge in the annualized rate of change of the S&P 500 index.
However, as stated, there is a dark side to that liquidity. With the Democrats struggling to pass an infrastructure bill, a looming debt ceiling, and the Fed beginning to “taper” their bond purchases, that liquidity will start to reverse later this year. As shown below, if we look at the annual rate of change in the S&P 500 compared to our “measure of liquidity” (which is M2 less GDP), it suggests stocks could be in trouble heading into next year.
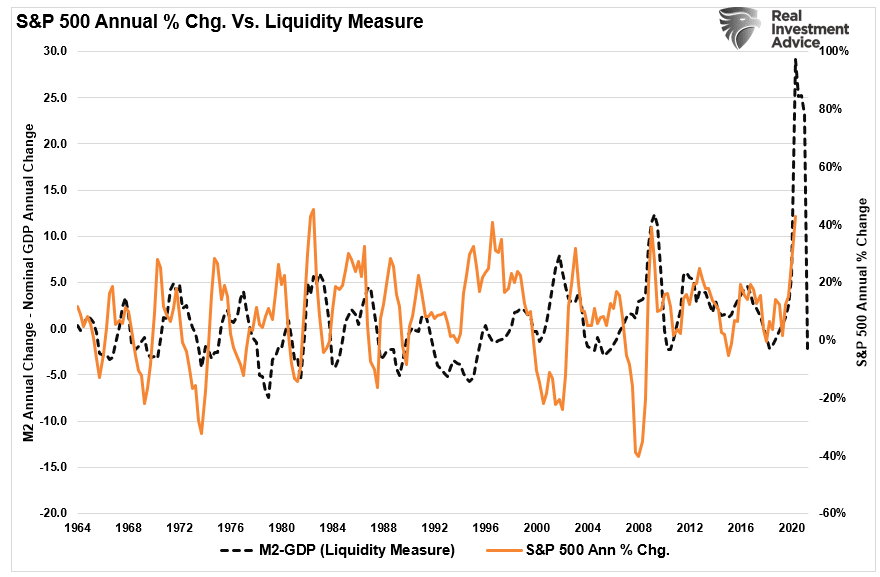
While not a perfect correlation, it is high enough to pay attention to at least. With global central banks cutting back on liquidity, the Government providing less, and inflationary pressures taking care of the rest, it is worth considering increasing risk-management practices.
You can see a complete list of our portfolio management guidelines here.

Portfolio Update
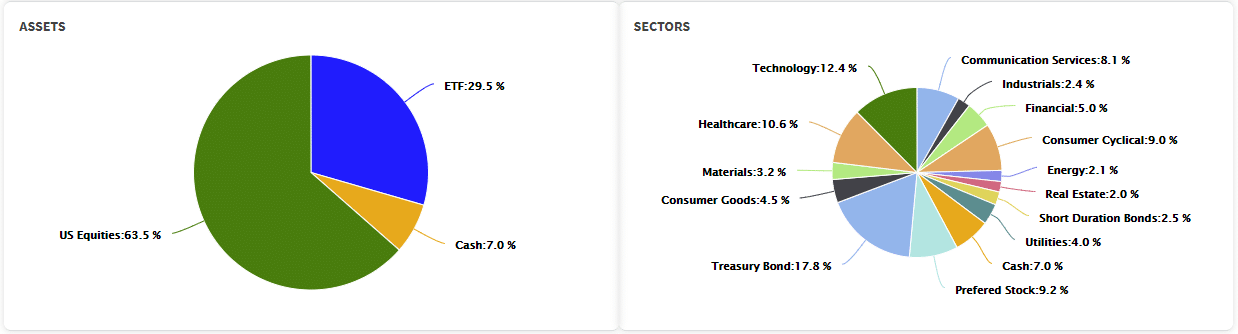
As noted last week, we increased our exposure to technology stocks heading into earnings season. Over the last half of September, the recent additions have paid off well, with the current run back to all-time highs. In our bond holdings, we remain nearly fully exposed to equities, slightly overweight cash, and a tad underweight target duration.
As noted last week:
“While our positioning is bullish, we remain very concerned about the market over the next several months. Historically, stagflationary environments do not mix well with financial markets. Such is because the combination of inflationary pressures and weaker economic growth erodes profit margins and earnings.
Furthermore, expectations heading into 2022 remain exceptionally optimistic, which leaves much room for disappointment. With liquidity getting drained, the Fed reducing monetary accommodation, and two rate hikes scheduled next year, the risk to investors remains elevated.”
A Note On Bond Positioning
I got asked last week to discuss our bond positioning. So we posted the following to RIAPRO subscribers on Friday morning.
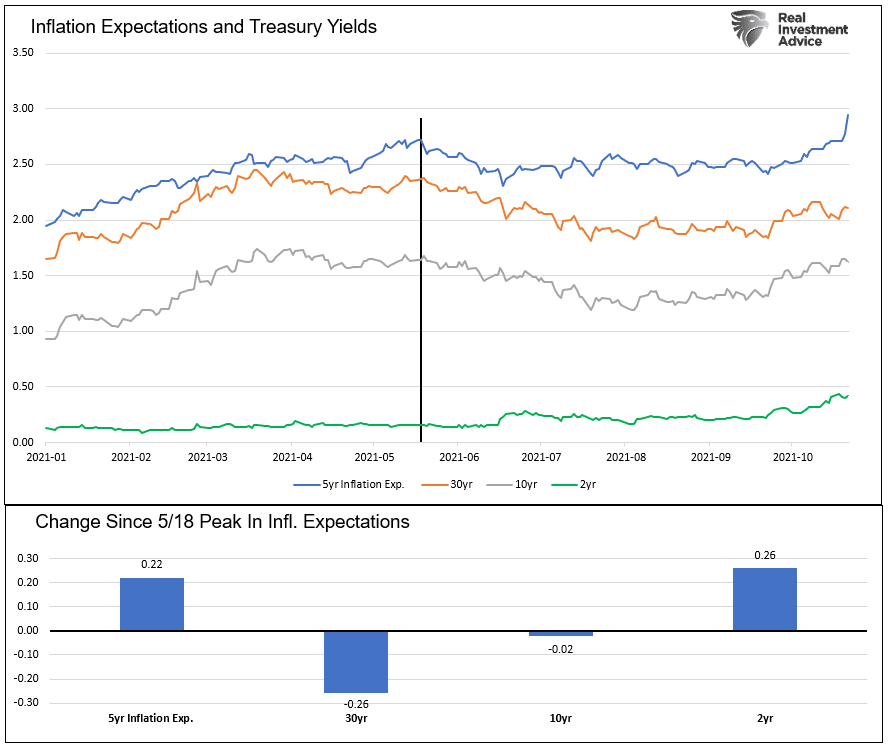
“5-year implied inflation expectations are up over 40 basis points (bps) since October 1st. They now stand at a 15+ year high of 2.94%. While inflation expectations rise, the yield curve is flattening. In this case, short maturity bonds are rising in yield much more than longer maturity bonds. The graphs below show what has happened to bond yields since the inflation expectations last peaked on May 18th. As we show the 30-year bond is 26 bps lower since then, while the 2-year note is 26 bps higher. As a result, the 2/30 yield curve has flattened 52 bps over the period.
Our portfolios are set up for the yield curve flattening. The portfolio’s largest bond holding is TLT with a duration of 20 years. The benchmark, AGG, has a duration of 8 years. The models are also not fully vested in the fixed income sleeves to further protect against higher yields.’ – Michael Lebowitz
Conclusion
As noted throughout this week’s message, there are many reasons to suspect the recent rally will fail as the impact of weaker economic growth begins to temper expectations. However, that is not the case today, and the current momentum can undoubtedly carry the markets higher next week.
We will continue to maintain our more bullish stance from that position until the market begins to falter. After that, numerous support levels and warning triggers will tell us it is time to become more “risk-averse” in our allocations.
While that time is not now, don’t become overly complacent, thinking this market can only go higher. Markets have a nasty habit of doing the unexpected just when you feel you have everything figured out.
Have a great weekend.
By Lance Roberts, CIO
Market & Sector Analysis
Analysis & Stock Screens Exclusively For RIAPro Members
Discover All You Are Missing At RIAPRO.NET
Come find out what our RIAPRO.NET subscribers are reading right now! Risk-Free For 30-Day Trial.
- Sector & Market Analysis
- Technical Gauge
- Fear/Greed Positioning Gauge
- Sector Rotation Analysis (Risk/Reward Ranges)
- Stock Screens (Growth, Value, Technical)
- Client Portfolio Updates
- Live 401k Plan Manager
THE REAL 401k PLAN MANAGER
A Conservative Strategy For Long-Term Investors

Attention: The 401k plan manager will no longer appear in the newsletter in the next couple of weeks. However, the link to the website will remain for your convenience. Be sure to bookmark it in your browser.

Commentary
The market is now back to a highly overbought position after a sizable rally over the last 7-days. The triggering of the underlying MACD “buy signals” suggests we have entered into the seasonally strong period of the year, which supports keeping allocation long-biased.
However, this is probably a decent opportunity to rebalance holdings and reduce your risk heading into November. In the short term, we suggest maintaining exposures in plan portfolios but start putting new contributions back into cash or stable value holdings for now.
While we have not removed international, emerging, small and mid-cap funds from the allocation model, we suggest avoiding these areas for now and moving those allocations to domestic large-cap.
If you are close to retirement or are concerned about a pickup in volatility, there is nothing wrong with being underweight equities. However, there is likely not a lot of upside in markets heading into next year.
Model Descriptions
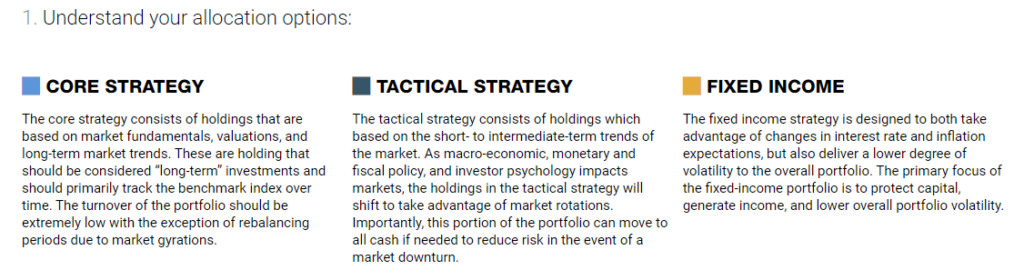
Choose The Model That FIts Your Goals
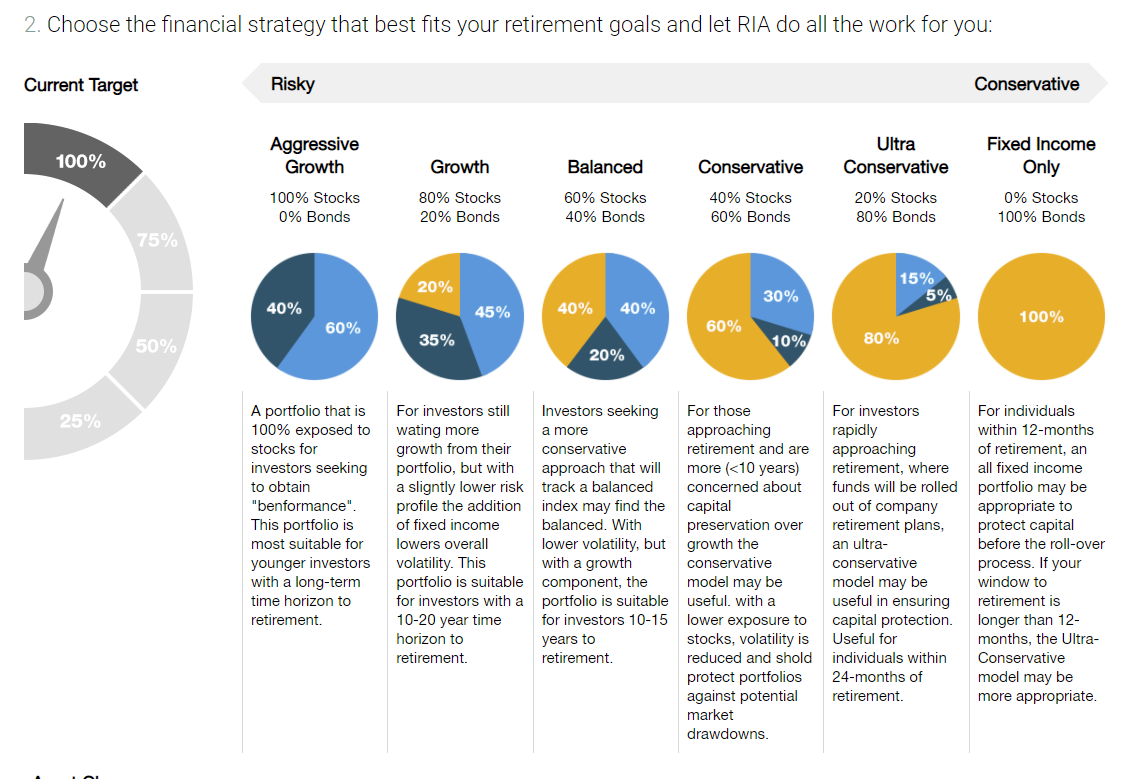
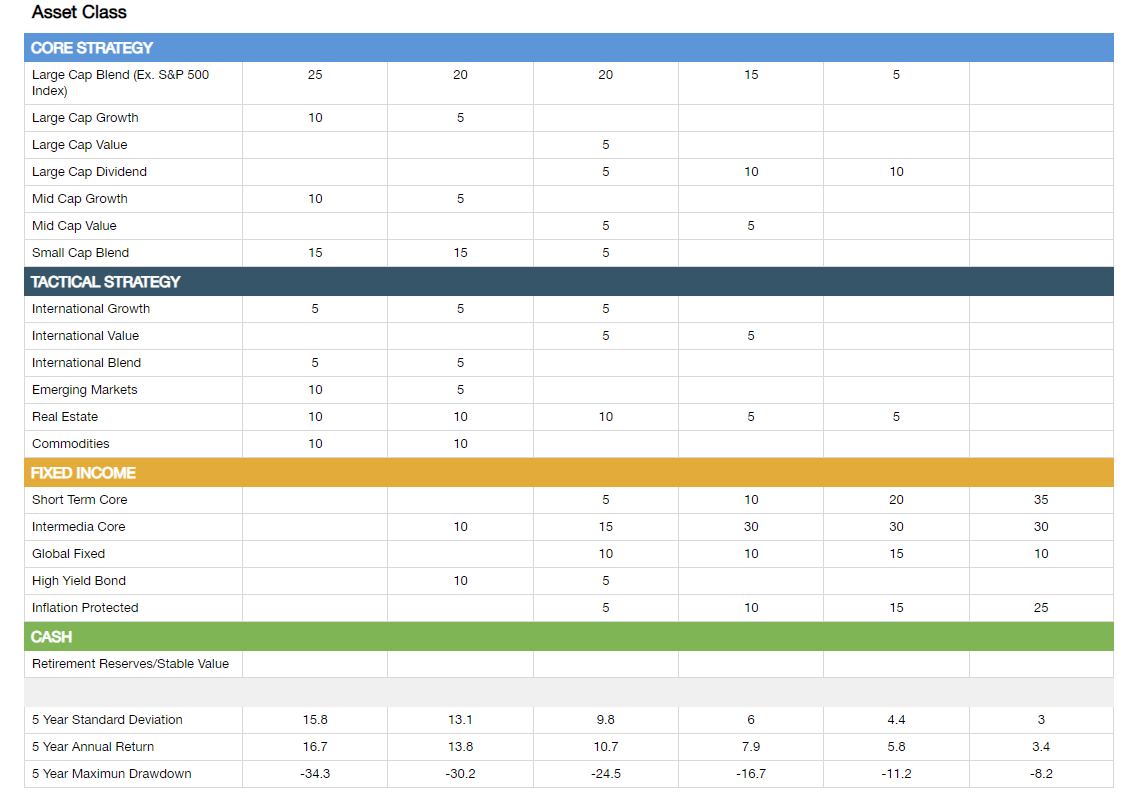
Model Allocations
If you need help after reading the alert, do not hesitate to contact me.
Or, let us manage it for you automatically.

401k Model Performance Analysis
Model performance is a two-asset model of stocks and bonds relative to the weighting changes made each week in the newsletter. Such is strictly for informational and educational purposes only, and one should not rely on it for any reason. Past performance is not a guarantee of future results. Use at your own risk and peril.

Have a great week!


