
Inside This Week’s Bull Bear Report
- Liquidation Event
- How We Are Trading It
- Research Report – Fund Blows And Bond Yields
- Youtube – Before The Bell
- Market Statistics
- Stock Screens
- Portfolio Trades This Week
Market Update & Review
The market fell sharply in what felt more like a liquidation event early in the week. As I noted in last week’s newsletter:
“The market held support at the 150-DMA, which is acting as minor support. A violation of that level will see the markets quickly test the 200-DMA. If this market will maintain its bullish footing, it must hold support and begin to firm up next week.“
The market failed to hold that initial support level and quickly tested the 200-DMA as expected. The good news is the market bounced sharply off support levels on Friday, reducing the MACD “sell signal.” If the market can follow through on this rally early next week, we could see a “buy signal” triggered.

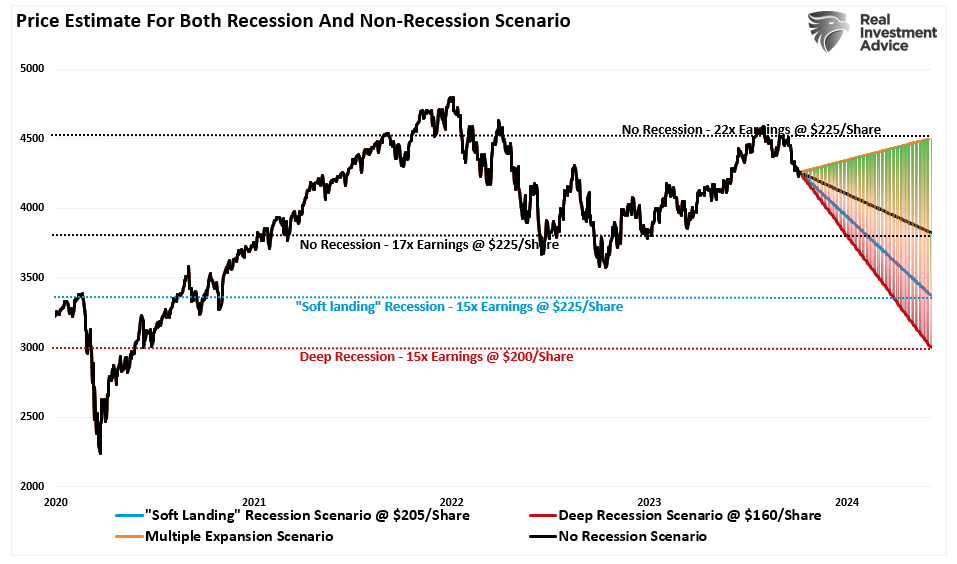
As discussed in February, our year-end target remains 4500 on the S&P, given a “no recession” scenario. To wit:
“Adding the bullish scenario to our projection chart gives us a full range of options for 2023, which run the gamut from 4500 to 2700, depending on the various outcomes.”
Of course, since then, the markets have rallied sharply, and earnings estimates have improved. Therefore, if I reapply the valuation model, we can update the price estimates for both recession and non-recession scenarios. Our target of 4500 by year-end remains, but our bottom target has risen to 3000 due to increased estimates. Such is still a 1500-point range with downside risk dwarfing upside potential.
As we will discuss in today’s commentary, the decline since June was as expected. However, the selling at the beginning of the week seemed like a liquidation event. Given the reduction in asset prices, a drop in bullish sentiment, and technically oversold conditions, the potential year-end rally remains.
Need Help With Your Investing Strategy?
Are you looking for complete financial, insurance, and estate planning? Need a risk-managed portfolio management strategy to grow and protect your savings? Whatever your needs are, we are here to help.

Still An Expected Correction
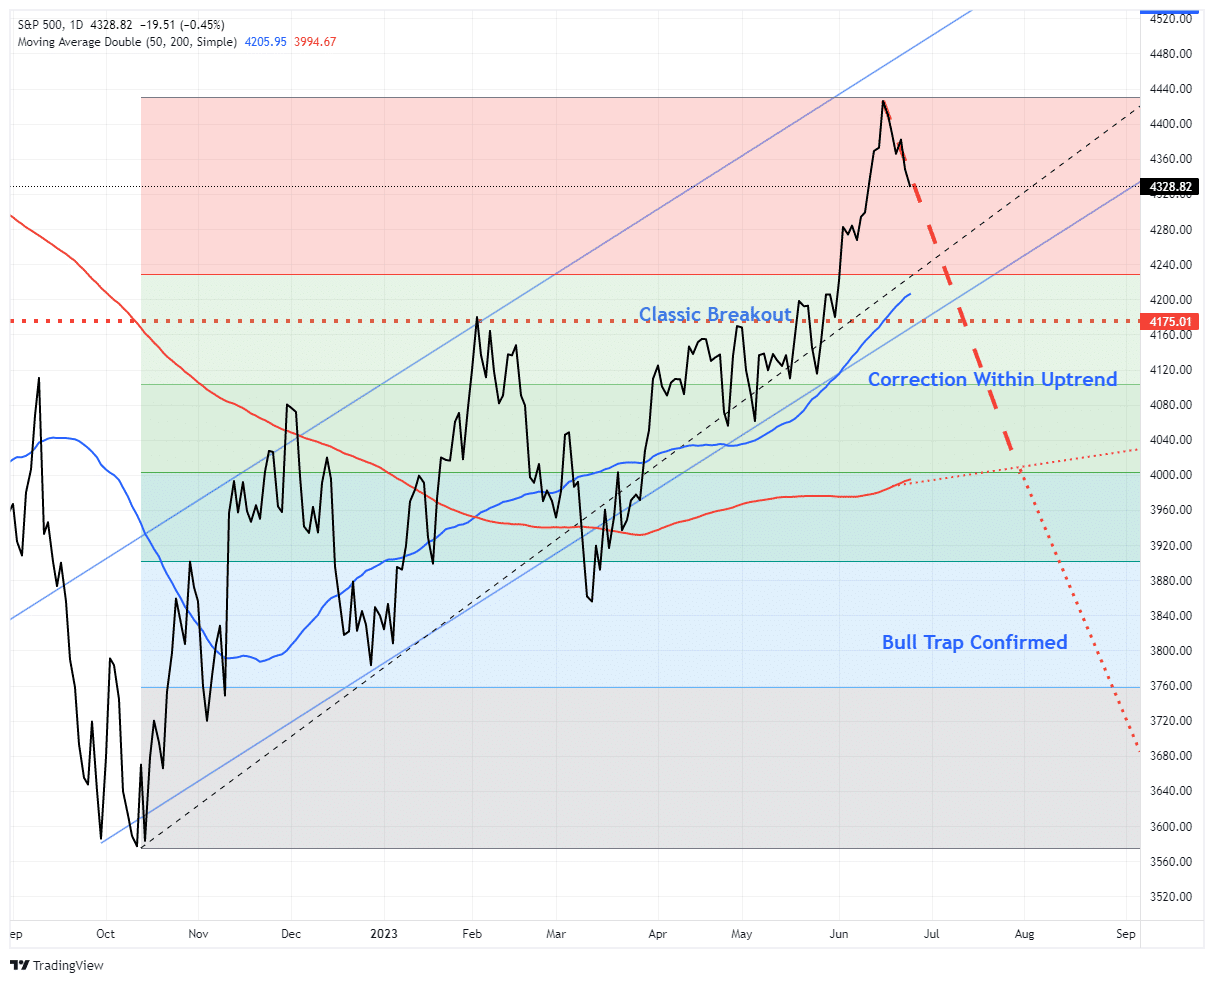
As noted above, October started with a continuation of the August/September sell-off. While media headlines are flush with concerns about higher interest rates, the selloff remains orderly and within the confines of a normal intra-year correction. As we noted on June 27th in “Bull Trap Or Bull Market:”
“If we assume a correction started from the market high on June 14th, 2023, the [Fibonnaci] retracement sequence provides mathematical levels of potential support during a retracement. A roughly 5% correction would reach the initial 23.6% retracement. At that level, it will likely intersect with the 50-day moving average. The next level of a corrective process would require a 7% decline to the 38.2% retracement and a nearly 10% decline to the 50% retracement to the 200-day moving average.
Notably, in any given year, bullish or bearish, a 5-10% correction is entirely normal and healthy. Such corrective actions are opportunities to increase portfolio equity risk.“
The chart below is the projection of the potential correction from that article.
The analysis turned out differently than expected in June, as the market did not peak until July. However, the correction remains within the expected range, with the 200-DMA acting as key support.
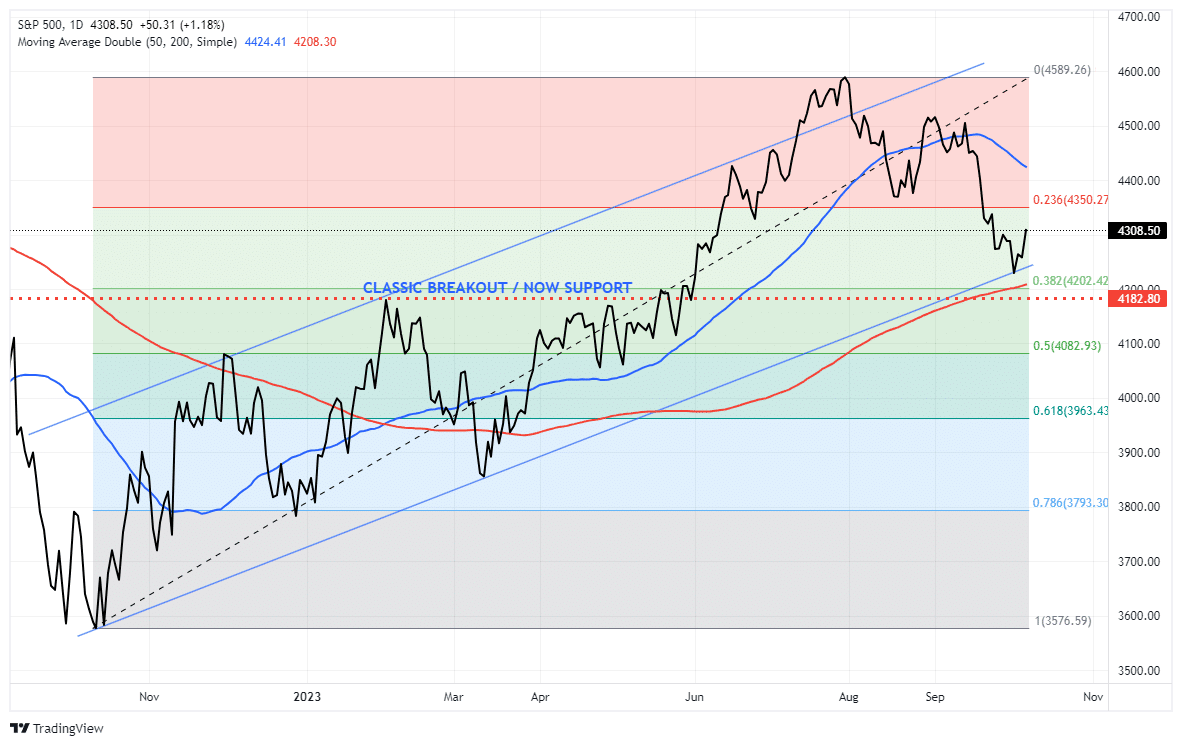
As noted, the correction remains mostly as expected. However, as discussed in that June article, there is certainly a risk if the 200-DMA is decisively broken.
“However, if the market breaks the 200-day moving average and the 50% retracement level, such would suggest that the recent rally from the October lows is indeed a ‘bull trap.’ Such a violation would change the portfolio management dynamic from ‘buying dips’ back to ‘selling rallies’ and a reduction of overall equity risk.“
While we have been buying the dip and rebalancing our equity exposure over the last month, if there is a confirmed break of the 200-DMA, we will begin to reduce risk on rallies. Fortunately, the market rallied off that support level on Friday, giving us some breathing room heading into next week.
With that foundation in place, the sell-off this past week seemed abnormal and was more akin to a liquidation event.
The question is, did something break?
A Liquidation Event
In September 2018, the Fed was hiking rates under the premise that the current rate was “nowhere near the neutral rate.” Following that statement, the market declined by 20%, and Mr. Powell was under tremendous pressure from the Trump Administration to ease the pressure on the economy. By July 2019, the Fed had cut rates to zero and, by September, had launched a massive “repurchase” program due to a breakdown of overnight lending. At the time, the economy was strong, and there was no fear of a recession despite alarm bells going off across the economy and yield curve.

What we didn’t know then, and found out later, was that the cut in rates and the launch of the “repo” program was to bail out hedge funds like Citadel Capital that were on the brink of a liquidation event.
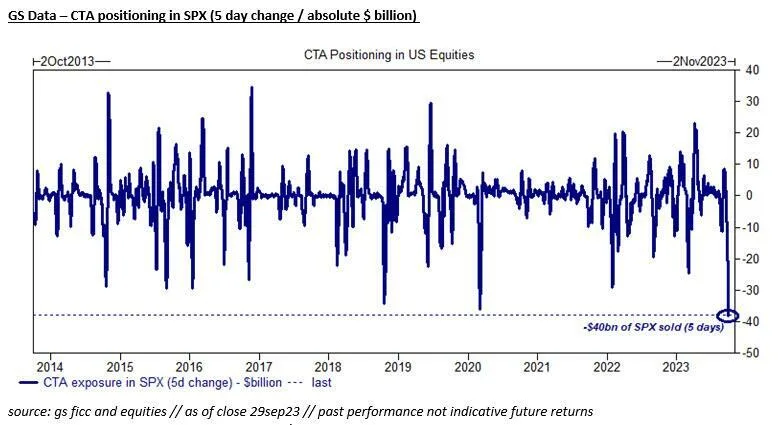
While what is happening behind the scenes is uncertain, similar pressures are overhanging the market. As interest rates pushed higher, there was a rapid reversal in equity positioning. Such a quick disposition in equity holdings certainly is reminiscent of a liquidation event rather than typical selling. We previously saw similar liquidation events in March 2020 and late 2018. The recent equity liquidation was the largest on record.
As discussed in “October Weakness,” the current round of weakness is not uncommon for this time of year.
“The S&P 500 index seasonality suggests that weakness in the last two weeks of September and the first two weeks of October is common.”
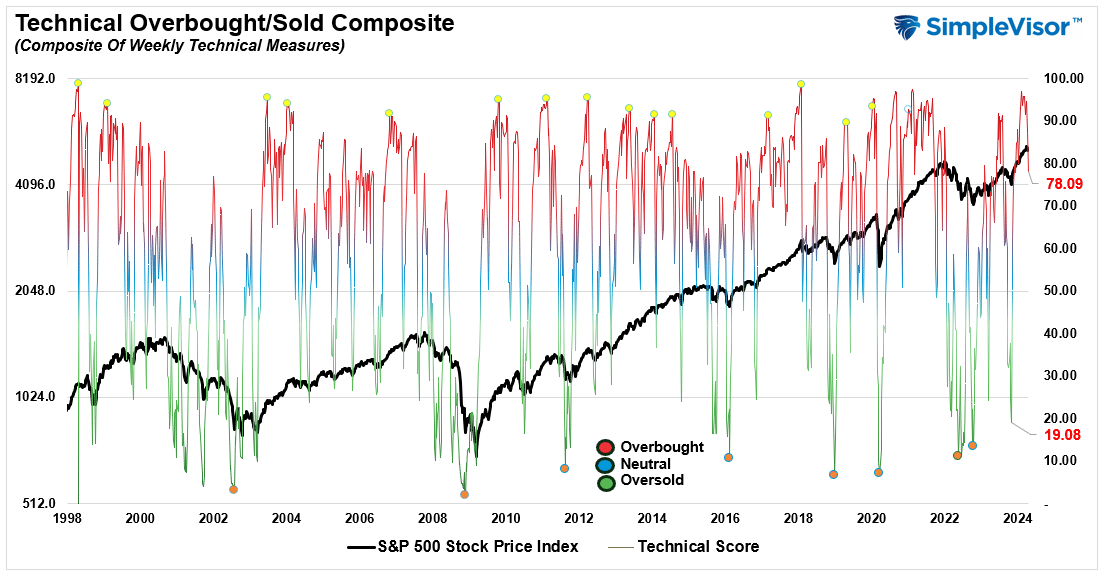
However, with markets deeply oversold short term, investor sentiment negative, and positioning becoming more underweight, there is the potential for a bounce into year-end. In particular, our technical composite gauge is now at levels that have historically supported relatively strong rallies.
Furthermore, professional money managers tend to “Sell Bottoms.” Last week, the equity exposure index fell below 40%, which is normally close to or at market bottoms.

Lastly, the put/call ratio has climbed sharply to levels previously denoting short-term market bottoms.
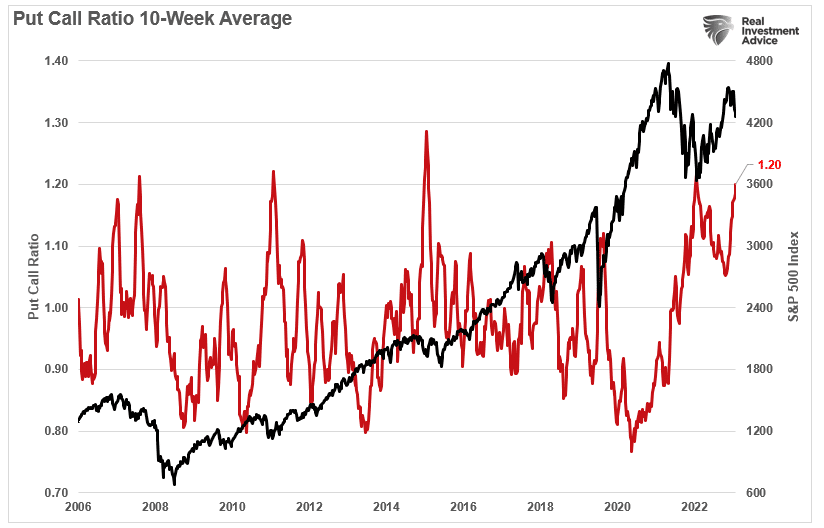
The current negativity and negative positioning backdrop will likely fuel a reflexive rally that could last into year-end. However, that rally should most likely be sold into as interest rates continue to drive the ship for now.
Interest Rates Are Driving The Ship
This past week, we have seen similar pressures on the market as yields have risen and stocks have come under pressure. The rise in yields is much less about headline risk (i.e., strong economic data) and more about the enormous shorting of bonds by computerized trading programs pressuring bond prices lower. As discussed in yesterday’s #MacroView blog:
“The most recent COT report shows there is a record number of short positions against Treasury bonds currently. That “selling” pressure has pushed prices lower and yields higher, as shown below. Notice that we saw a similar episode during the “Taper Tantrum” in 2018.”
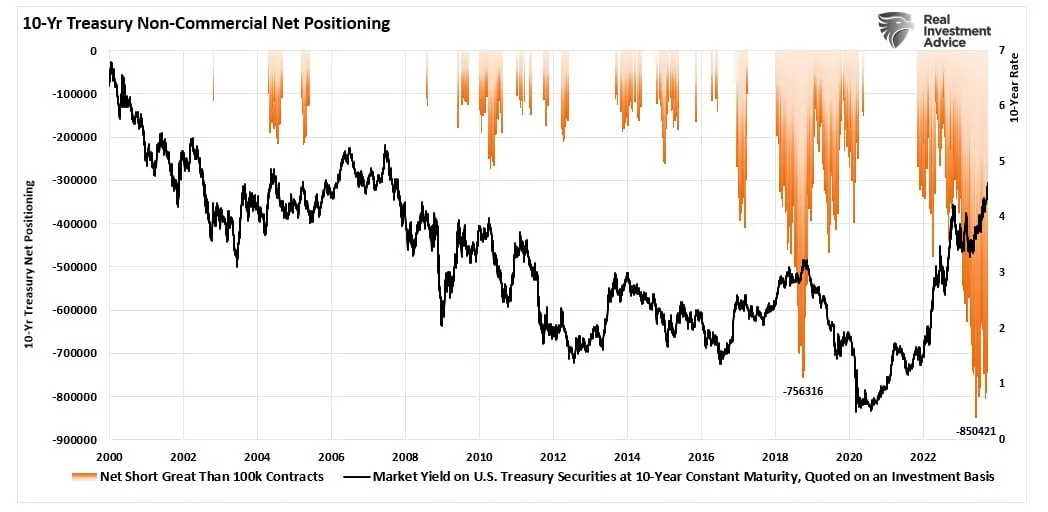
“Notably, when something “breaks,” those heavily “short” Treasury bond traders will be forced to cover those speculative positions. In 2018, the reversal of those speculative short positions on bonds was forced to cover as the Federal Reserve stepped in with a massive “reverse repo” program to bail out hedge funds.”
The recent short-term turmoil in stocks and bonds is undoubtedly reminiscent of the last time we saw a liquidation event underway. It is also unsurprising that the risks imposed on a heavily indebted economy by higher rates always precede an economic, financial, or recessionary event.

As noted by TheStreet.com recently:
“It is clear that interest rates are driving the ship, but that ship could be on the cusp of taking a major turn. Maybe this time is different, but we doubt it. The odds favor an eventual unwind of the overly bearish 10-year note trade. The massive amount of short-covering could easily push yields back into the 2% handle.”
A liquidation event requiring another Fed response will cause that.
How We Are Trading It
I want to repeat our discussion from last week, as it provides an essential guideline for navigating current markets.
“There are plenty of reasons to be very concerned about the market over the next few months. Given the market leads the economy, we must respect the market’s action today for potentially what it is telling us about tomorrow. Therefore, there are some actions we can take to navigate whatever path the market chooses.”
- Move slowly. There is no rush to make dramatic changes. Doing anything in a moment of “panic” tends to be the wrong thing.
- If you are overweight equities, DO NOT try to fully adjust your portfolio to your target allocation in one move. Again, after significant declines, individuals feel like they “must” do something. Think logically about where you want to be and use the rally to adjust to that level.
- Begin by selling laggards and losers. These positions were dragging on performance as the market rose, and they led on the way down.
- Add to sectors or positions performing with or outperforming the broader market if you need risk exposure.
- Move “stop-loss” levels up to recent lows for each position. Managing a portfolio without “stop-loss” levels is like driving with your eyes closed.
- Be prepared to sell into the rally and reduce overall portfolio risk. You will sell many positions at a loss simply because you overpaid for them. Selling at a loss DOES NOT make you a loser. It just means you made a mistake.
- If none of this makes sense, please consider hiring someone to manage your portfolio. It will be worth the additional expense over the long term.
Continue to follow these rules until the forward view on the markets begins to firm. While last week’s liquidation event was cause for concern, adhering to the investment rules can keep you grounded during increased volatility. Periods like this are never fun, but the market never goes straight up or down. Use reflexive rallies to rebalance your risk as needed.
See you next week.
Research Report

Subscribe To “Before The Bell” For Daily Trading Updates
We have set up a separate channel JUST for our short daily market updates. Please subscribe to THIS CHANNEL to receive daily notifications before the market opens.
Click Here And Then Click The SUBSCRIBE Button
Subscribe To Our YouTube Channel To Get Notified Of All Our Videos
Bull Bear Report Market Statistics & Screens

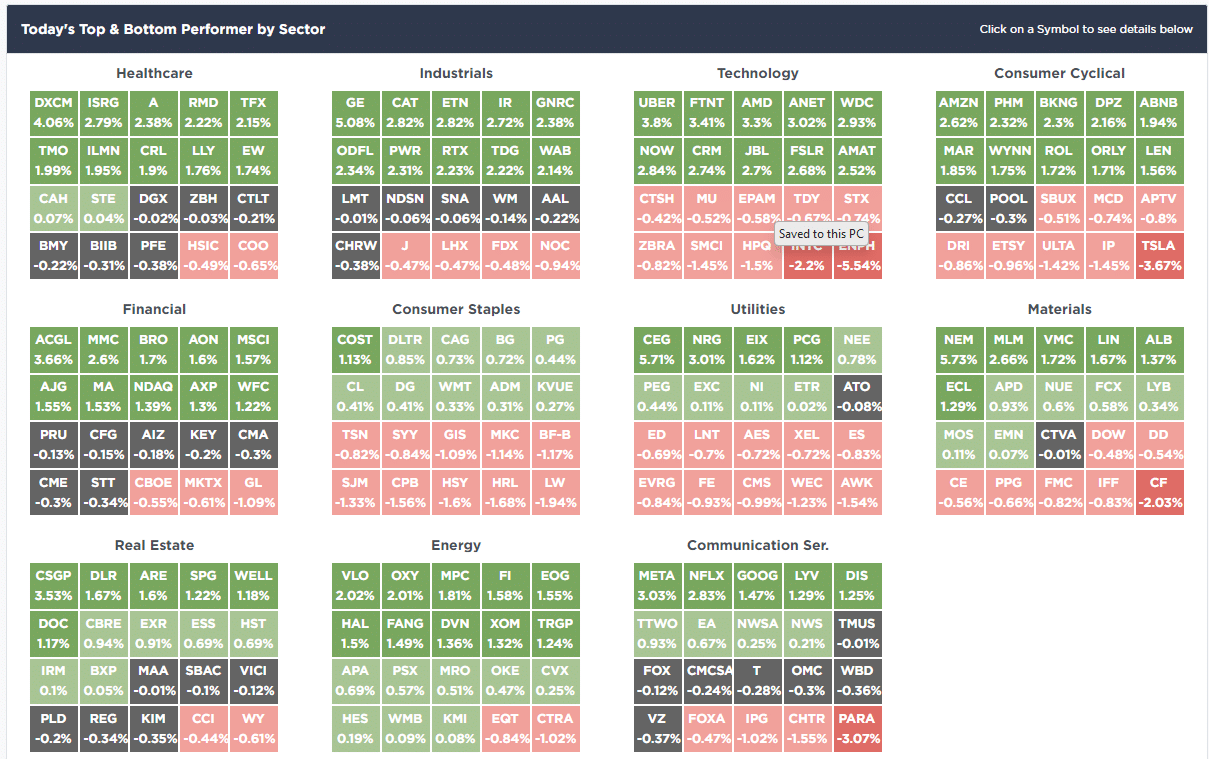
SimpleVisor Top & Bottom Performers By Sector
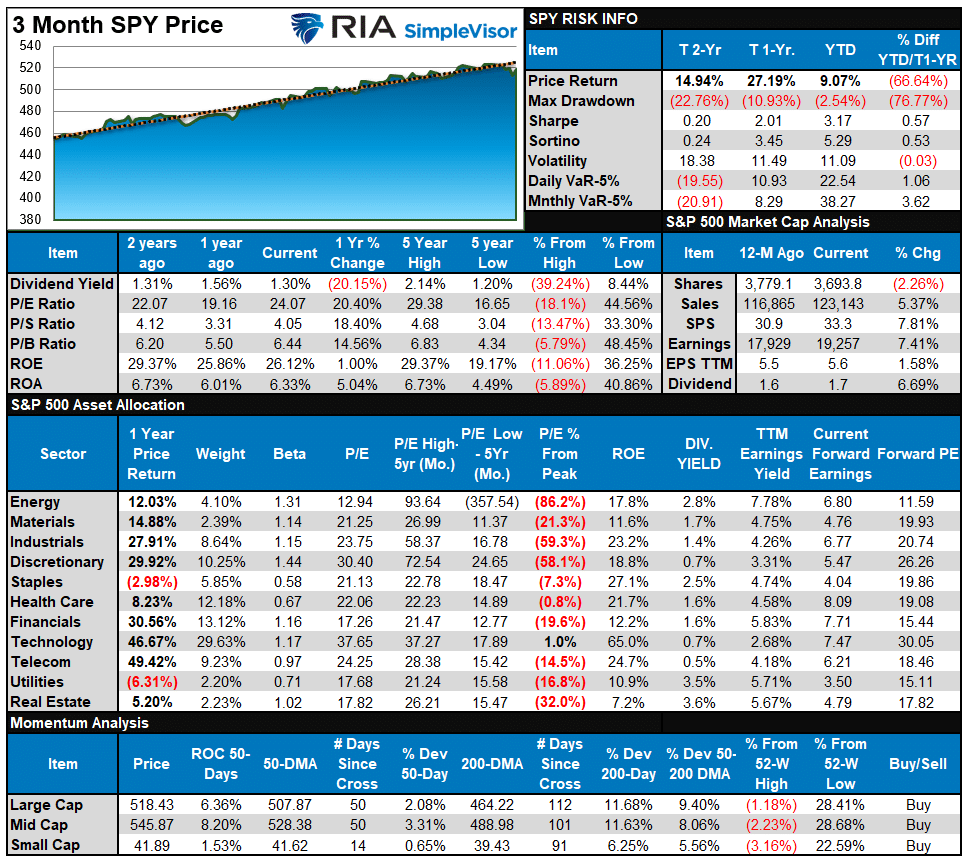
S&P 500 Weekly Tear Sheet
Relative Performance Analysis
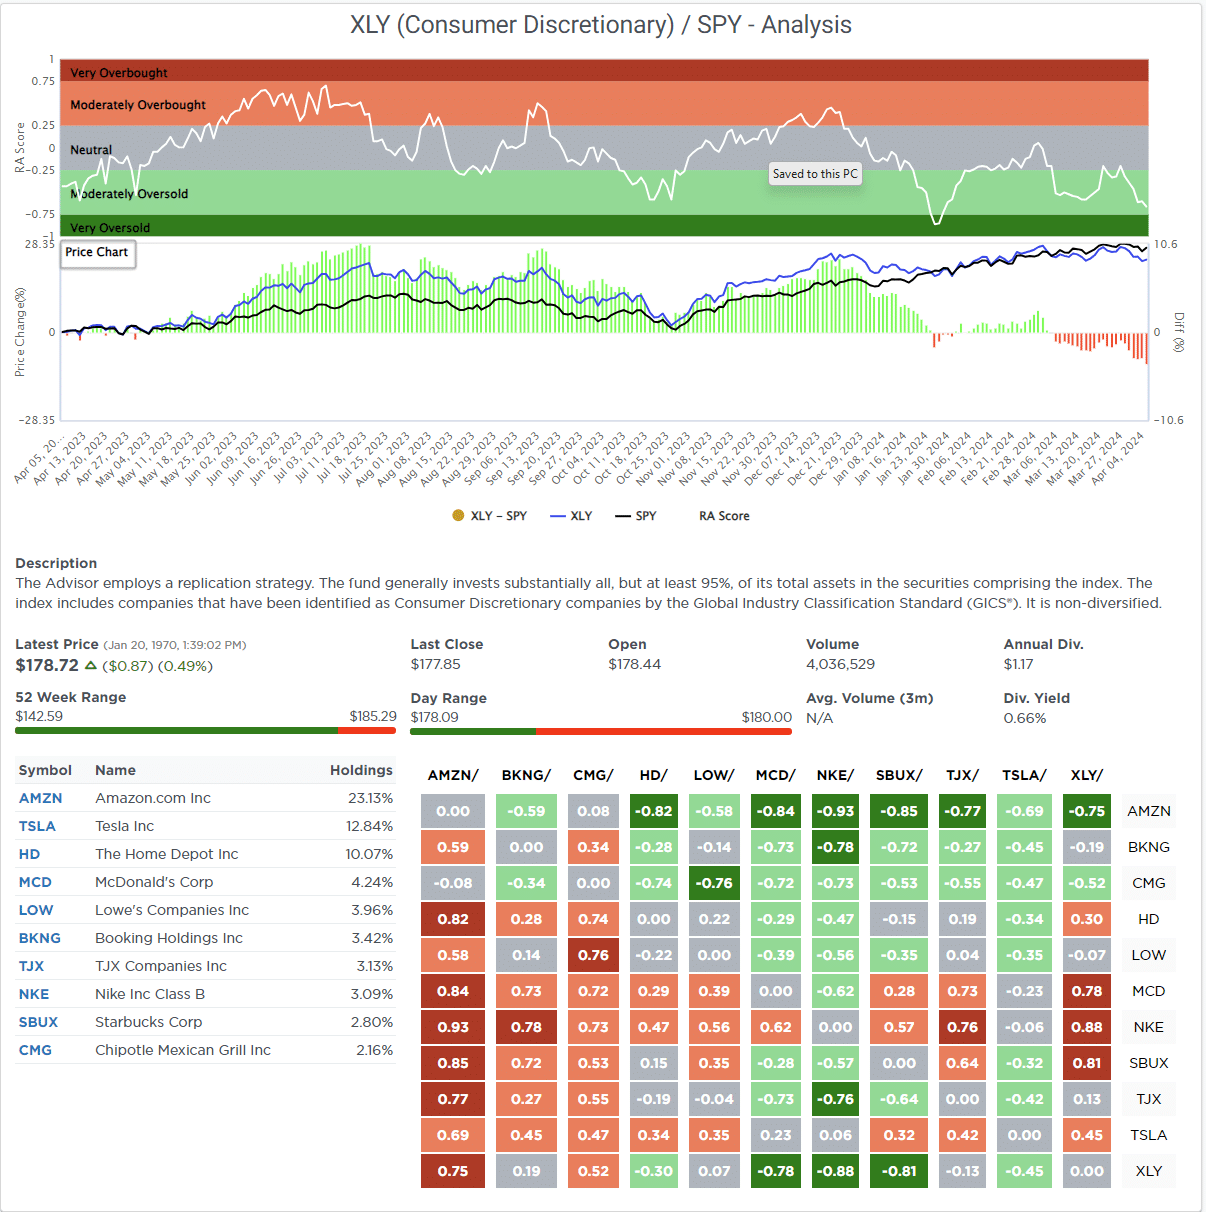
Last week, we noted that most markets and sectors were oversold after the sell-off.
“The rally did not manifest this week, but a counter-trend bounce is highly likely with most markets and sectors in oversold territory and the beginning of the new quarter ahead. This analysis is confirmed by the risk/reward ranges shown below.”
On Friday, it looked like the bounce started to manifest itself after tough price action early in the week. Technology is leading the rebound and is moving into more overbought territory, with Bonds remaining deeply oversold along with Staples. Most other sectors and markets remain oversold, so we could see some additional moves higher this coming week.

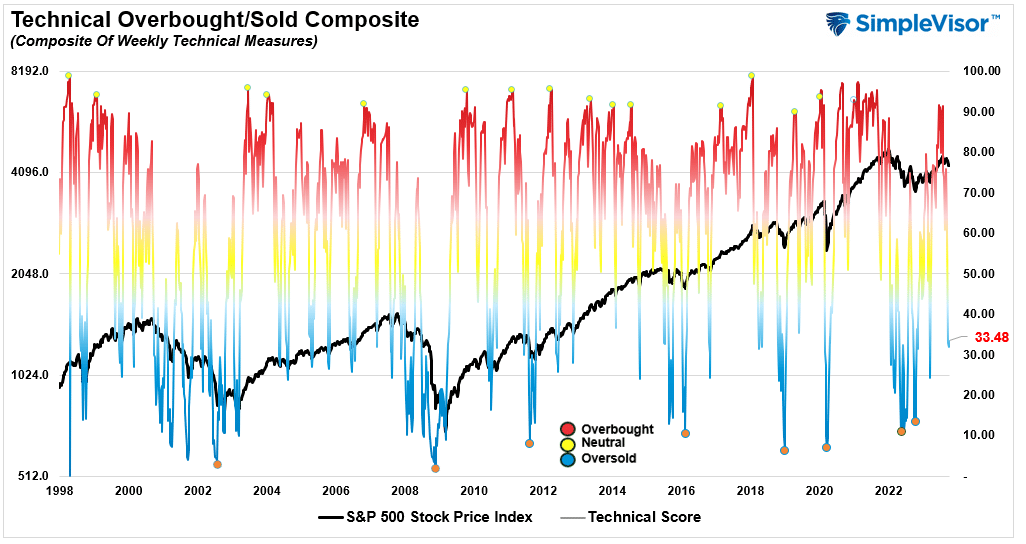
Technical Composite
The technical overbought/sold gauge comprises several price indicators (R.S.I., Williams %R, etc.), measured using “weekly” closing price data. Readings above “80” are considered overbought, and below “20” are oversold. The market peaks when those readings are 80 or above, suggesting prudent profit-taking and risk management. The best buying opportunities exist when those readings are 20 or below.
The current reading is 33.48 out of a possible 100.
Portfolio Positioning “Fear / Greed” Gauge
The “Fear/Greed” gauge is how individual and professional investors are “positioning” themselves in the market based on their equity exposure. From a contrarian position, the higher the allocation to equities, the more likely the market is closer to a correction than not. The gauge uses weekly closing data.
NOTE: The Fear/Greed Index measures risk from 0 to 100. It is a rarity that it reaches levels above 90. The current reading is 37.25 out of a possible 100.

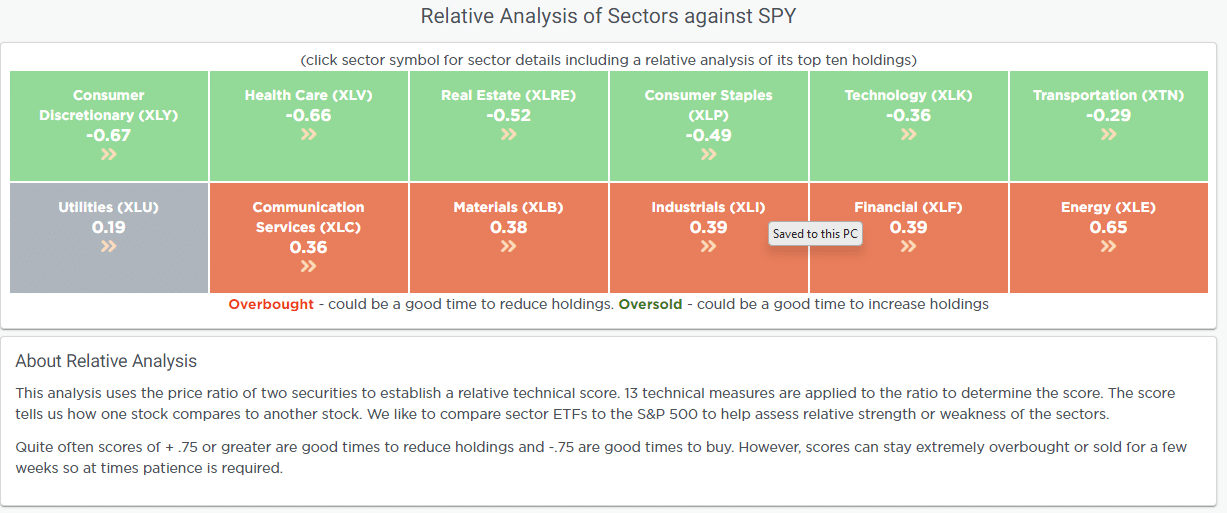
Relative Sector Analysis
Most Oversold Sector Analysis
Sector Model Analysis & Risk Ranges
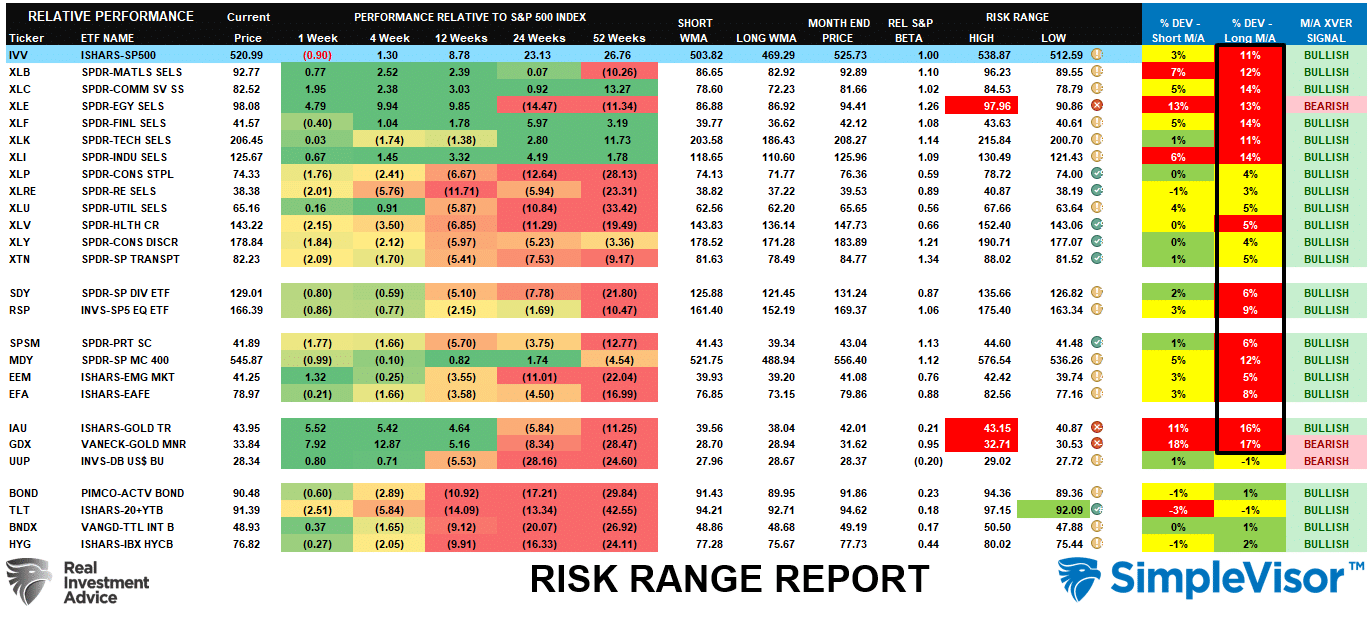
How To Read This Table
- The table compares the relative performance of each sector and market to the S&P 500 index.
- “MA XVER” (Moving Average Crossover) is determined by the short-term weekly moving average crossing positively or negatively with the long-term weekly moving average.
- The risk range is a function of the month-end closing price and the “beta” of the sector or market. (Ranges reset on the 1st of each month)
- The table shows the price deviation above and below the weekly moving averages.
The rally on Friday relieved some of the deeply oversold conditions on a risk/reward basis. However, Energy, Staples, and Bonds remain oversold on their respective monthly ranges. Therefore, we could also see some opportunities for rebounds in those sectors. Everything remains within normal monthly tolerances for now, so some additional upside in the markets next week is likely.
Weekly SimpleVisor Stock Screens
We provide three stock screens each week from SimpleVisor.
This week, we are searching for the Top 20:
- Relative Strength Stocks
- Momentum Stocks
- Fundamental & Technical Strength
(Click Images To Enlarge)
R.S.I. Screen
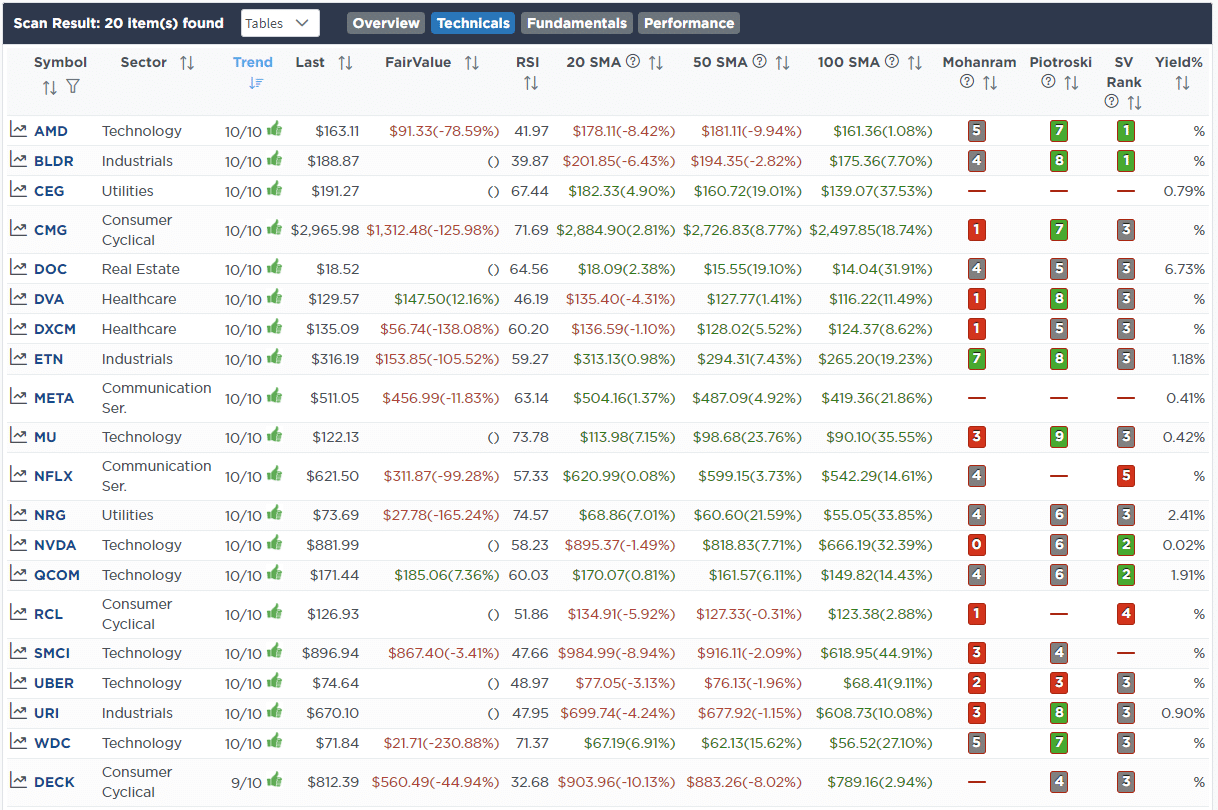
Momentum Screen
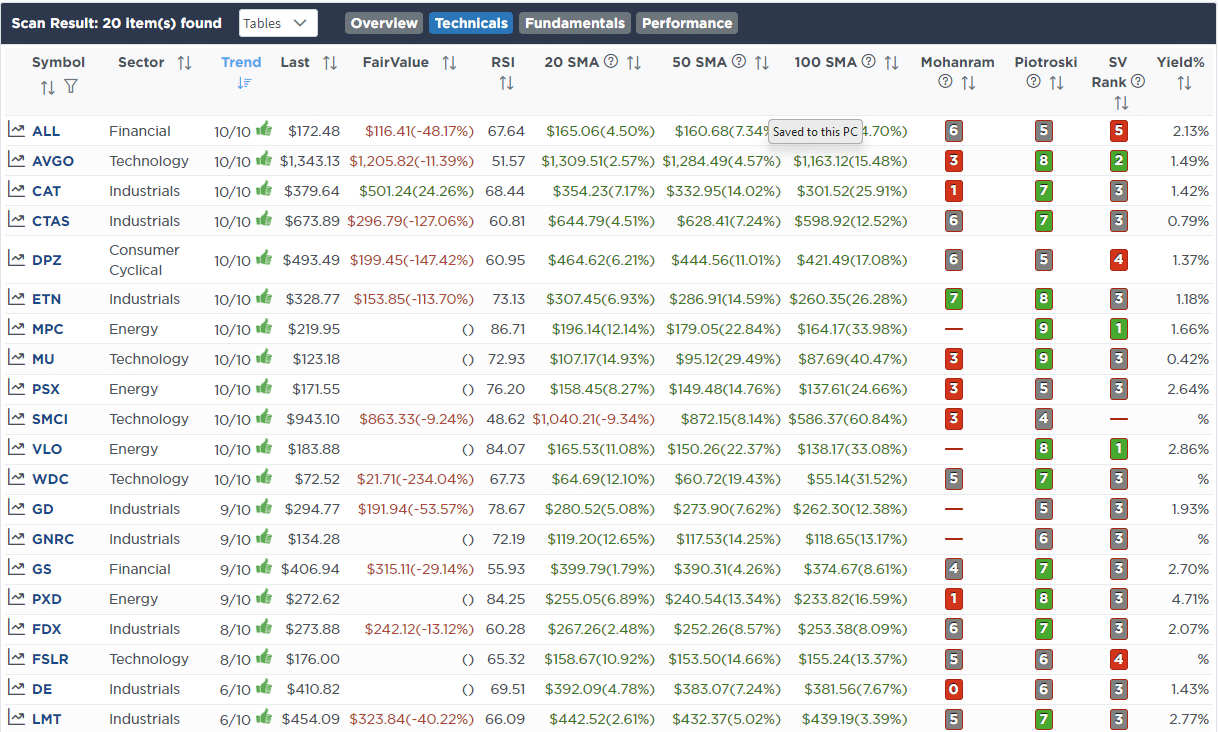
Fundamental & Technical Strength

SimpleVisor Portfolio Changes
We post all of our portfolio changes as they occur at SimpleVisor:
October 2nd
This morning, we added a little tech exposure to both models. Tech led the way lower and appears to be the first sector to trigger buy signals. If the upward trend is to resume, it’s likely that the stocks that led the way higher are likely to continue. We added the S&P Semiconductor ETF (SMH) instead of the iShares Technology ETF (XLK) in the sector model to get more exposure to the chip sector. We chose SMH over SOXX as it is lower dollar-priced and has more exposure to NVDA and TSM. They have performed similarly. In the Equity model, we increased weightings in Nvidia (NVDA) and AMD (AMD).
Equity Model
- Increase Nvidia (NVDA) from 1% to 2% of the portfolio.
- Add to AMD (AMD) and bring its portfolio weighting to 2.5%
ETF Model
- Add 2% of the S&P Semiconductor ETF (SMH) to the portfolio.
October 3rd
We sold Stryker Medical Devices (SYK) in the equity model and added 1% to Duke Energy (DUK.) SYK was an AI play that is not working at present and broke out stop loss. In the ETF model, we still own the Medical Device Makers ETF (IHI), which is currently well into 3-standard deviation oversold territory, so we are looking for a bounce to sell that position in the sector model.
DUK and the utility sector are extremely oversold. DUK sits on a very dependable support line for over ten years. Its yield is now just under 5%. XLU is already at 4% in the sector model, so we are leaving it as is for now.
Equity Model
- Sell 100% of Stryker Medical (SYK)
- Add 1% to Duke Energy (DUK)
October 6th
Trade Alert – Equity And ETF Models
This morning, we are reducing our exposure to the banking sector as we approach bank earnings later next week. We are concerned that the recent spurt higher in interest rates will result in poor headlines and CEO outlooks. We sold Truist Financial (TFC) as it technically looks much weaker than PNC Bank (PNC). However, we still like TFC in the long term and will look for a re-entry point once headline risks decrease.
Equity Model
- Sell 100% Trust Financial (TFC)
ETF Model
- Reduce the S&P Banking Sector ETF (KBE) by 1% of the portfolio.
Trade Alert – Equity Model ONLY (THIS IS NOT AN RIA CLIENT PORTFOLIO TRADE)
“As you know, we recently sold the 20-Year Bond ETF (TLT) in our client accounts and swapped it for actual 20-Year Treasury Bonds. However, in the SimpleVisor portfolio model, we are unable to get pricing for actual bonds, therefore, we swapped TLT for a longer-duration Vanguard Bond ETF (EDV.)
With that understanding, in the SimpleVisor EQUITY and ETF MODELS ONLY we are taking the opportunity of the deeply oversold condition of bonds, not to mention a near-record deviation from the 200-DMA. As such, we are adding a TRADING POSITION of EDV to our portfolios. This is a temporary position for trading purposes only, and we will sell it when bonds return to an overbought condition.
To reiterate, this trade is for the SimpleVisor account model only and NOT for RIA CLIENT ACCOUNTS that own actual bonds.
Equity & ETF Model
- Increase the Vanguard Extended Bond ETF (EDV) to 15% of the portfolio.

Lance Roberts, C.I.O.
Have a great week!

