Recession Warning? GDP Goes Negative In Q1


In this 04-29-22 issue of “Recession Warning?”
- Market Review And Update
- Recession Warning? Or Just An Anomaly.
- Portfolio Positioning
- Sector & Market Analysis
Follow Us On: Twitter, Facebook, Linked-In, Sound Cloud, Seeking Alpha
Need Help With Your Investing Strategy?
Are you looking for complete financial, insurance, and estate planning? Need a risk-managed portfolio management strategy to grow and protect your savings? Whatever your needs are, we are here to help.
Schedule your “FREE” portfolio review today.

Weekly Market Recap With Adam Taggart
Market Review & Update
Another tough week, and month, for the market. Ongoing concerns about inflation, earnings, and economic growth, continue to pressure stocks. As noted last week, there is a tremendous amount of damage in the market below the surface of the index. Nonetheless, indexes certainly got beat up last week.
As I noted last week,
“While the market is very oversold short-term, the break of the 50-dma suggests we could see a retest of the March lows next week. Such would be around 4150 on the S&P index.”
Such was indeed the case as markets tested lows on Tuesday. That sell-off led to a sharp rally on Thursday, only to retrace to lows on Friday. For the week, the market made little progress in either direction.
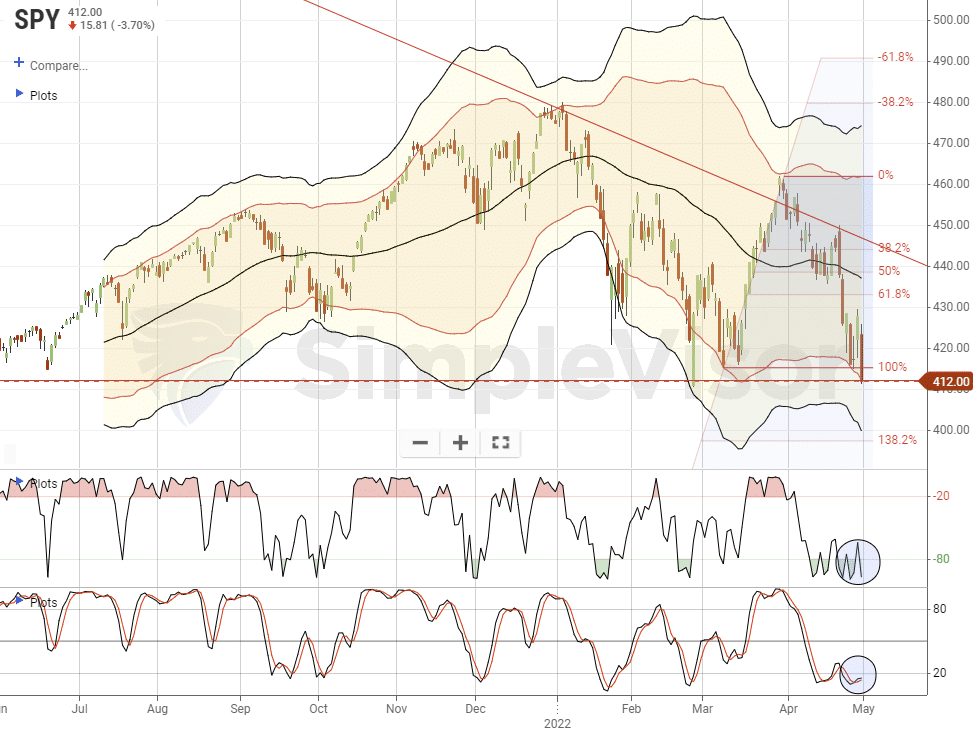
It is also essential to keep some perspective at this juncture. Yes, the S&P is down roughly 12% year-to-date and is one of the roughest yearly starts since 1970. However, don’t forget the 26% gain in 2021.
As we have noted previously, the good news, if you want to call it that, is that investors are so bearish it’s bullish. The percentage of bullish investors is currently 16% and close to a record low, leaving the bull/bear spread at -43%, a level surpassed only twice in the past 35 years. Tom Lee of Fundstrat shows that the returns following such sentiment lows tend to be good.

However, this does not mean we are about to return to a ripping bull market. As shown below, 4-or-more consecutive negative months tend to be more of an exception than the rule.
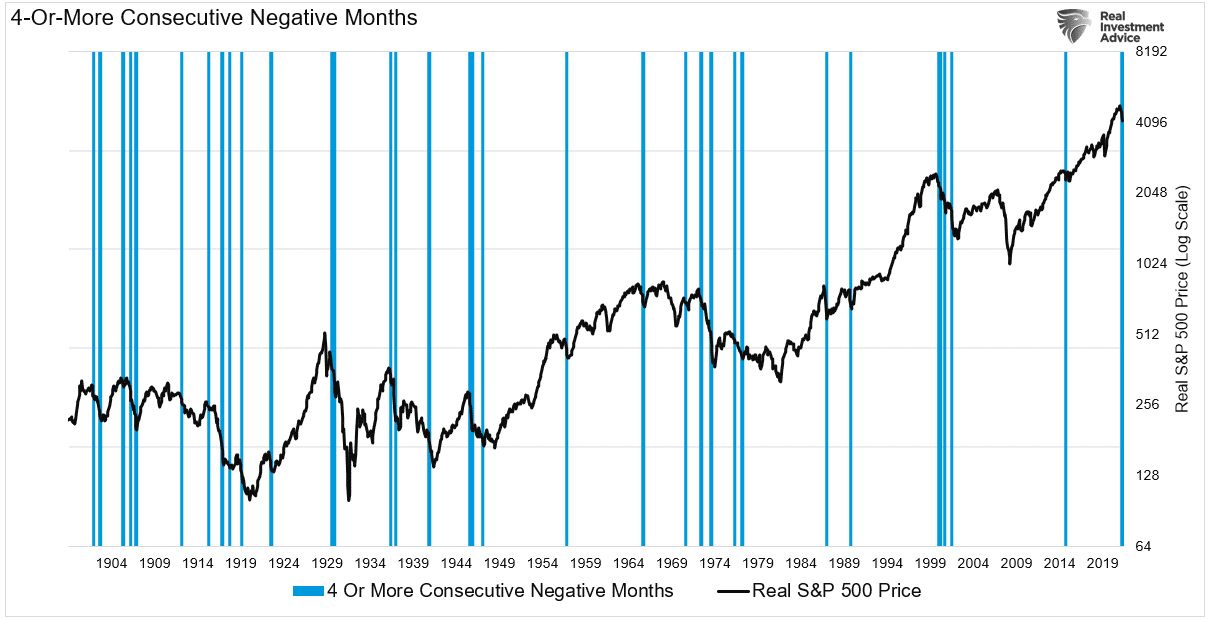
Such suggests the markets are due for a decent relief rally to reduce and rebalance risk.
Given the Q1-GDP report, that is likely good advice.

Recession Warning? Or, Just An Anomaly.
On Thursday, the Q1 GDP report came in drastically weaker than expected.
“Gross domestic product unexpectedly declined at a 1.4% annualized pace in the first quarter, marking an abrupt reversal for an economy coming off its best performance since 1984, the Commerce Department reported Thursday.” – CNBC
Notably, the market shook off the recession warning and immediately substituted the “anomaly” narrative.
“Despite the disappointing number, markets paid little attention to the report, with stocks and bond yields both mostly higher. Some of the GDP declines came from factors likely to reverse later in the year, raising hopes that the U.S. can avoid a recession.”
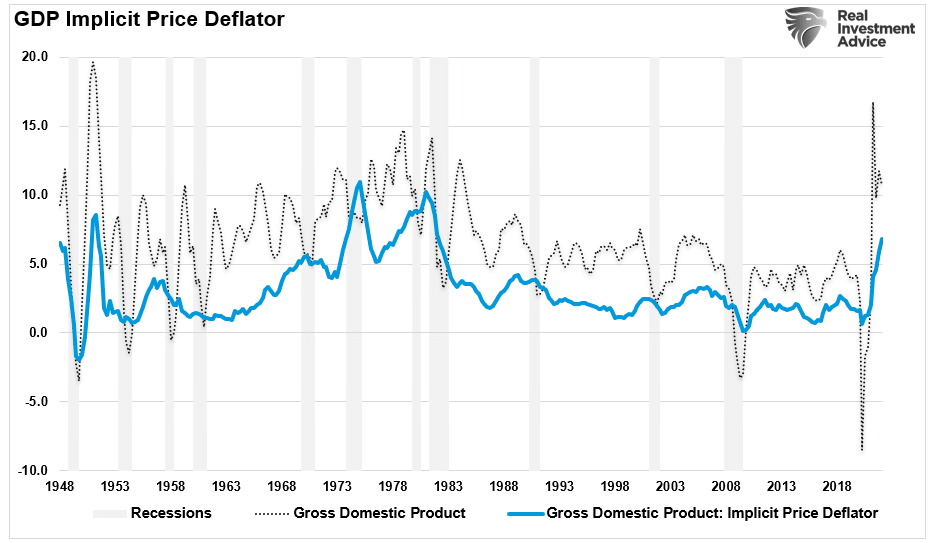
Many currently hope that much of the initial negative reading came from the surge in Covid cases and inflation that hampered spending along with the Russian invasion of Ukraine. The inflation problem, as shown below, was in the GDP deflator, which rose 8% in the first quarter. (It is worth noting that previous sharp increases in the GDP deflator tended to be recession warnings.)
One of the primary hopes for a “soft landing,” economically speaking, is that the recent dollar strength will subside, and the trade deficit (a direct input into the GDP calculation) will subside.
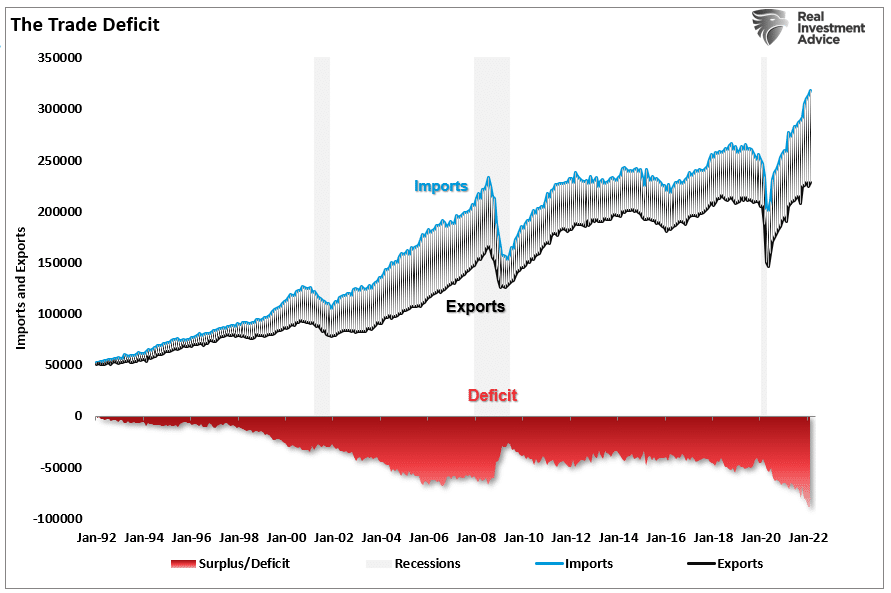
Unfortunately, such may not be the case with the ongoing economic sanctions with Russia, China shut down, and a flight to safety by foreigners into the U.S. dollar. Furthermore, periods of tighter monetary policy have also coincided with recession warnings.
“’In retrospect, this could be seen as a pivotal report,’ said Simona Mocuta, chief economist at State Street Global Advisors. ‘It reminds us of the reality that growth has been great, but things are changing and they won’t be that great going forward.’” – CNBC
I think that is a correct statement.
This Week’s MacroView
Sugar Crash
Much of the current impact on economic growth today is just the logical outcome of previous decisions to pull forward economic activity. Such was a point we discussed in March 2021.
“The expected ‘sugar rush’ from more stimulus is why the economy will ‘run hot’ and then crash.” – Sugar Rush
As noted in that article, the chart below shows annual real GDP growth rates from 2008 to the present. The surge in GDP in 2021 was the “sugar rush” of monetary interventions. Not surprisingly, as the monetary infusions reverse, economic growth “crashes” back to annual norms in 2022. (We are currently assuming 2% annual growth in 2022. However, if Q1 is not revised higher, GDP growth will likely be closer to 1.5%.)
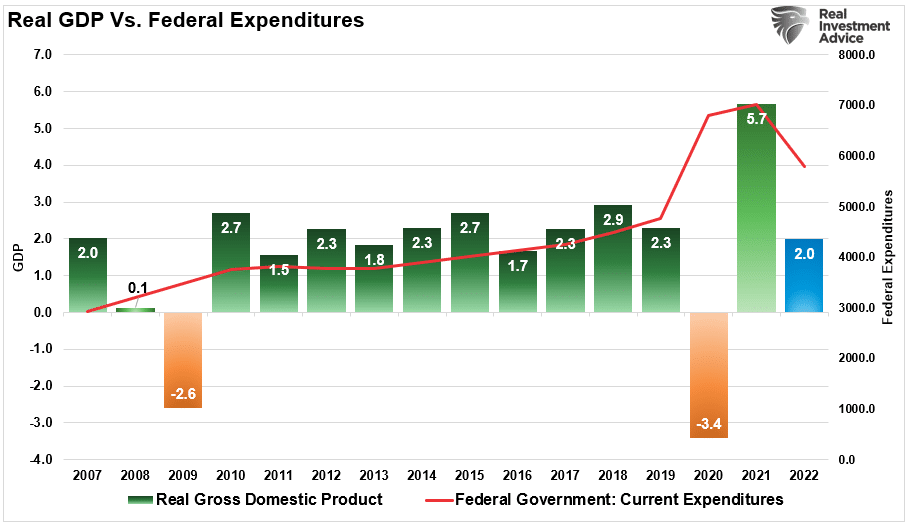
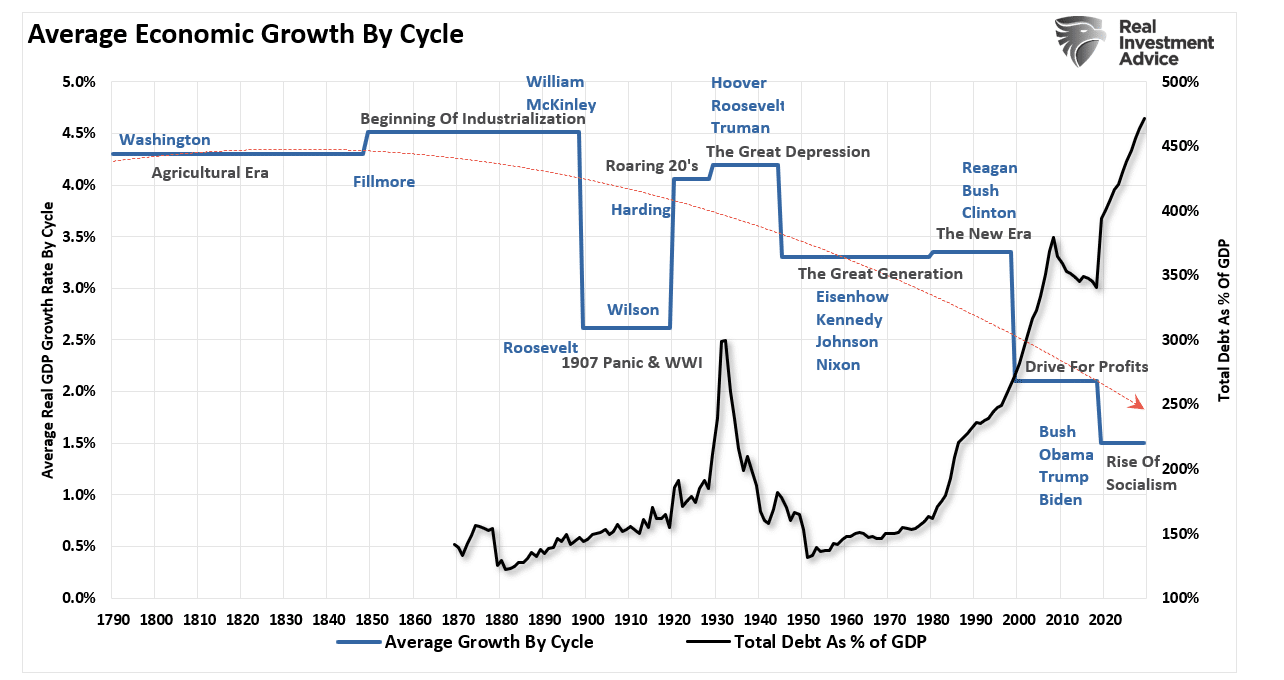
However, the more significant issue is the vast majority of the growth in the U.S. over the last decade was due to a variety of artificial inputs which are not indefinitely sustainable. From increasing federal expenditures to a litany of “bailouts,” which are a function of increased debts and deficits.

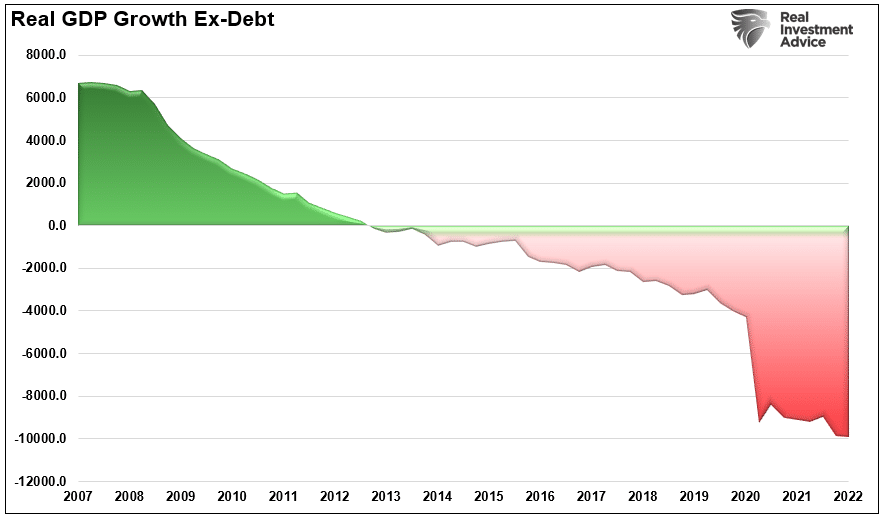
While it may appear the economy has grown in the last decade, without the massive increases in debt, ongoing deficit spending, and monetary interventions, such would not be the case.
After more than a decade of monetary and fiscal interventions totaling more than $44 Trillion and counting, the economy remains on life support. It currently requires nearly $11 in financial aid to generate $1 of economic activity.
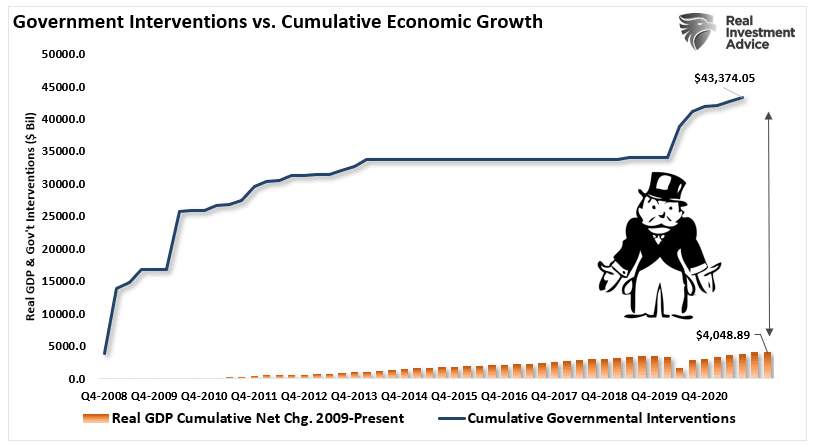
As I stated, the problem with artificial interventions is that it pulls forward economic activity. Such leaves a “void” that must get filled in the future, requiring more artificial interventions. The mathematical complication with this strategy is to create economic “growth,” each round of interventions must be greater than the last.
Soft Landing?
The obvious problem is when the “sugar” gets removed from the system.
The monetary support of money sent directly to households is now gone. We see just that in the sharp decline in disposable personal incomes. When combined with high inflation rates, the ability of consumers to make ends meet becomes problematic. They then begin to cut back on consumption leading to slower economic activity.
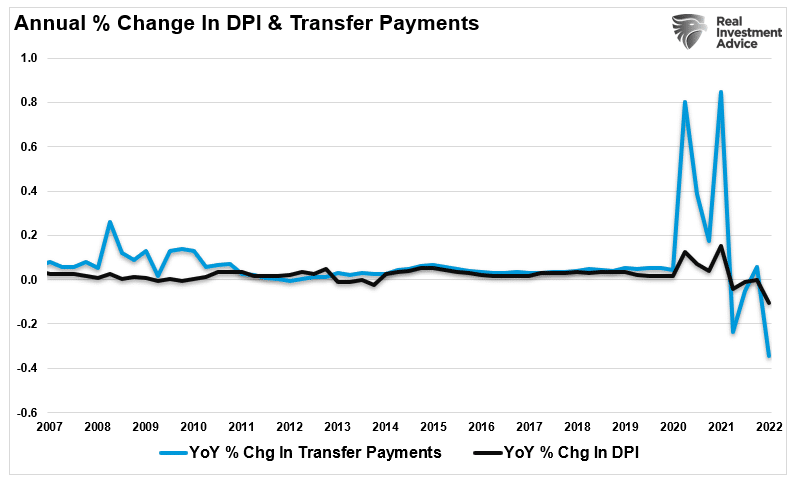
While the reversal of personal incomes is problematic enough to cause a recession (consumption makes up nearly 70% of the GDP calculation), the Federal Reserve will further tighten monetary policy over the next few months.
Despite the negative GDP print for Q1, the mainstream media suggests that the Fed can engineer a “soft landing” in the economy. Such would reduce economic growth and subsequently inflation without the economy slipping into a recession.
For the last several decades, such remains the “siren’s song” of Wall Street bulls. Unfortunately, as shown below, the Federal Reserve has never engineered a “soft landing.” Every attempt to hike rates and reduce monetary policy ultimately led to a credit-related issue, a recession, or a bear market. Sometimes, it was all three.
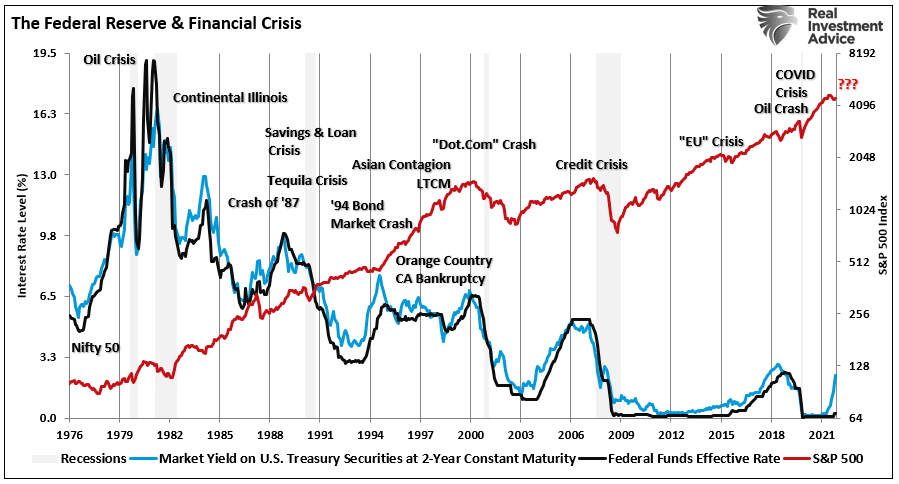
The problem for the Federal Reserve is getting trapped between needing to hike rates to combat inflation by slowing the economy and potentially causing a recession.
However, the debt problem exposes the Fed’s risk. Given economic stability was not achieved in the last decade, it is doubtful the withdrawal of monetary accommodation will be “risk-free.”
The evidence is quite clear that surging debt and deficits inhibit organic growth, and the massive debt levels are sensitive to increases in interest rates.
I suspect we just saw a recession warning, and a “soft landing” may be out of reach.

Portfolio Update
Over the past week, we made no changes to our portfolio holdings. As you may recall, we did reduce some of our growth names slightly as we awaited earnings. Google (GOOG) missed on revenue and earnings, but we are looking for an entry point to add to our long-term position. We previously sold our stake in Amazon (AMZN), which got hit hard by disappointing earnings. Microsoft (MSFT) beat on both the top and bottom lines, and we are maintaining a slightly reduced weighting. Apple (AAPL) crushed earnings and announced another $90 billion in buybacks. We will be looking to add to our stake soon.
To avoid negative earnings surprises, we also cut our weightings sharply in both Nvidia (NVDA) and AMD (AMD). While we like the positioning of both companies for the future in AI, gaming, and blockchain, any negative price shock could be an opportunity to add to our holdings.
We are keeping our reduced equity exposure at current levels. With the market deeply oversold, and Thursday’s sharp rally off of March lows, we are looking for a tradeable rally to reduce risk further and rebalance the portfolio. Such should put us in an excellent position to navigate the beginning of the Fed tightening cycle and potentially slower earnings growth this summer.

As noted last week, we continue to expect the next few weeks, and even the next couple of months could remain frustrating. However, it will be important not to overreact to that volatility and wrongly position portfolios due to an emotional reaction. More often than not, such actions turn out to be far more harmful than the market itself.
The rest of this year will likely remain just as challenging as it started.
Continue to focus on risk controls.
Have a great week.
Market & Sector Analysis
S&P 500 Tear Sheet
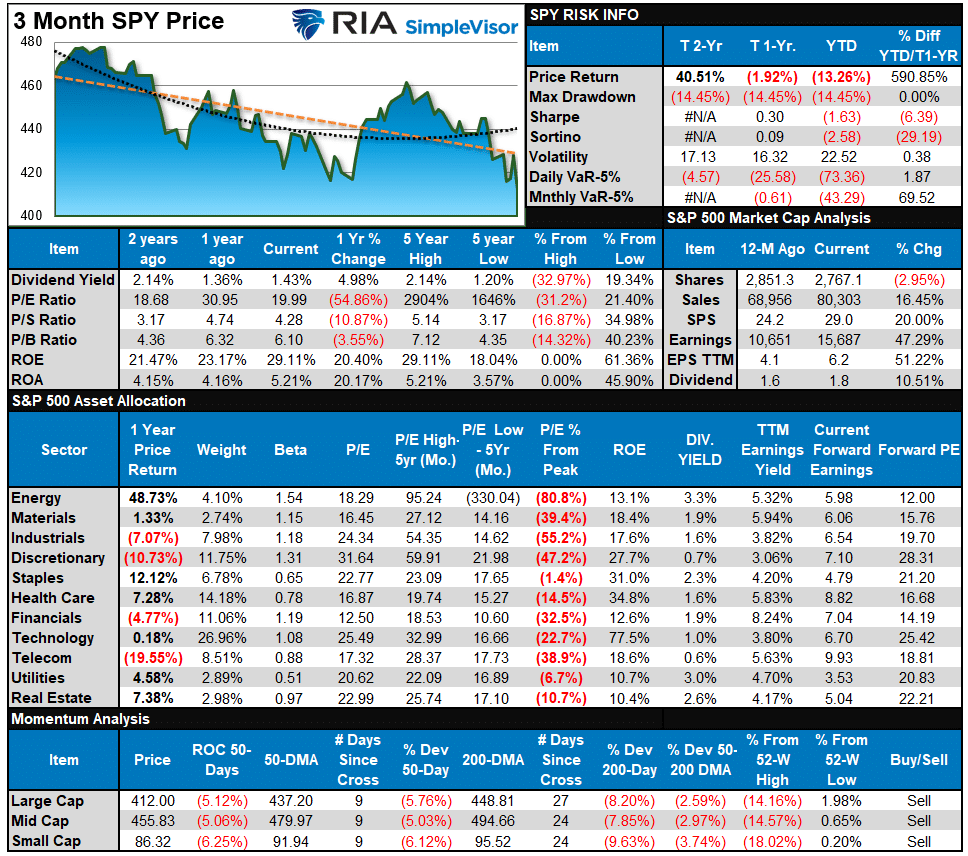
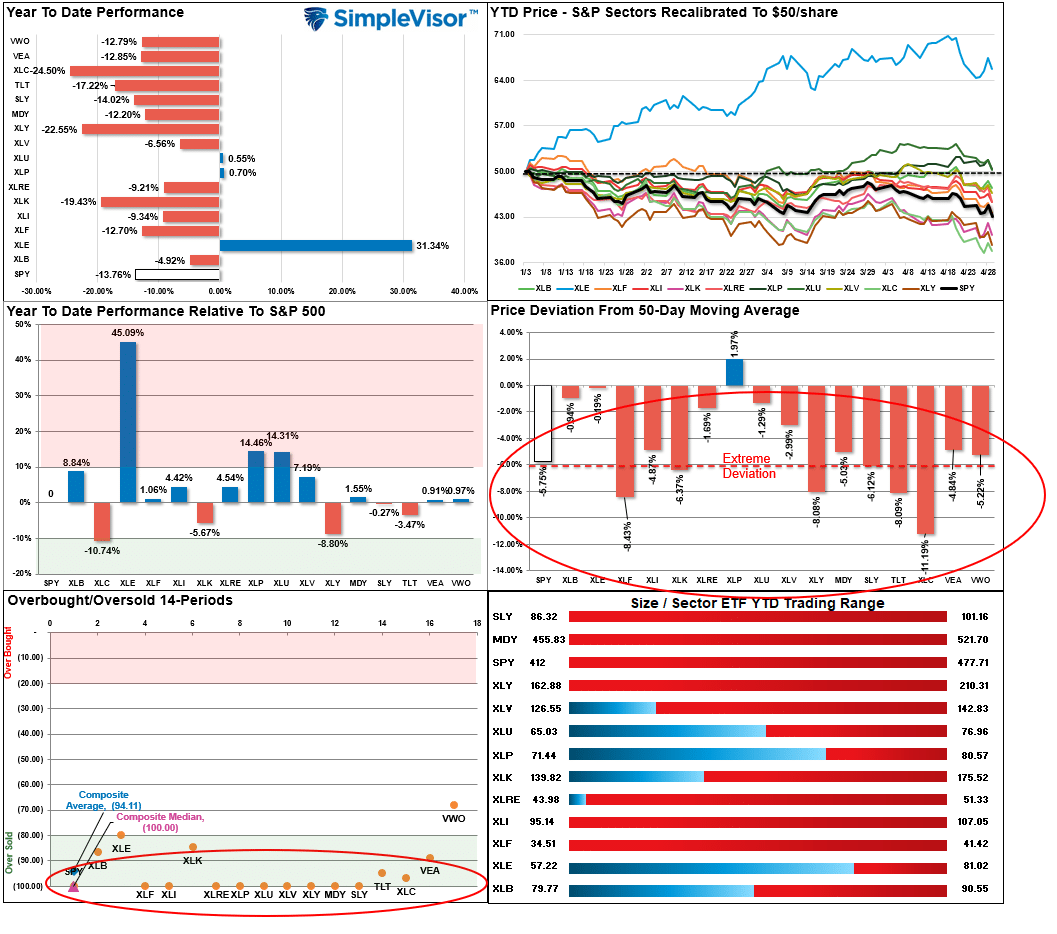
Relative Performance Analysis
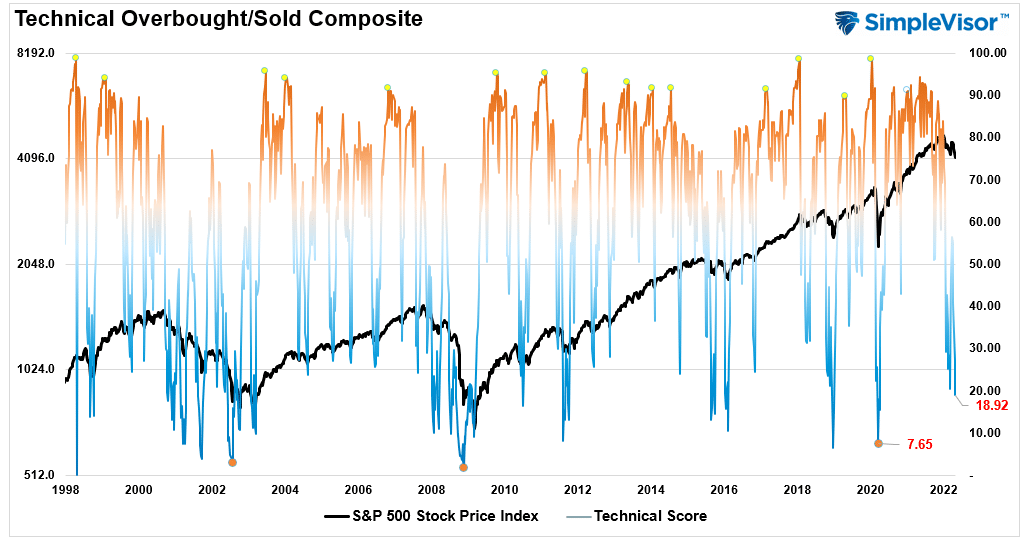
Technical Composite
The technical overbought/sold gauge comprises several price indicators (RSI, Williams %R, etc.), measured using “weekly” closing price data. Readings above “80” are considered overbought, and below “20” are oversold. The current reading is 18.92 out of a possible 100.
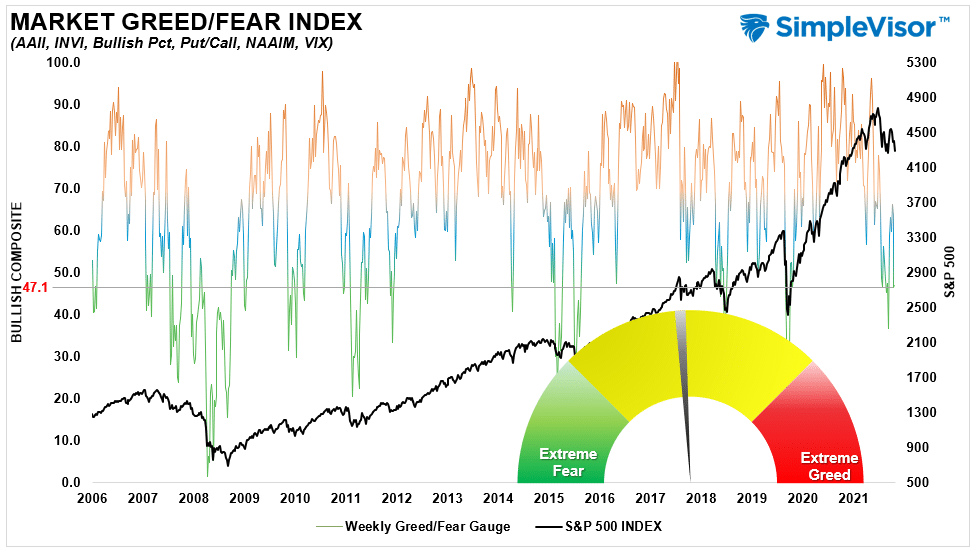
Portfolio Positioning “Fear / Greed” Gauge
The “Fear/Greed” gauge is how individual and professional investors are “positioning” themselves in the market based on their equity exposure. From a contrarian position, the higher the allocation to equities, to more likely the market is closer to a correction than not. The gauge uses weekly closing data.
NOTE: The Fear/Greed Index measures risk from 0 to 100. It is a rarity that it reaches levels above 90. The current reading is 47.1 out of a possible 100.
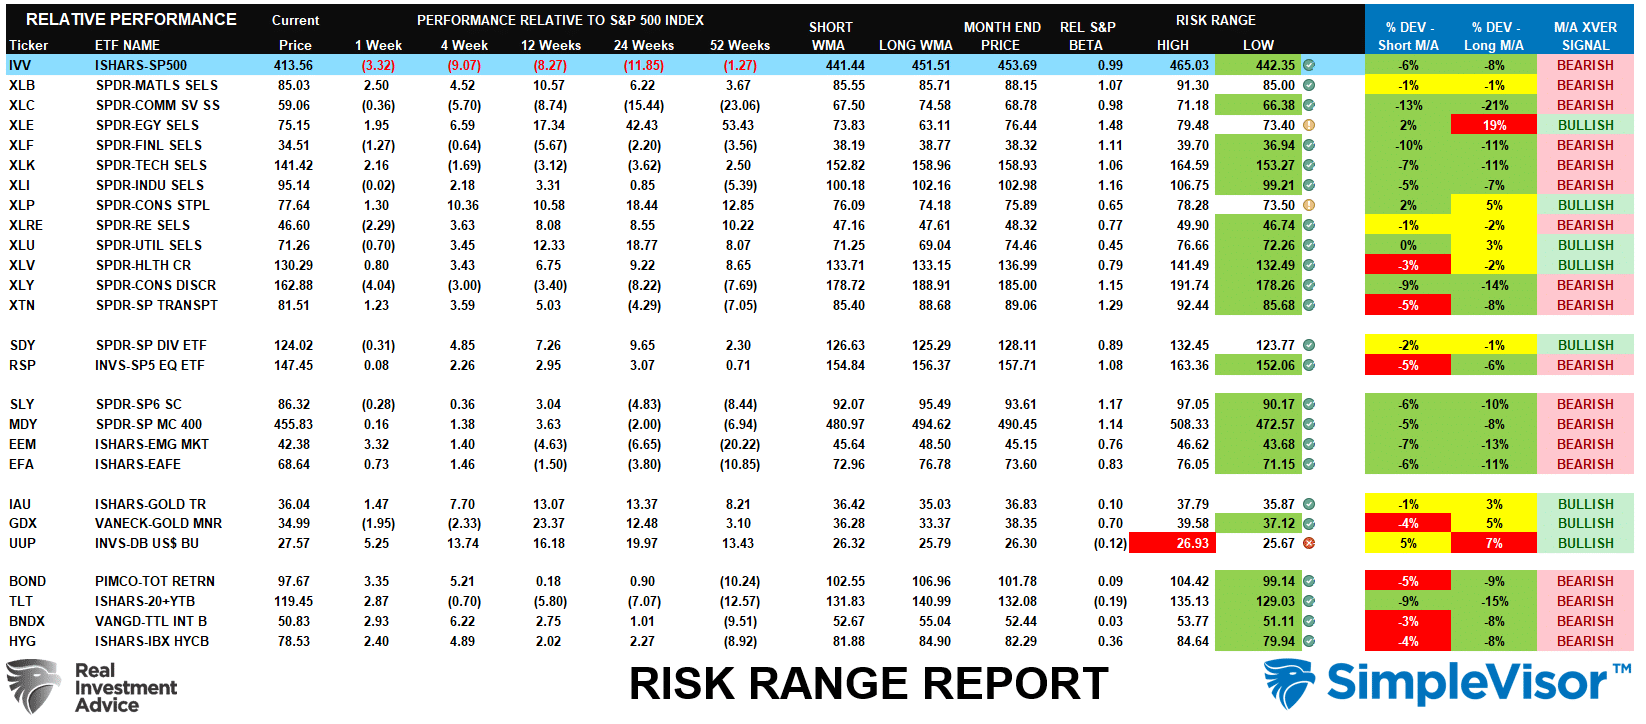
Sector Model Analysis & Risk Ranges
How To Read This Table
- The table compares the relative performance of each sector and market to the S&P 500 index.
- “M/A XVER” is determined by whether the short-term weekly moving average crosses positively or negatively with the long-term weekly moving average.
- The risk range is a function of the month-end closing price and the “beta” of the sector or market. (Ranges reset on the 1st of each month)
- The table shows the price deviation above and below the weekly moving averages.
- The complete history of all sentiment indicators is under the Dashboard/Sentiment tab at SimpleVisor.
Weekly Stock Screens
Each week we will provide three different stock screens generated from SimpleVisor: (RIAPro.net subscribers use your current credentials to log in.)
This week we are scanning for the Top 20:
- Relative Strength Stocks
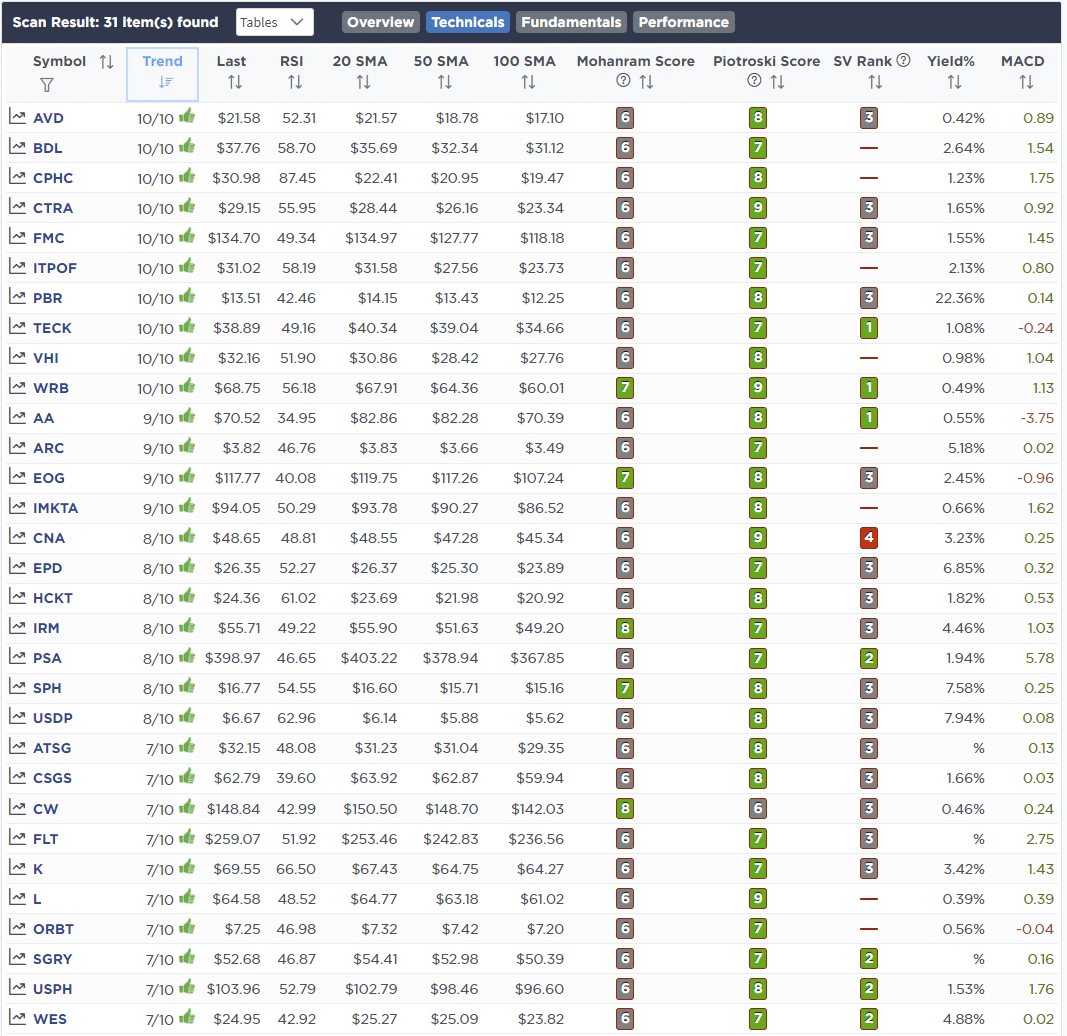
- Momentum Stocks
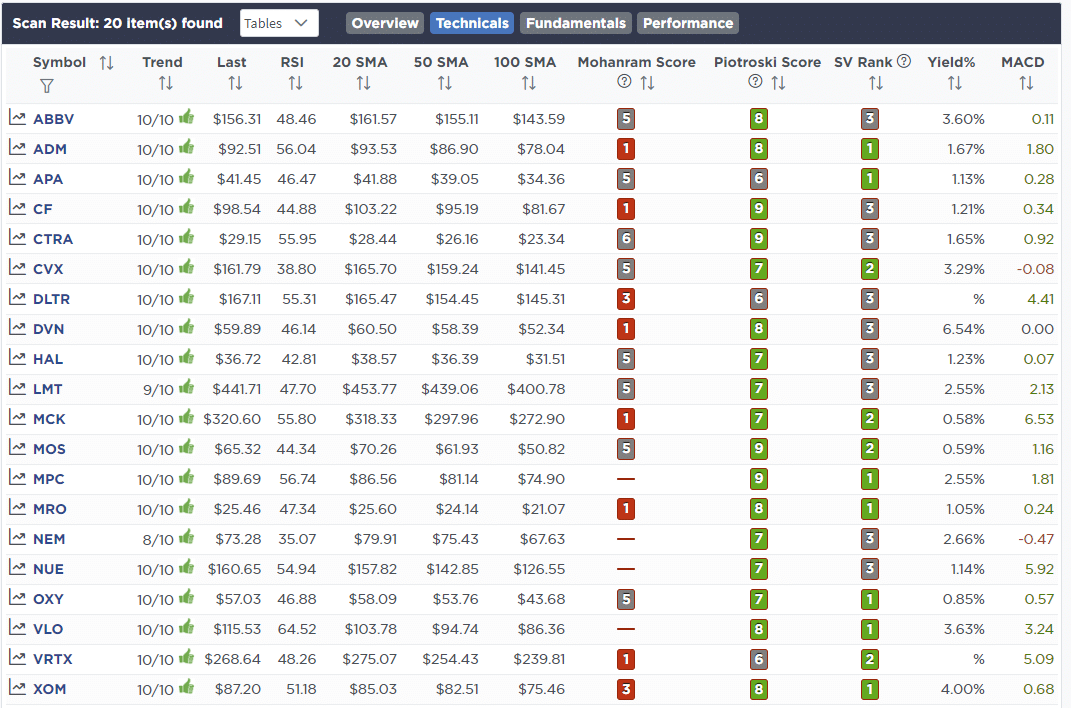
- Technically Strong With Strong Fundamentals
These screens generate portfolio ideas and serve as the starting point for further research.
(Click Images To Enlarge)
RSI Screen
Momentum Screen

Technical & Fundamental Strength Screen
SimpleVisor Portfolio Changes
We post all of our portfolio changes as they occur at SimpleVisor:
No Trades This Week

Lance Roberts, CIO
Have a great week!


