The Fed’s “Rate Shock” Sends Stocks Tumbling


Inside This Week’s Bull Bear Report
- Market Stumbles After Fed’s Rate Shock
- What The Fed Said
- How We Are Trading It
- Research Report – Are The FANG Stocks Dead
- Youtube – Market Recap With Adam Taggert
- Stock Of The Week
- Daily Commentary Bits
- Market Statistics
- Stock Screens
- Portfolio Trades This Week
Market Stumbles After Fed’s Rate Shock
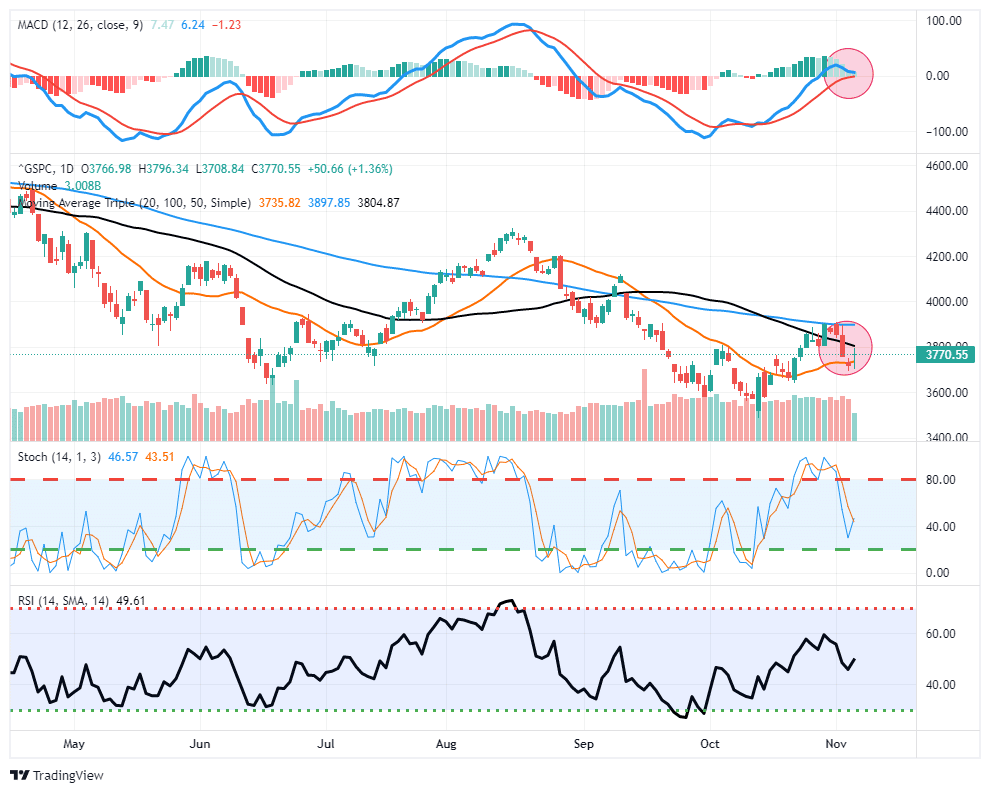
Last week, we discussed that there were some short-term positive developments. The market had bounced off the 20-dma, turning that previous resistance level into support, and this week the market rallied above the 50-dma. Then, on Wednesday, Jerome Powell sent a message on rates that sent the bulls scrambling for cover.
As expected, the Federal Reserve raised interest rates by 0.75%. Stocks initially rallied as the FOMCs statement suggested that rate hikes would slow. However, once Fed Chair Jerome Powell emphasized that it’s “premature” to discuss a pause in rate increases, stocks tumbled, taking out important support at both the 50-dma and the 3800 support level.
The October employment report on Friday was also strong, printing a 261,000 job increase, but the unemployment rate rose to 3.7%. Initially, stocks sold off but then rallied on expectations that future reports would begin to weaken. Notably, the market defended the important 20-dma moving average, keeping the bull market rally from the September lows alive. However, the MACD “buy signal,” which signaled the start of the most recent rally, is dangerously close to flipping.
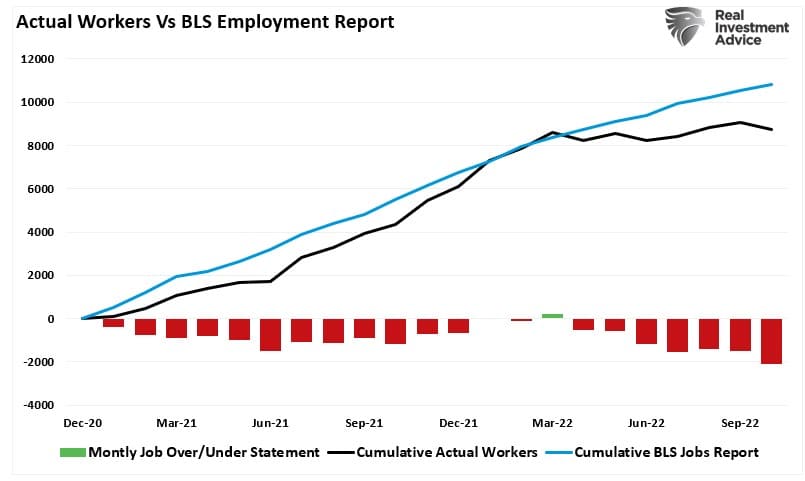
While the BLS employment report suggested employment was strong, the Household Survey, which is where the BLS report comes from, showed a rather significant loss of 328,000 jobs. Also, wage growth continues to slow, and the labor force participation rate dropped. That data suggests the Fed’s rate hikes are beginning to have an effect. As shown, while the BLS report continues to report strong monthly job growth, the Household Survey (which the BLS draws its report from) suggests a far weaker picture showing NO job gains since March of 2022.
We suspect that after the Midterm elections are behind us, we may see a “catch down” in the data. Such is especially the case with the rising number of layoff announcements almost daily.

While the Fed continues looking at inflation and employment for clues on when to stop hiking rates, as we will discuss, they may have already gone too far.
Need Help With Your Investing Strategy?
Are you looking for complete financial, insurance, and estate planning? Need a risk-managed portfolio management strategy to grow and protect your savings? Whatever your needs are, we are here to help.

What The Fed Said About Higher Rates
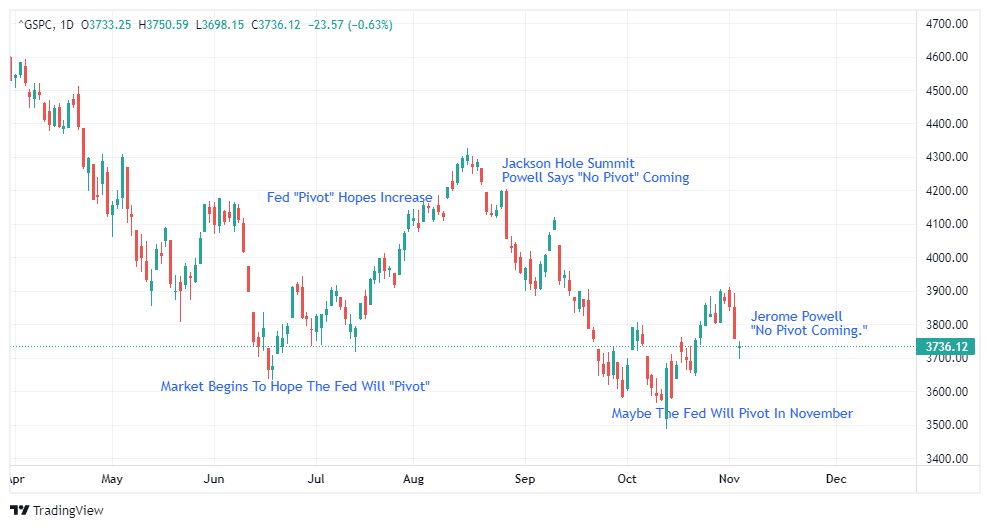
Over the last three weeks, the market has traded higher over hopes, once again, that the Fed would begin its “pivot” on rate hikes. As noted above, such was not the case, as Jerome Powell made it clear that hiking rates remain the primary focus until it achieved its goals. Interestingly, this is not the first time this occurred. In June, at the market’s lows, stocks began to stage an enormous rally into mid-August, hoping the Fed would shift its hawkish stance. Then, as it was this week, Jerome Powell changed his Jackson Hole Summit speech at the last moment to crush any notion the Fed might reverse its stance on rate hikes.
Specifically, what shook the markets the most was Powell’s statement during the press conference.
“The labor market continues to be out of balance, with demand substantially exceeding the supply of available workers”
That statement reinforced the notion that the Fed is looking at employment and inflation as giving it plenty of reasons to keep tightening.
The employment report on Friday provided no evidence the economy is cooling. Two inflation and another job report remain before the Fed’s next meeting in December. Not to mention, of course, the results of the Midterm elections next week.
While the markets will continue to cling to these reports for clues about a future “pivot,” we previously stated these data points are both lagging and subject to future negative revisions. Such puts the Fed at an elevated risk of making a policy mistake.
The Fed Is Looking Backwards
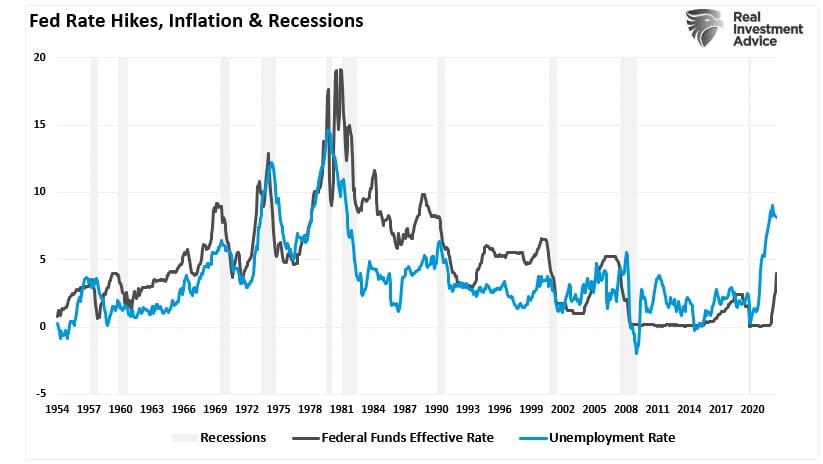
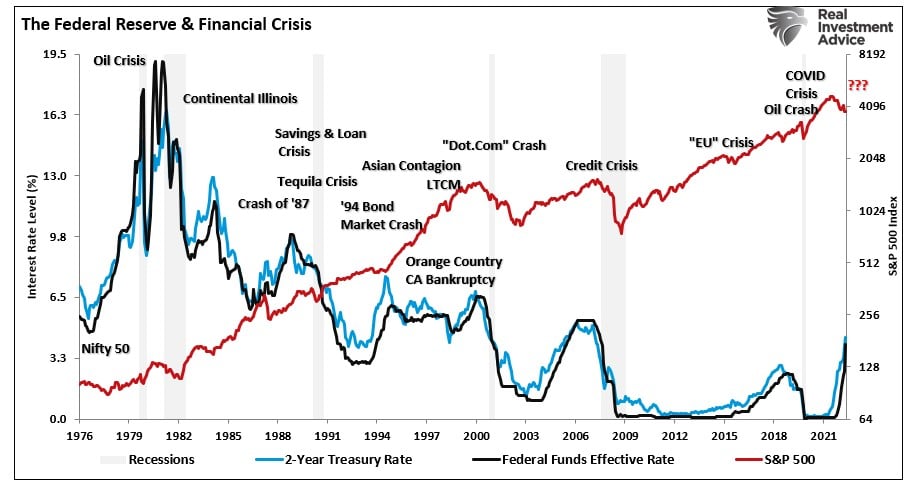
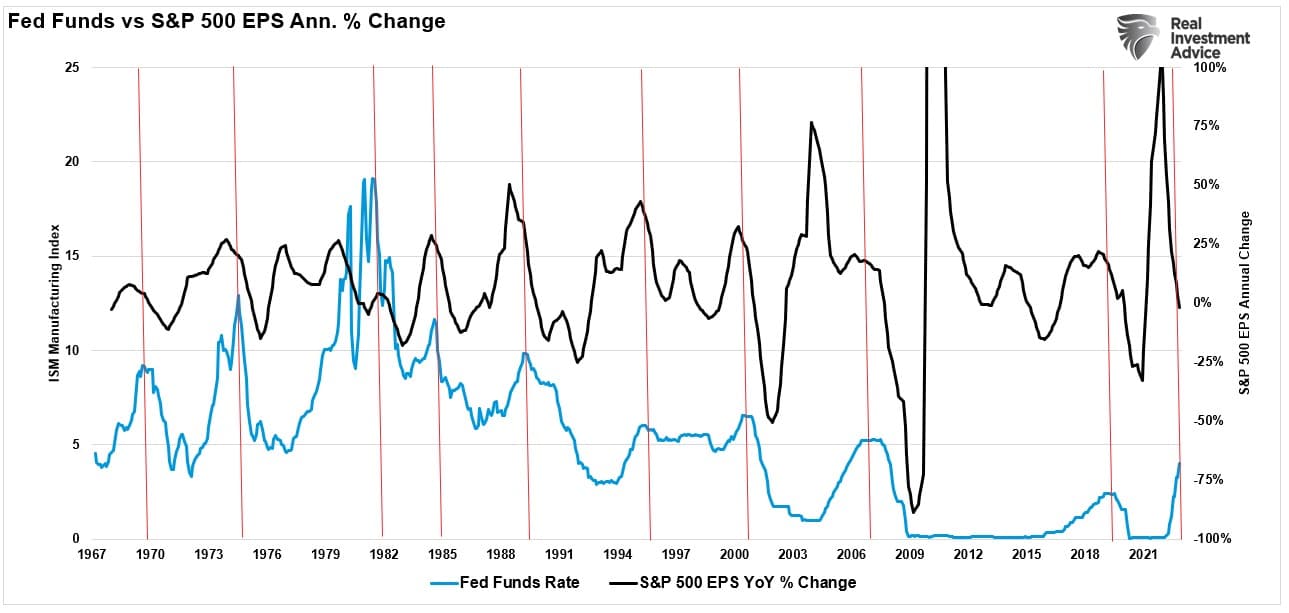
As shown, as the Fed has previously hiked rates, unemployment either initially remained low or declined further. Such is because the economy was strong and creating jobs, and the rate hikes were intended to slow that growth. As the Fed continues to hike rates, that “brake” eventually leads to job losses. What is notable is that unemployment doesn’t slowly move higher but tends to rise very quickly. At that point, the Fed realizes its mistake and reverses policy actions.

The same rapid realization comes with the “inflation fight.” Like employment, the Fed hikes rates to slow economic activity, bringing down inflation. Again, as with unemployment, you can see the correlation between Fed rate hikes and inflation. Every time the Fed historically hikes rates, it eventually leads to a recession, crisis, or bear market, rapidly bringing down inflation.
The Fed is aware of this “lag effect” between policy changes and economic outcomes.
“At some point, it will become appropriate to slow the pace of increases.“
The market problem came when he stated that there is “significant uncertainty” around that end-point which he indicated by stating, “we have some ways to go.” Furthermore, to make sure there were no questions about the Fed’s intentions, Powell said:
“The question of when to moderate the pace of increases is now much less important than the question of how high to raise rates and how long to keep monetary policy restrictive.”
Accordingly, that comment pushed terminal rate expectations above 5%, crushing any hope for a “pivot” any time soon.
The Fed Doesn’t Care About A Policy Mistake
As noted, the Fed has a long history of repeatedly making policy mistakes.
Before the pandemic, the Fed’s storyline was to let inflation run hot rather than allow inflation to stay too low for too long. Such makes sense as inflation is easy to deal with by hiking rates and slowing the economy. Deflation is a far different story, as it becomes an entrenched psychological impact that becomes difficult to dislodge.
Today, Powell says the Fed’s concern is entrenched inflation which causes pain to the economy.
The reality is that inflation is not the problem.
If the Fed did nothing, “high prices will cure high prices.” The real risk remains a “deflationary” spiral that depresses economic activity and prosperity. Deflation is a far more insidious problem than inflation longer term.
Such is why, over the past decade, the Fed flooded the economy with liquidity and zero interest rates to boost economic activity. While it never generated organic growth above 2% annually, it did increase asset prices, inflated asset bubbles, and expanded wealth inequality.
Regardless of the actual outcome, the Fed, just like the market, is now addicted to those monetary policy tools. As such, the Fed no longer fears creating economic havoc. As Powell stated, “if we overtighten, we can support economic activity.”
In other words, for the bulls hoping for a “pivot,” Powell made it clear that a “pivot” is coming. It is only the function of time until it is evident that something breaks in the economy and bailouts are required. At that point, it will be an immediate return to zero interest rates and massive bond-buying programs.
The “Event” Is Coming
One of the interesting comments by Jerome Powell was the “window for a soft landing in the economy was narrowing.” Such confirms what we already know that the Fed is starting to realize the risk of a “hard landing” is becoming increasingly elevated.
Such leaves only two trajectories. The first option is for central banks to pause rates and allow inflation to run its course. Such would potentially lead to a softer landing in the economy but theoretically anchor inflation at higher levels. The second option, and the one chosen, is to hike rates until the economy slips into a deeper recession. Both trajectories are bad for equities. The latter is substantially riskier as it creates an economic or financial “event” with more severe outcomes.
While the U.S. economy has absorbed tighter financial conditions so far, it doesn’t mean it will continue to do so. History is pretty clear about the outcomes of higher rates, combined with a surging dollar and inflationary pressures.

The surge in restrictive monetary policy will continue to weigh on equities next year as record profit margins compress. Such is an inevitable outcome of higher interest rates, increasing borrowing costs, inflationary pressures in inputs that can’t get passed on, and a surging dollar dampening exports. It’s a nasty brew that shows no signs of abating currently.
The risk to markets remains lower prices as long as the Fed remains aggressive in its inflation fight. It is only logical that since margins and earnings are derived from economic growth, if the window of a “soft landing” has narrowed, then the window for a “hard landing” is widening.
Of course, once the Fed “breaks” something, they will “pivot” on monetary policy. The only question is how much lower asset prices will be by the time that happens.
Not Getting The Bull Bear Report Each Week In Your Mailbox? Subscribe Here For Free.
How We Are Trading It
The Fed’s “no pivot” policy stance continues to drive the markets short-term. Investors remain at the mercy of volatile markets with little direction on where capital can find safety. Gold has not hedged inflation. Bonds have not hedged risk, and equities remain under continuous pressure.
The setup remains more bearish than bullish now that the recent advance appears complete. As such, we have further reduced our equity holdings, increased our cash levels, and remain underweight fixed income. As discussed previously, there is a developing opportunity to own long-dated Treasury bonds, but you will need to give that thesis time to play out into 2023.
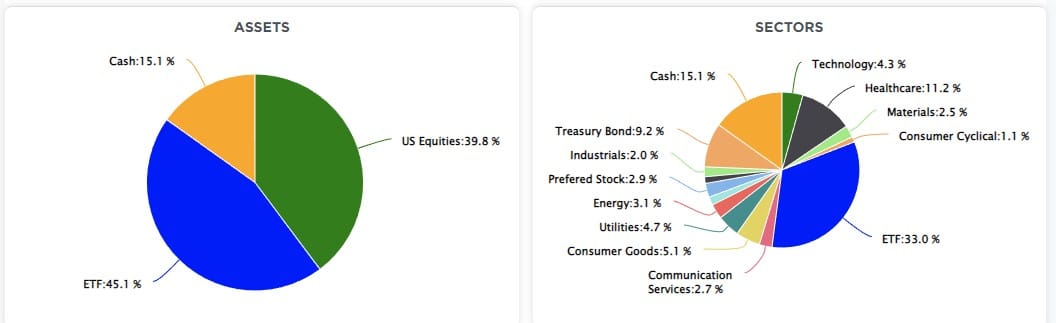
We are doing our tax loss harvesting heading into year-end to reduce equity exposure further. However, keep working to rebalance portfolios for now, as the previous rally may be ending for the time being.
- Tighten up stop-loss levels to current support levels for each position.
- Hedge portfolios against significant market declines.
- Take profits in positions that have been big winners
- Sell laggards and losers.
- Raise cash and rebalance portfolios to target weightings.
See you next week.
Research Report
Market Recap – With Adam Taggert
Subscribe To Our Youtube Channel To Get Notified Of All Our Videos
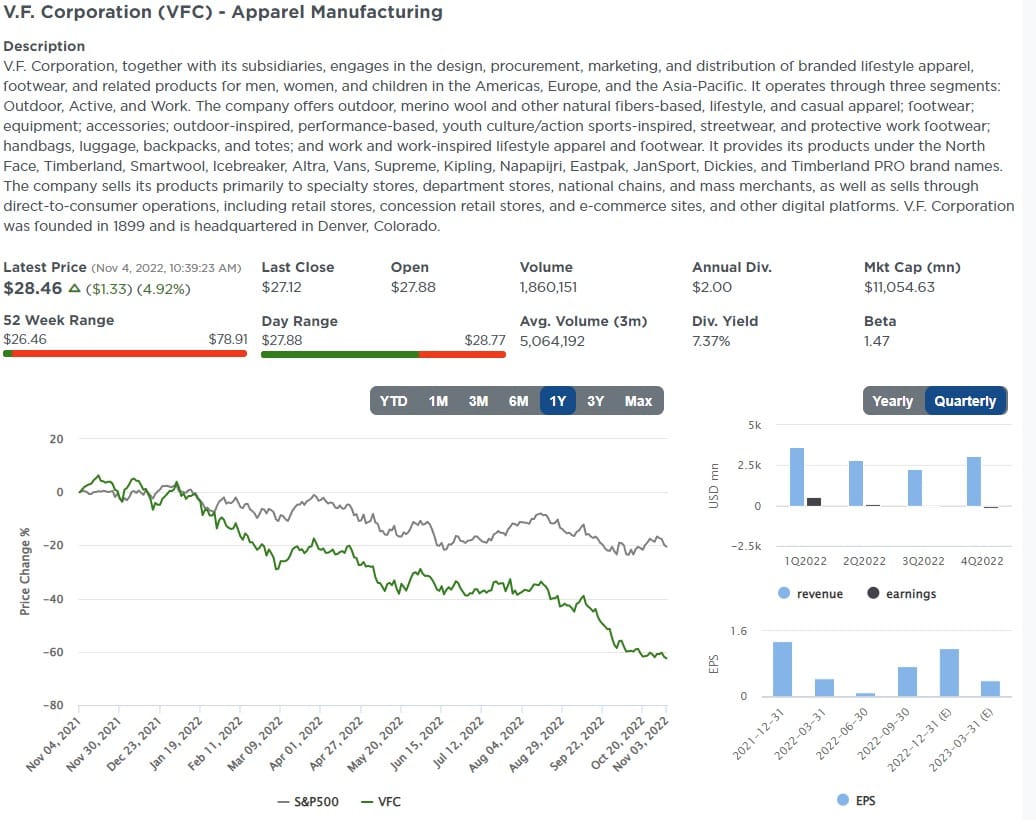
Stock Of The Week In Review
This week’s scan seeks to find royalty among the Dividend Aristocrats. Dividend Aristocrats have increased dividends for at least 25 consecutive years. They must also be in the S&P 500 and actively traded to qualify.
We scanned the Dividend Aristocrats in January. At the time, we were focused on growth to support future dividend payments and value. This time we are eyeing the dividend yield and the ten-year growth rate of the dividends. Our sort starts with the 11 Aristocrats sporting dividend yields greater than 4%. We then pick the five stocks with the best dividend growth over the last ten years.
Here is a link to the full SimpleVisor Article For Step-By-Step Instructions.
Here is one of the stocks from the scan.
Login to Simplevisor.com to read the full 5-For-Friday report.
Daily Commentary Bits
Monetary Headwinds Accenturate Q4 Risks
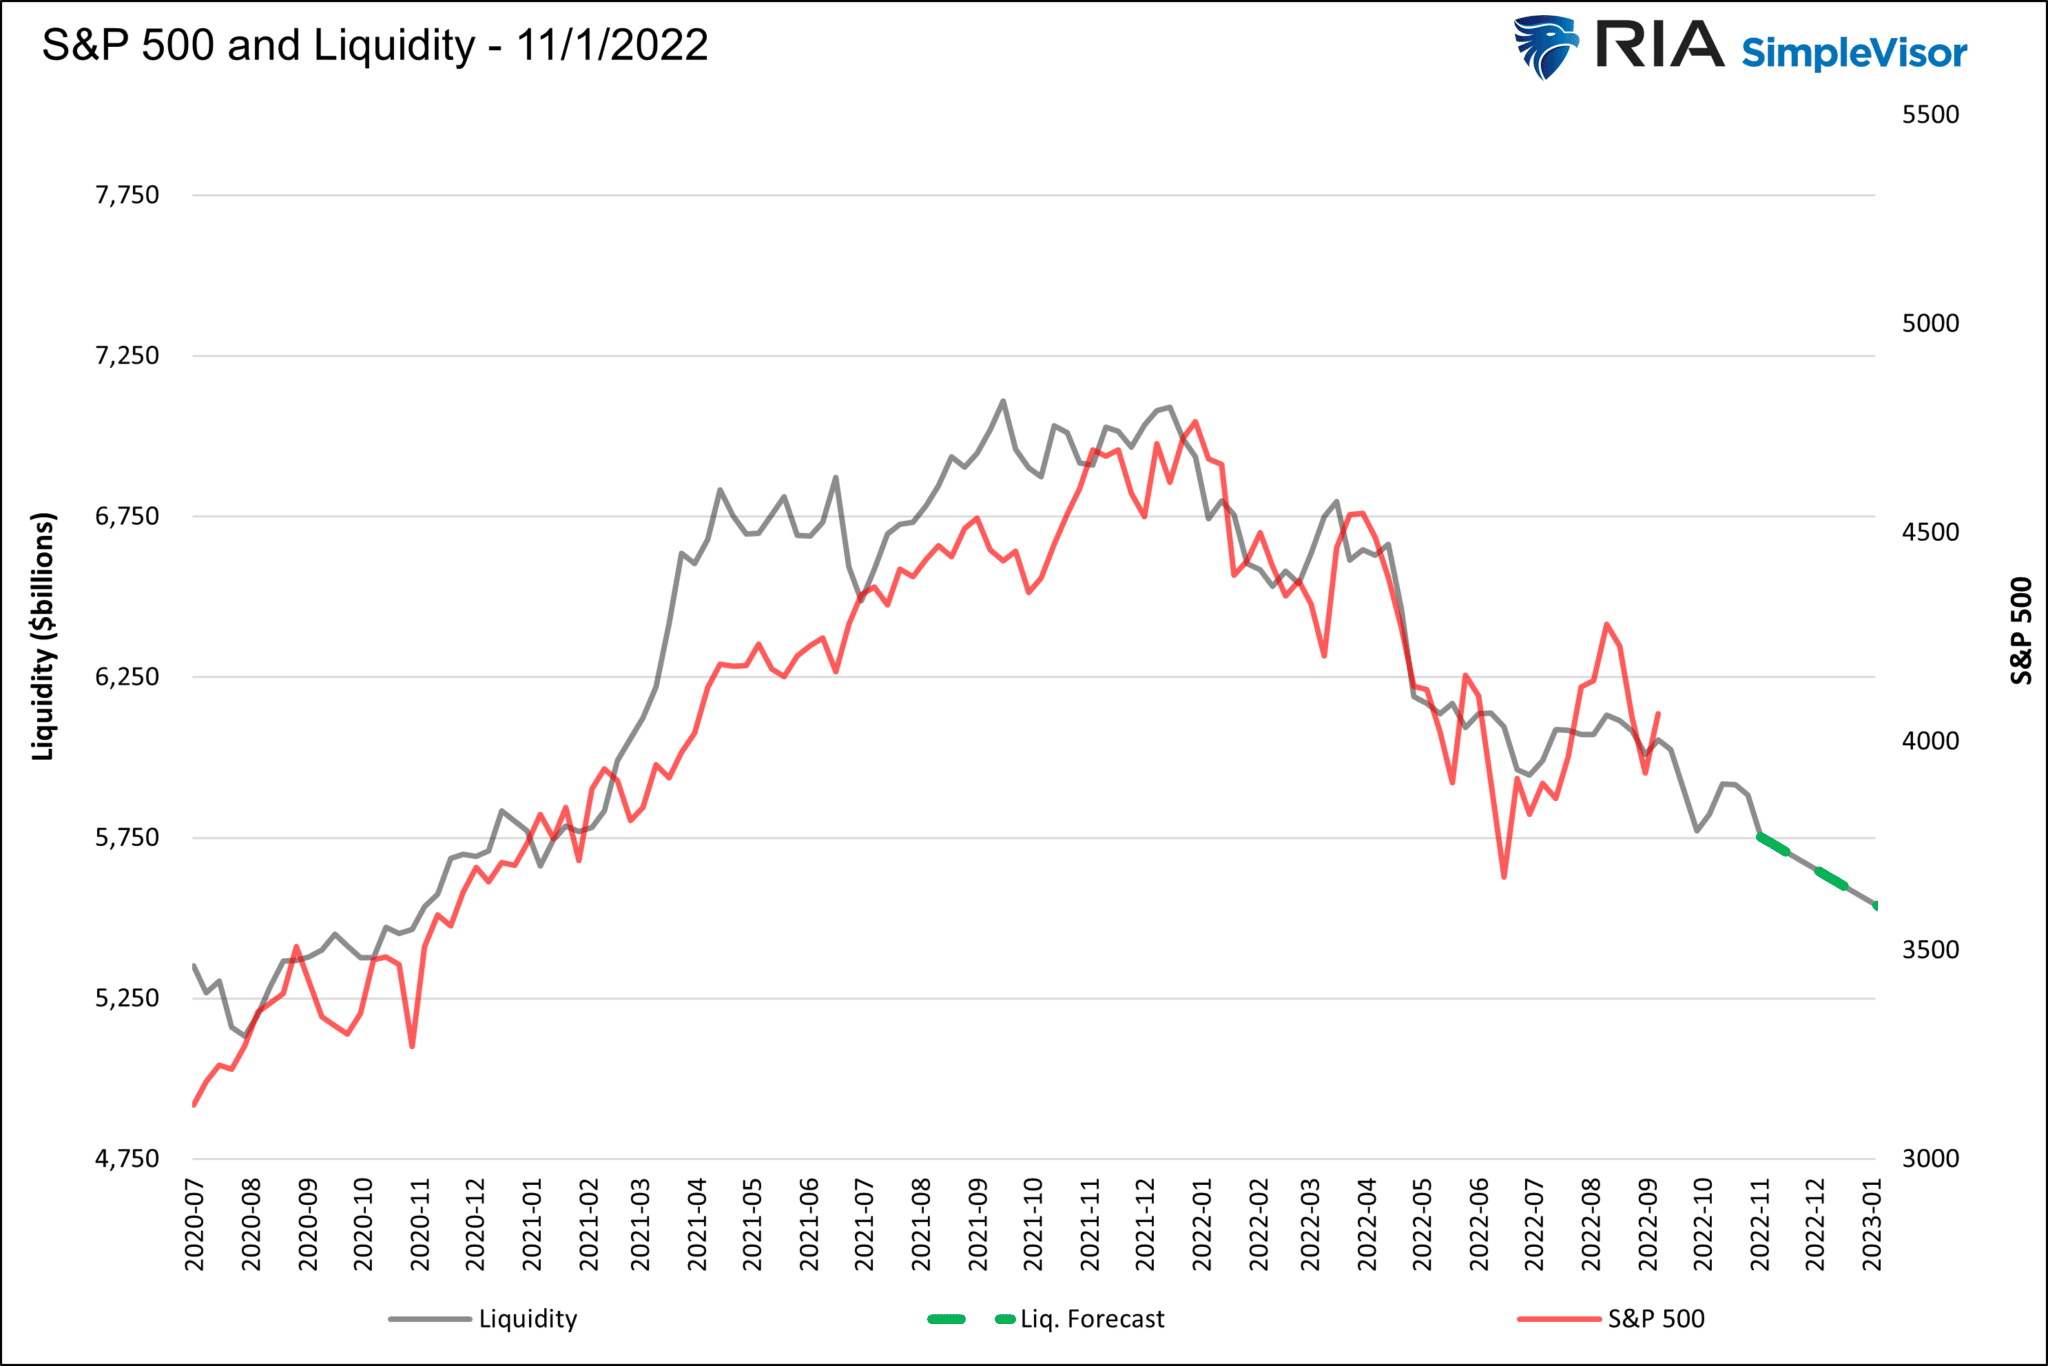
Monetary headwinds, already proving difficult for stock prices, are expected to strengthen in the next two months. The U.S. Treasury announced its Q4 borrowing estimates would be $150 billion more than expected. Further, they expect to increase its cash balances held at the Fed (Treasury General Account -TGA) to $700 billion. Increased debt issuance forces investors to carry more Treasury assets, leaving less cash for other investments. Further, the higher Treasury cash balances will accentuate monetary headwinds already weighing on stock prices.
As we wrote in 3500 By Year End if QT Continues, liquidity is governed by the Fed’s balance sheet, the Fed’s RRP program, and Treasury balances held at the Fed (TGA). The size of the Fed’s balance sheet less the sum of the TGA and RRP equals the amount of Fed-generated liquidity in the system. The Fed, via QT, will continue to reduce its balance sheet by $95 billion a month. RRP is expected to be flat over the coming months, neither adding nor subtracting liquidity. As we noted, the TGA will rise to $700 billion, pulling an additional $75 billion of liquidity from the markets by yearend. The updated graph below shows that increasing monetary headwinds still project the S&P 500 toward 3500.
Click Here To Read The Latest Daily Market Commentary (Subscribe For Pre-Market Email)
Bull Bear Report Market Statistics & Screens

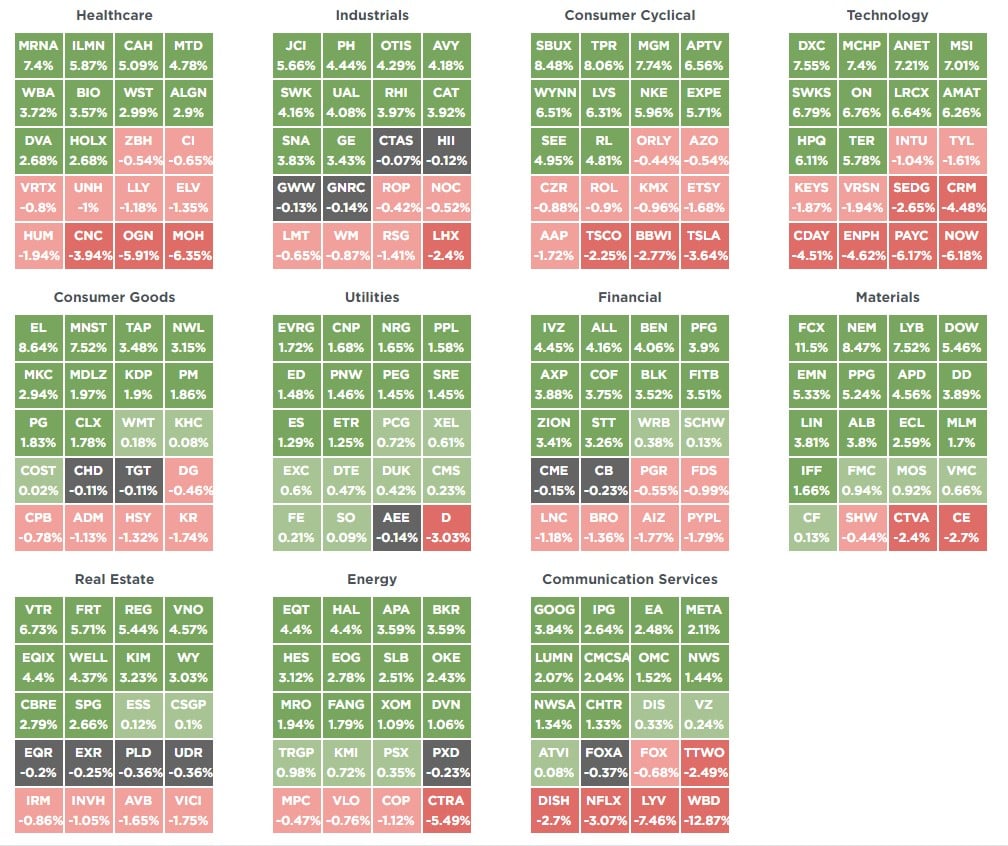
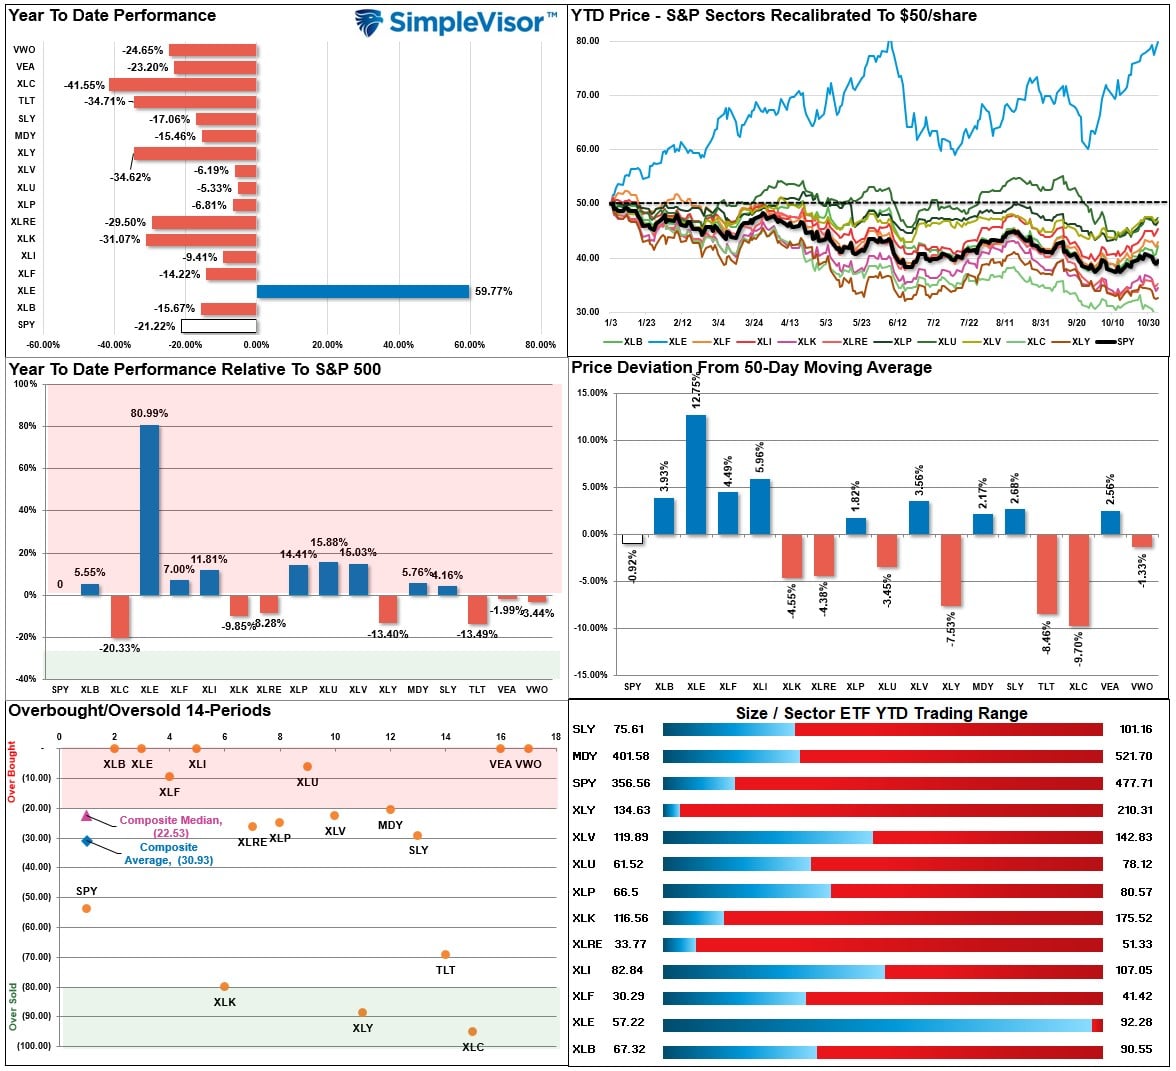
SimpleVisor Top & Bottom Performers By Sector
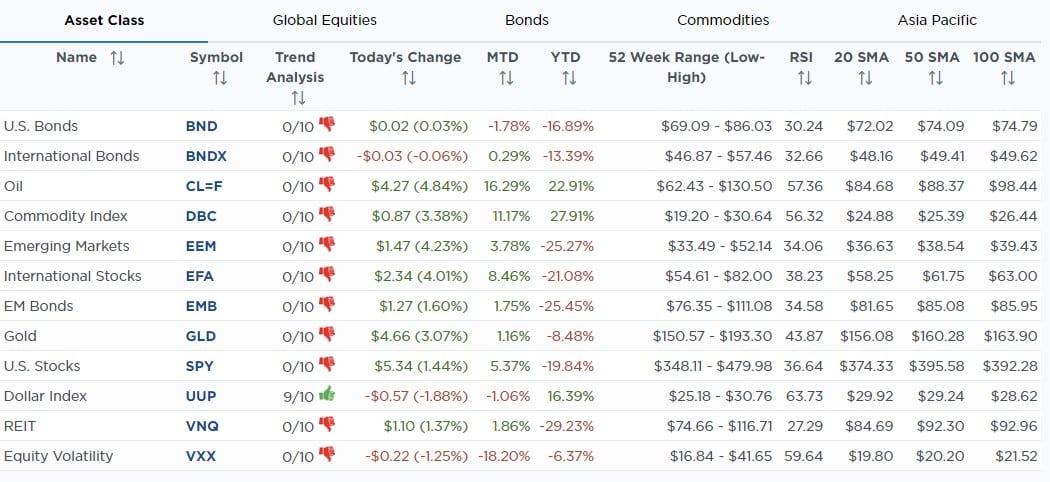
SimpleVisor Asset Class Trend Analysis
Relative Performance Analysis
The market struggled last week as the Fed hiked rates and remained “hawkish” concerning its policy stance. Energy continues to trade well and has had a tremendous run as of late (which is why we trimmed exposure this past week.) Communications, Discretionary, and Bonds remain oversold, with International, Emerging Markets, Materials, Industrials, Financials, and Utilities now overbought.
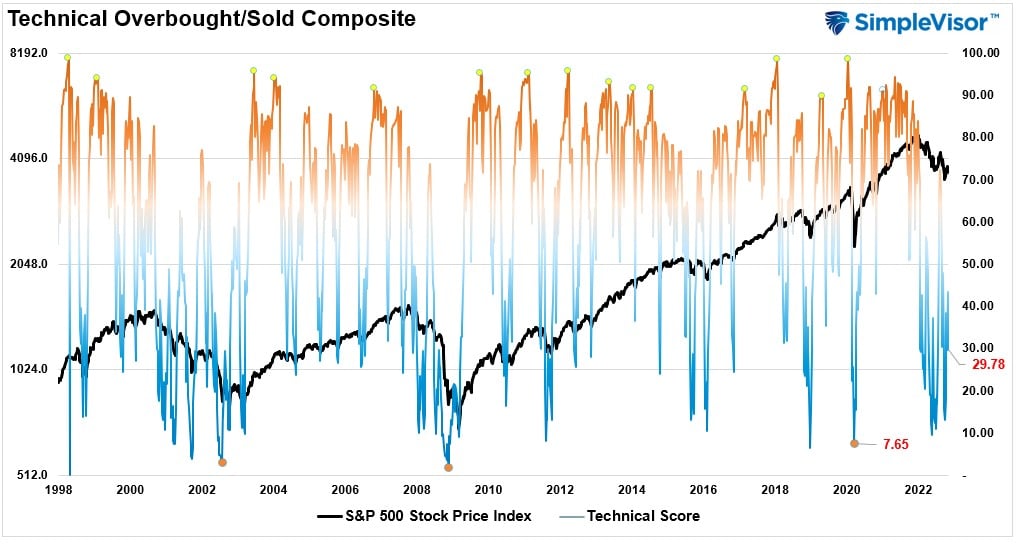
Technical Composite
The technical overbought/sold gauge comprises several price indicators (RSI, Williams %R, etc.), measured using “weekly” closing price data. Readings above “80” are considered overbought, and below “20” are oversold. Markets tend to peak when readings are at 80 or above, which suggests profit-taking and risk management are prudent. The best buying opportunities exist when readings are 20 or below.
The current reading is 29.78 out of a possible 100 and rising. Remain long equities for now.
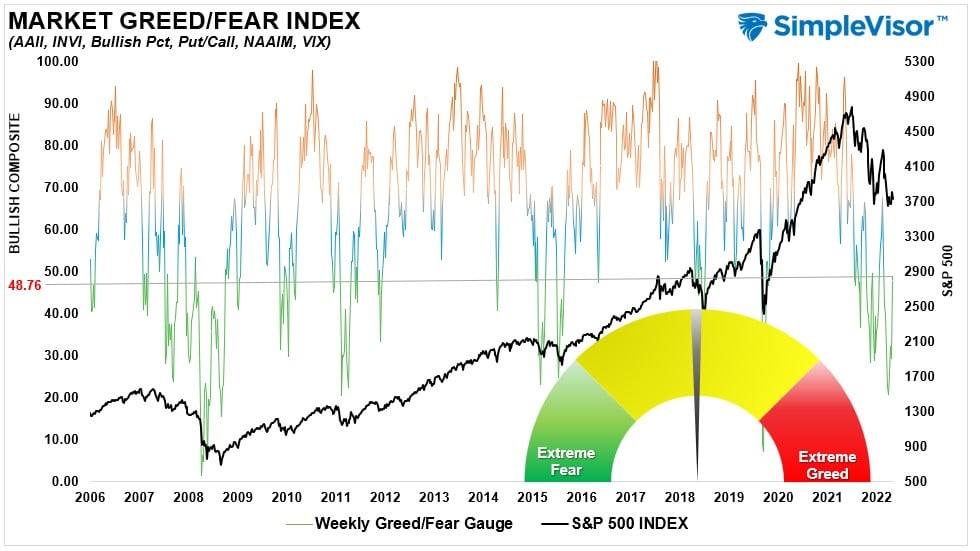
Portfolio Positioning “Fear / Greed” Gauge
The “Fear/Greed” gauge is how individual and professional investors are “positioning” themselves in the market based on their equity exposure. From a contrarian position, the higher the allocation to equities, the more likely the market is closer to a correction than not. The gauge uses weekly closing data.
NOTE: The Fear/Greed Index measures risk from 0 to 100. It is a rarity that it reaches levels above 90. The current reading is 48.76 out of a possible 100.
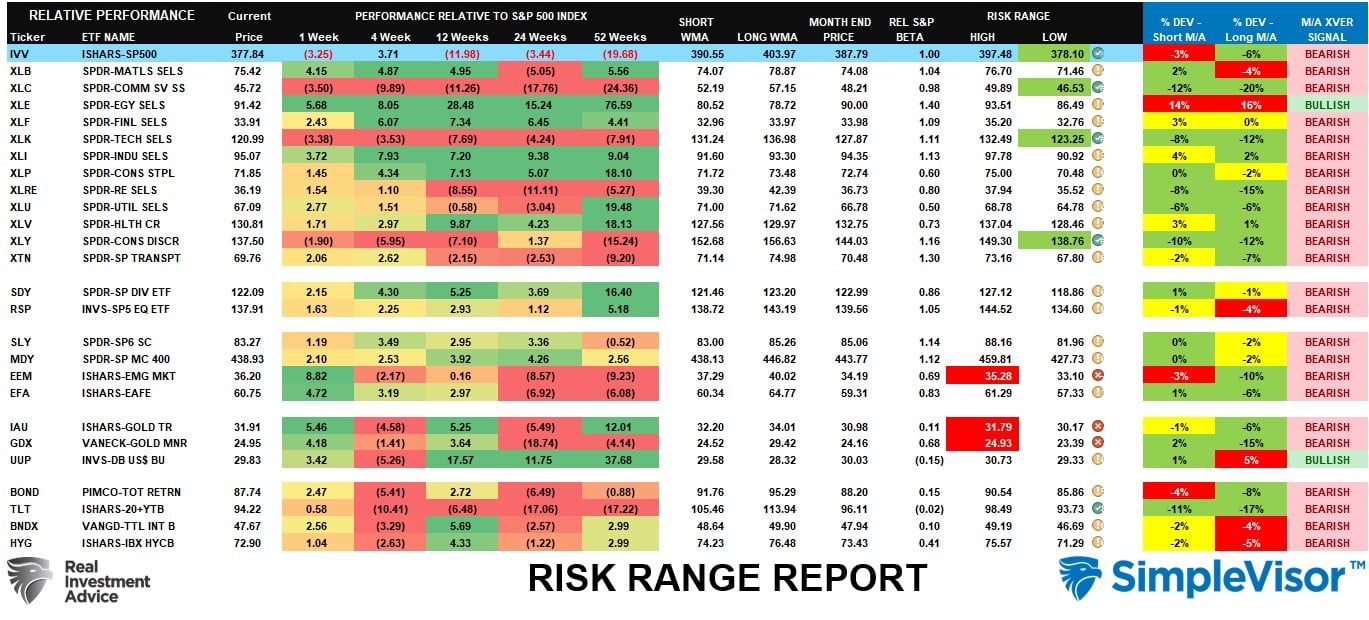
Sector Model Analysis & Risk Ranges
How To Read This Table
- The table compares the relative performance of each sector and market to the S&P 500 index.
- “M/A XVER” is determined by whether the short-term weekly moving average crosses positively or negatively with the long-term weekly moving average.
- The risk range is a function of the month-end closing price and the “beta” of the sector or market. (Ranges reset on the 1st of each month)
- The table shows the price deviation above and below the weekly moving averages.
Despite the selloff on Wednesday following the FOMC rate hike announcement, the market continues to hold its rally together. The overall market is below its monthly risk/reward range (a buy signal) along with Energy, Technology, and Discretionary short-term. Emerging Markets, Gold and Gold Miners are above their monthly risk range (take profits). Discretionary, Technology, Real Estate, and Communications are the most obvious candidates for outperformance as money rotates out of Materials, Energy, and the Dollar.
Weekly SimpleVisor Stock Screens
Each week we will provide three different stock screens generated from SimpleVisor: (RIAPro.net subscribers use your current credentials to log in.)
This week we are scanning for the Top 20:
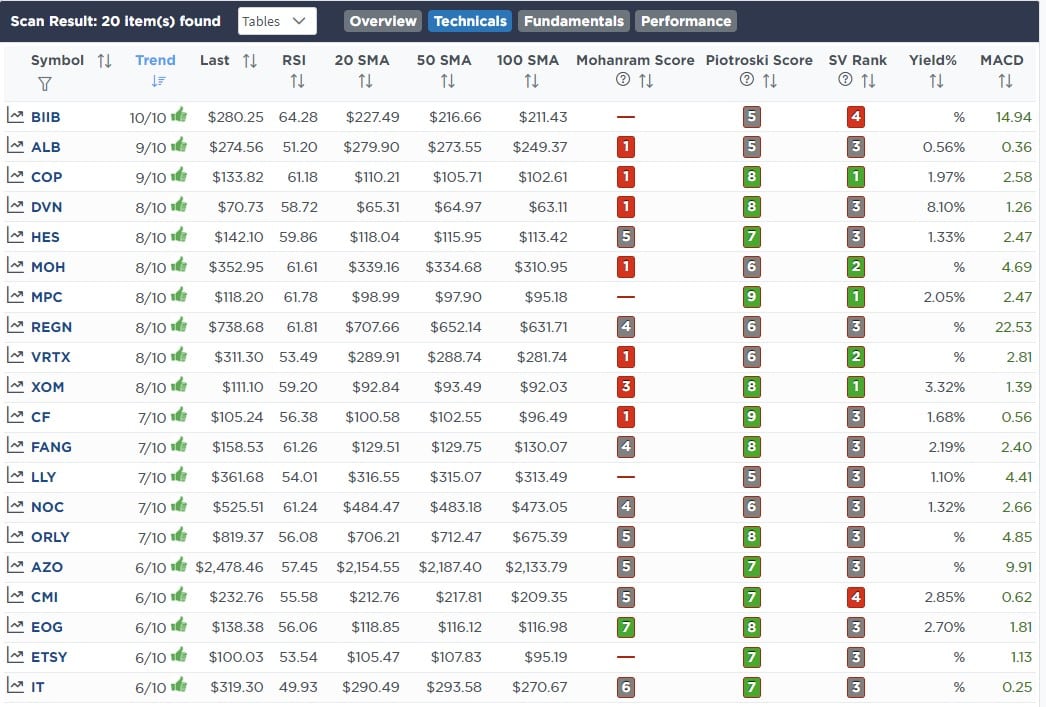
- Relative Strength Stocks
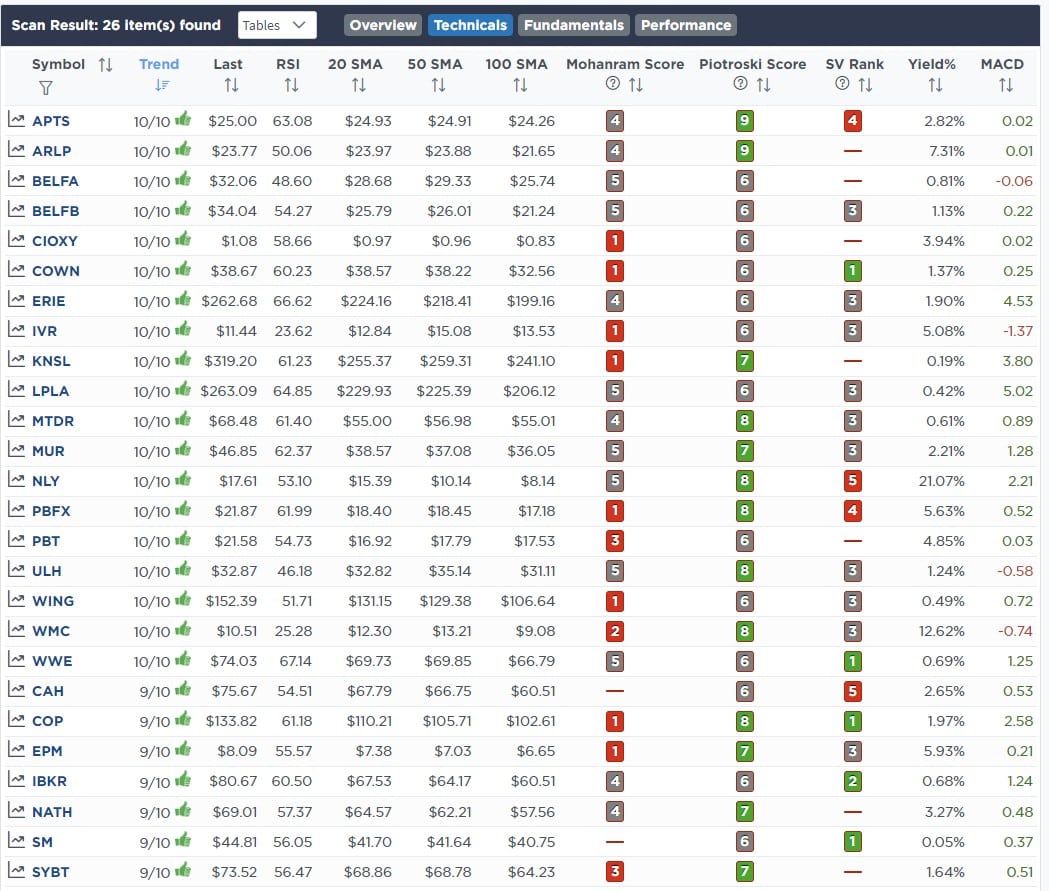
- Momentum Stocks
- Highest Rated Stocks With Dividends
These screens generate portfolio ideas and serve as the starting point for further research.
(Click Images To Enlarge)
RSI Screen

Momentum Screen
Highest Rated With Dividends Screen
SimpleVisor Portfolio Changes
We post all of our portfolio changes as they occur at SimpleVisor:
October 31st
This morning we trimmed back on Energy stocks after the recent run to take profits, which we have done multiple times this year. We are also continuing our tax-loss harvesting in the portfolio as well.
We are swelling 100% of Verizon (VZ) in the equity model for the tax loss. We still like Verizon fundamentally, particularly with a near 7% yield. We think it could continue to trade weaker over the next couple of weeks as mutual funds and professional managers do the same. We will likely buy it back after the first of the year. We also recently added Comcast (CMCSA) to replace Verizon (VZ.)
Equity Model
- Sell 100% of Verizon (VZ) for the tax loss.
- Reduce Devon Energy (DVN) to 1.75% of the portfolio.
- Reduce Exxon Mobil (XOM) to 1.50% of the portfolio.
ETF Model
- Take profits in SPDR Energy Sector (XLE) and reduce by 1% of the portfolio.
- Reduce SPDR Technology Sector (XLK) by 1% of the portfolio.
November 3rd
As we have been discussing, we are in the process of reducing overall equity exposure and doing some tax loss harvesting going into year-end to offset the gains taken earlier this year. While we expected the Fed to maintain its stance on hiking rates, Powell’s “super hawkish” comments sent the market back below support. With the employment report tomorrow and CPI next week, we are accelerating our selling a bit ahead of those reports.
We are trimming our Mega-cap technology exposure for now but will add back to these names opportunistically. We will also look to increase the “value” side of our portfolio heading into next year. We reduced the areas with the largest concentrations in the ETF model to reduce risk and rebalance holdings.
We are also adding to our 1-3 month Treasury Bill position (BIL) to absorb some excess cash holdings.
Equity Model
- Reduce Microsoft (MSFT) by 1% of the portfolio.
- Selling 1% of Google (GOOG)
- Trimming Apple (AAPL) by 0.5%
ETF Model
- Reducing the SPDR Technology (XLK) by 2% to match our technology weighting in the Equity model.
- Trimming SPDR Communications (XLC) by 1.5% of the portfolio.
- Reducing SPDR Health Care (XLV) by 1% of the portfolio.
- Trimming SPDR Discretionary (XLY) by 0.5% of the portfolio.

Lance Roberts, CIO
Have a great week!


