Can The Bulls Defy The Odds Of September Weakness? 09-03-21


In this 09-03-21 issue of “‘Can The Bulls Defy The Odds Of September Weakness?“
- Can Bulls Defy The September Weakness
- Who’s Going To Fund The Deficit
- As Expected – GDP Gets Downgraded Sharply
- Portfolio Positioning
- Sector & Market Analysis
- 401k Plan Manager
Follow Us On: Twitter, Facebook, Linked-In, Sound Cloud, Seeking Alpha
Is It Time To Get Help With Your Investing Strategy?
Whether it is complete financial, insurance, and estate planning, to a risk-managed portfolio management strategy to grow and protect your savings, whatever your needs are, we are here to help.
Schedule your “FREE” portfolio review today.

Can The Bulls Defy The Odds Of September Weakness
While we had previously discussed that August tends to be one of the weaker months of the year, the bulls defined that weakness posting an almost 3% gain. However, as discussed in our Daily Market Commentary on Wednesday:
“August seasonality was a bust with the market advancing 2.6%. Will September seasonality prove to be more accurate?”
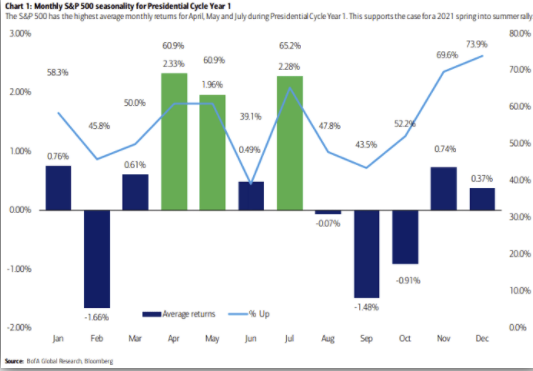
For now, the bullish bias remains strong as a barrage of weaker than expected economic data from GDP to manufacturing and employment give hope the Fed may forestall their “tapering” plans. But, as we will discuss in a moment, we think the bulls may be correct for a different reason.
However, in the meantime, the “stairstep” advance continues with fundamentally weak companies making substantial gains as speculation displaces investment in the market. Thus, while prices remain elevated, money flows weaken, suggesting the next downturn is roughly one to two weeks away. So far, those corrections remain limited to the 50-dma, which is approximately 3% lower than Friday’s close, but a 10% correction to the 200-dma remains a possibility.
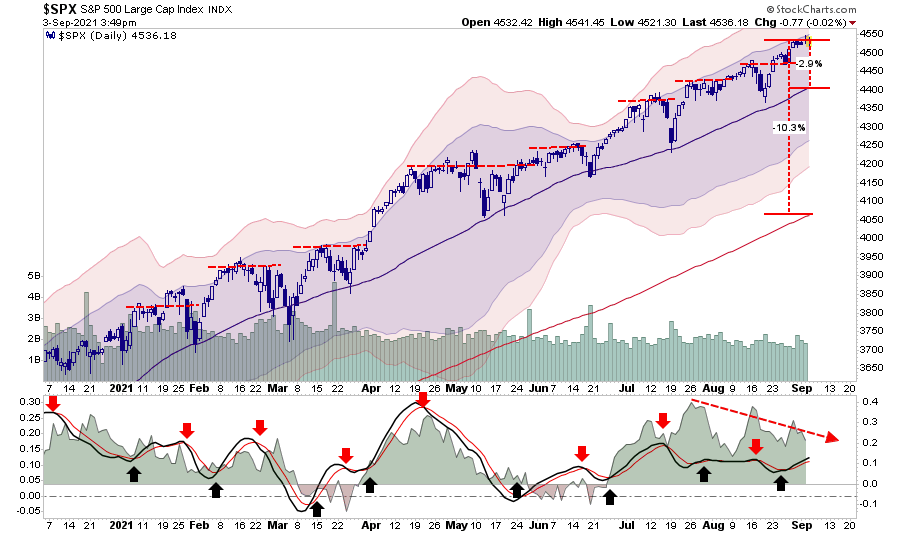
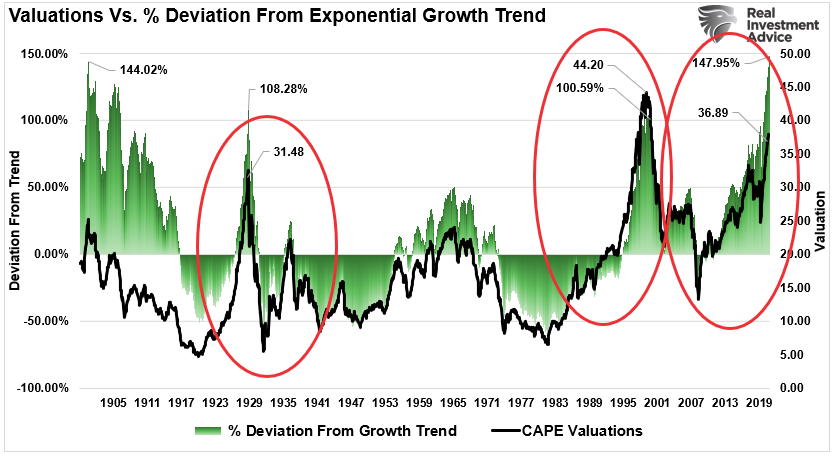
While there seems to be little concern relative to the market’s advance over the last year, maybe that should be the concern given the sharpness of that advance. I will discuss the history of “market melt-ups” and their eventual outcomes in an upcoming article. However, what is essential to notice is the corresponding ramp in valuations as earnings fail to keep up with bullish expectations.
Significantly, investors never realize they are in a “melt-up” until after it is over.
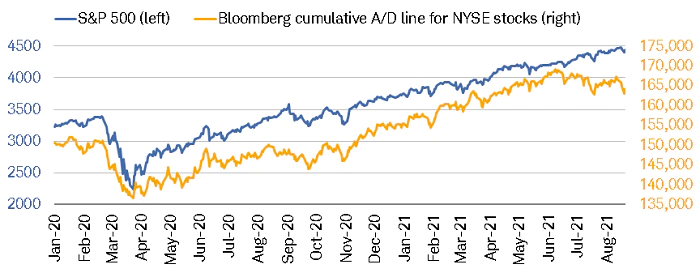
Breadth Remains Weak As Market Advances
At the moment, the bullish trend continues, and we must respect that trend for now. However, there are clear signs the advance is beginning to narrow markedly, which has historically served as a warning to investors.
” As shown in the chart below, although the S&P 500 traded at an all-time high as recently as last week, the cumulative advance/decline (A/D) line for the broader NYSE universe peaked on June 11 this year. The divergence between the two looks similar to early-September last year—the point at which it was mostly the “big 5” stocks within the S&P 500 (the “generals”) that had powered the S&P 500 to its September 2, 2020 high.” – Charles Schwab
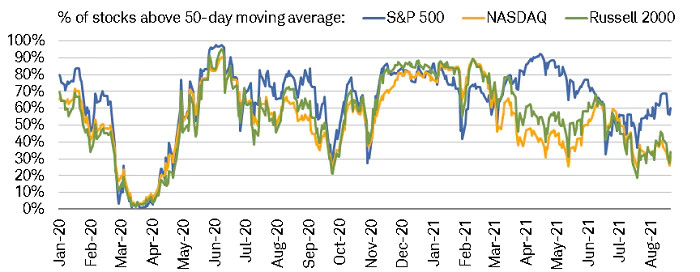
“The percentage of S&P 500 stocks trading above their 50-day moving averages peaked in April, troughed in June, improved until recently, but has come under pressure again. The same can’t be said for the NASDAQ and Russell 2000, which both peaked in early February, since which time they’ve generally been descending.”
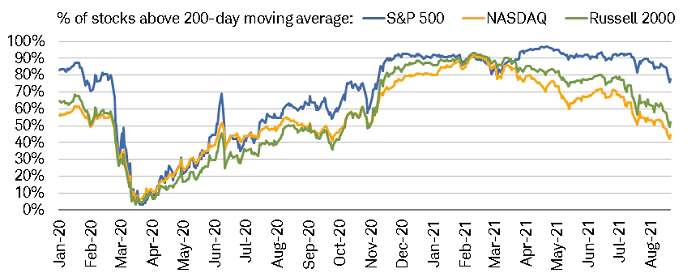
“Relative to their 200-day moving averages (DMA), all three indexes have been generally trending lower since April, as shown in the second chart below.” – Charles Schwab
Of course, as we repeat each week, while we are pointing out the warning signs, such does not mean selling everything and going to cash. However, it does serve as a visible warning to adjust your risk exposures accordingly and prepare for a potentially bumpy ride.
“Just because you put on a seatbelt when the plane is landing, doesn’t mean you are going to crash. But is a logic precaution just in case.”

Can The Fed Really Taper?
We have noted the rising number of Fed speakers discussing the need to begin “tapering” the Fed’s balance sheet purchases in recent weeks. With employment returning well into what is historically considered “full employment,” surge in job openings, and rising inflation, the need to taper is evident. As noted in our daily market commentary:
“PCE, met expectations rising 0.4% in July. The level was 0.1% below the June reading. The year-over-year rate is 4.2%, which is more than double the Fed’s 2% inflation target. Importantly it suggests the Fed should be moving to tighten monetary policy. However, the trimmed-mean PCE was inline at 2% giving the Fed some “wiggle-room” for now, but likely not for long.“

While the Fed may have some wiggle room short-term, the trimmed-mean PCE will catch up with PCE over the next month.
The point is that the Fed is now getting pushed into needing to tighten monetary policy to quell inflationary pressures. However, a rising risk suggests they may be “trapped” in continuing their bond purchases and risking both an inflationary surge and creating market instability.
That risk is the “deficit.”
Who Is Going To Fund The Deficit
As discussed recently, the current mandatory spending of the Government consumes more than 100% of existing tax revenues. Therefore, all discretionary spending plus additional programs such as “infrastructure” and “human infrastructure” comes from debt issuance.
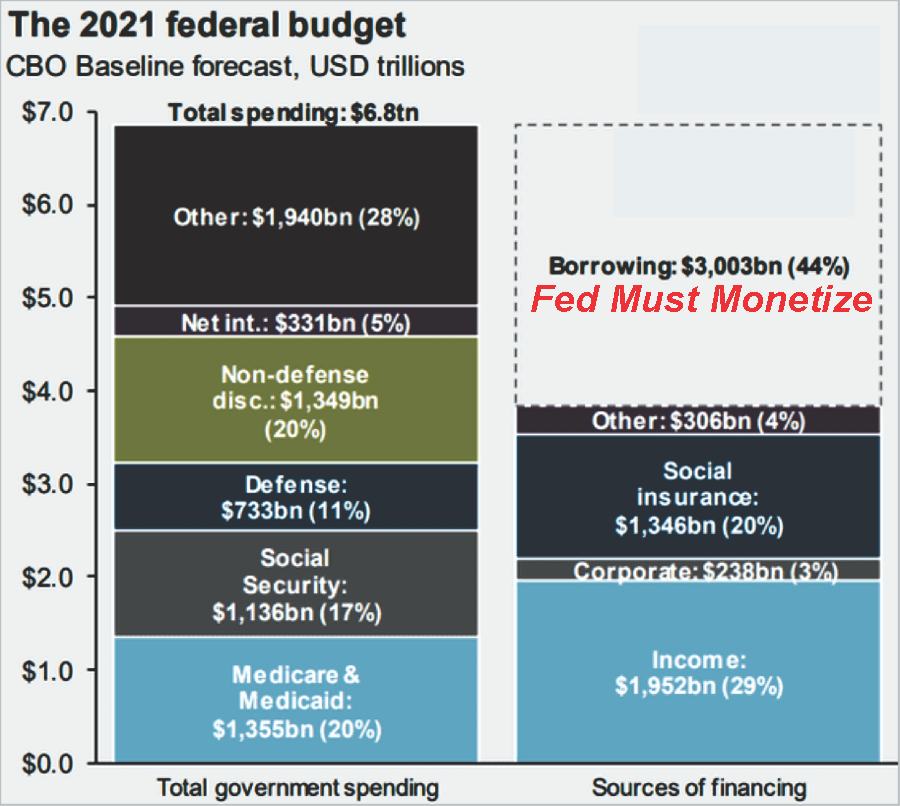
As shown, the 2021 budget will push the current deficit towards $4-Trillion requiring the Federal Reserve to monetize at least $1 Trillion of that issuance per our previous analysis.
The scale and scope of government spending expansion in the last year are unprecedented. Because Uncle Sam doesn’t have the money, lots of it went on the government’s credit card. The deficit and debt skyrocketed. But this is only the beginning. The Biden administration recently proposed a $6 trillion budget for fiscal 2022, two-thirds of which would be borrowed.” – Reason
The CBO (Congressional Budget Office) recently produced its long-term debt projection through 2050, ensuring poor economic returns. I reconstructed a chart from Deutsche Bank showing the US Federal Debt and Federal Reserve balance sheet. The chart uses the CBO projections through 2050.
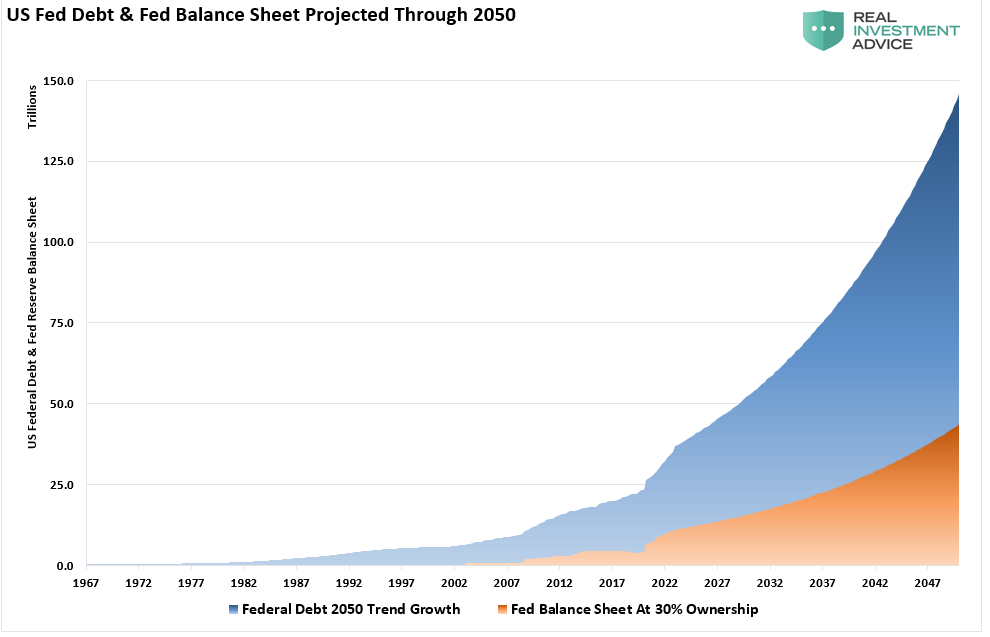
The federal debt load will climb from $28 trillion to roughly $140 trillion at the current growth rate by 2050.
The problem, of course, is that the Fed must continue monetizing 30% of debt issuance to keep interest rates from surging and wrecking the economy.
Let than sink in for a minute.
If that is indeed the case, the Fed will not be able to “taper” their balance sheet purchases unless they are willing to risk a surge in interest rates, a collapse in economic growth, and a deflationary spiral.

As Expected Q3-GDP Gets Slashed
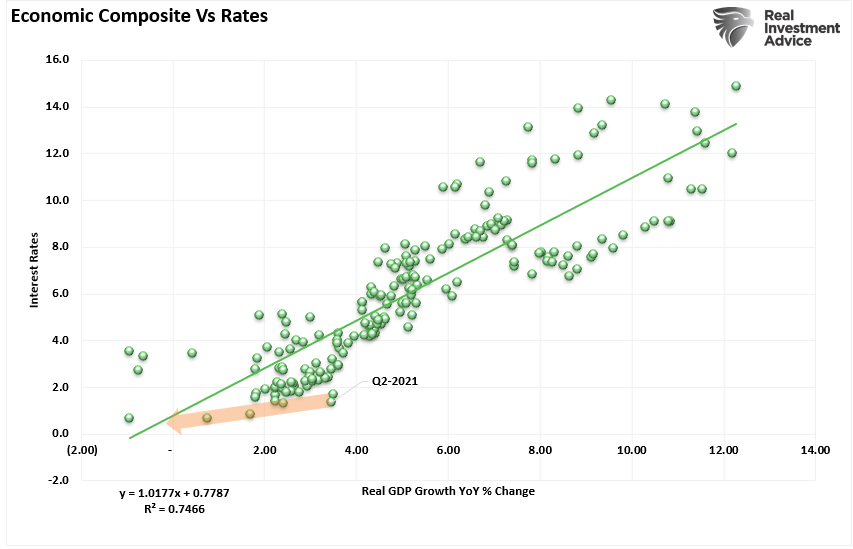
Since the beginning of this year, we have penned several articles stating that economic growth would ultimately disappoint when fueled by an artificial stimulus. Specifically, we noted that “bonds were sending an economic warning.” To wit:
“As shown, the correlation between rates and the economic composite suggests that current expectations of sustained economic expansion and rising inflation are overly optimistic. At current rates, economic growth will likely very quickly rturn to sub-2% growth by 2022.”
The disappointment of economic growth is also a function of the surging debt and deficit levels, which, as noted above, will have to be entirely funded by the Federal Reserve.
On Thursday, both the Atlanta Fed and Morgan Stanley slashed their estimates for Q3 growth as economic data continues to disappoint.
“The GDPNow model estimate for real GDP growth (seasonally adjusted annual rate) in the third quarter of 2021 is 3.7 percent on September 2, down from 5.3 percent on September 1.” – Atlanta Fed
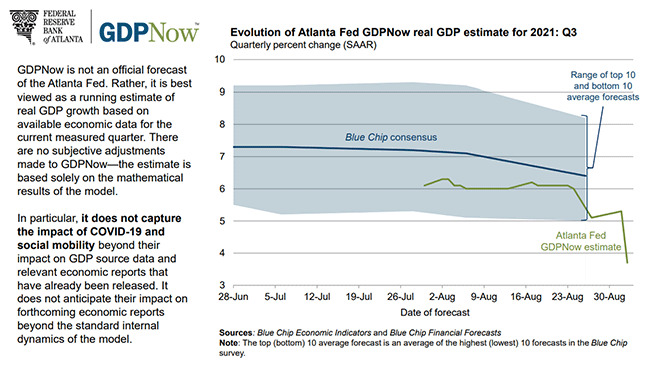
Notably, there were significant downward revisions to consumption and investment, declining from 2.6% and 23.4% to 1.9% and 19.3%, respectively. However, as we noted previously, such is not surprising as “stimulus” leaves the system, and the economic drivers return to normalcy.
Morgan and Goldman As Well
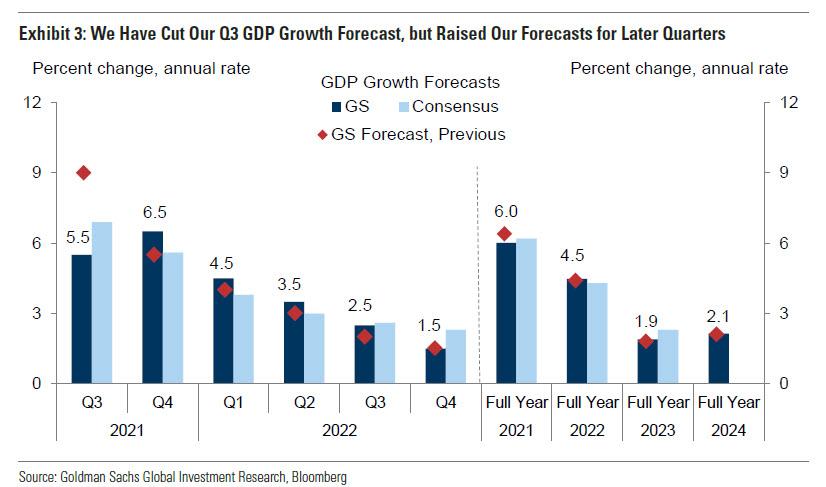
As stated, Morgan Stanely also slashed their estimates:
“We are revising down 3Q GDP tracking to 2.9% from 6.5%, previously. Our forecast for 4Q GDP remains at 6.7%. The revision to 3Q implies full year 4Q/4Q GDP at 5.6% (5.7%Y) this year – 1.4pp lower than the Fed’s forecast of 7.0% in its June Summary of Economic Projections (SEP), and 0.7pp below Bloomberg consensus of economists at 6.3%.
An examination of the data reveals that the slowdown is not broad-based and primarily reflects payback from stimulus spending as well as continued supply chain bottlenecks. The swing factor is largest in spending on big-ticket durable goods that benefited most from stimulus checks and are affected most by lack of inventory and price increases due to supply shortages, for example motor vehicles.”
Via Zerohedge
As we discussed previously, these two downgrades were playing catchup to our previous analysis and Goldman’s downgrade two weeks ago. To wit:
“We have lowered our Q3 GDP forecast to +5.5%, reflecting hits to both consumer spending and production. Spending on dining, travel, and some other services is likely to decline in August, though we expect the drop to be modest and brief. Production is still suffering from supply chain disruptions, especially in the auto industry, and this is likely to mean less inventory rebuild in Q3.” – Goldman Sachs
Investors should not overlook the importance of these downgrades.
In Case You Missed It

Earnings Estimates At Risk
In our post on “Peak Economic And Earnings Growth,” we stated that corporate earnings and profits ultimately get derived from economic activity (personal consumption and business investment). Therefore, it is unlikely the currently lofty expectations will get met.
The problem for investors currently is that analysts’ assumptions are always high, and markets are trading at more extreme valuations, which leaves little room for disappointment. For example, using analyst’s price target assumptions of 4700 for 2020 and current earnings expectations, the S&P is trading 2.6x earnings growth.
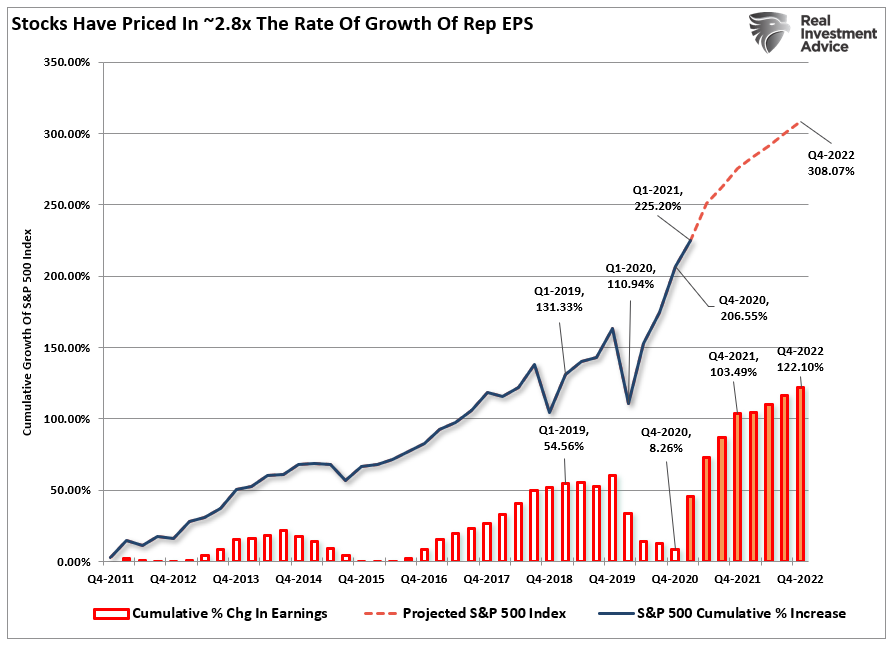
Such puts the current P/E at 25.6x earnings in 2020, which is still expensive by historical measures.
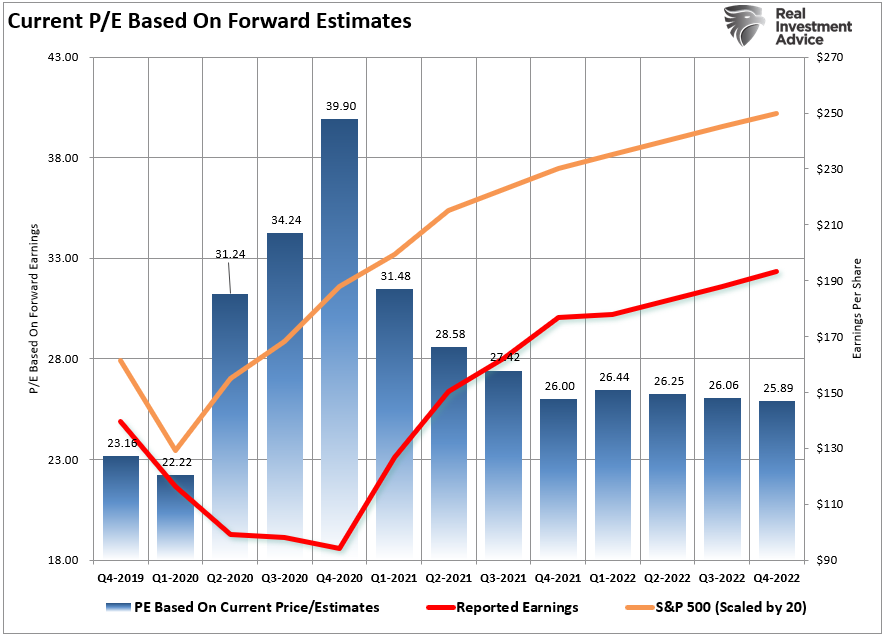
That also puts the S&P 500 grossly above its linear trend line as earnings growth begins to revert.
Through the end of this year, companies will guide down earnings estimates for a variety of reasons:
- Economic growth won’t be as robust as anticipated.
- Potentially higher corporate tax rates could reduce earnings.
- The increased input costs due to the stimulus can’t get passed on to consumers.
- Higher interest rates increasing borrowing costs which impact earnings.
- A weaker consumer than currently expected due to reduced employment and weaker wages.
- Global demand weakens due to a stronger dollar impacting exports.
Such will leave investors once again “overpaying” for earnings growth that fails to materialize.

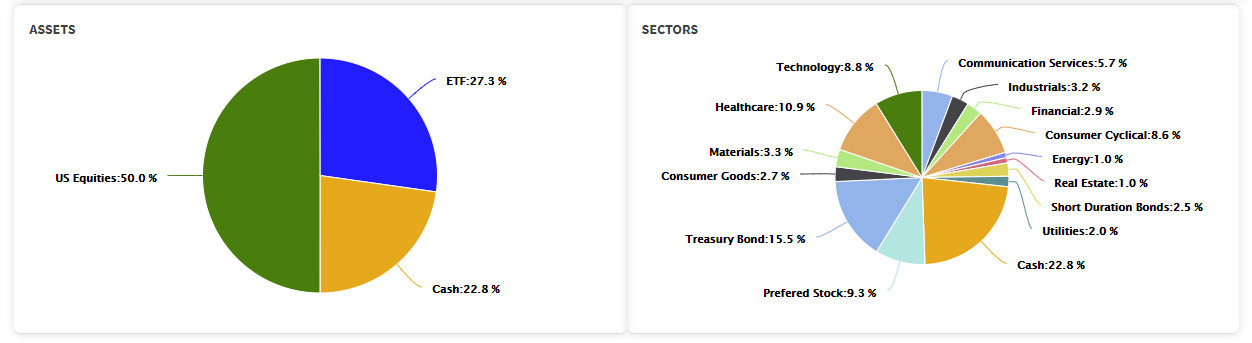
Portfolio Update
Our current model allocation remains primarily unchanged. However, we did increase our longer-duration bond holdings again last week.
As discussed with RIAPRO subscribers (free 30-day trial), we manage risk exposures to reduce volatility while still participating with the market’s advance. As a result, stock selection has been key to carrying an overweight cash position and outperforming our benchmark index.
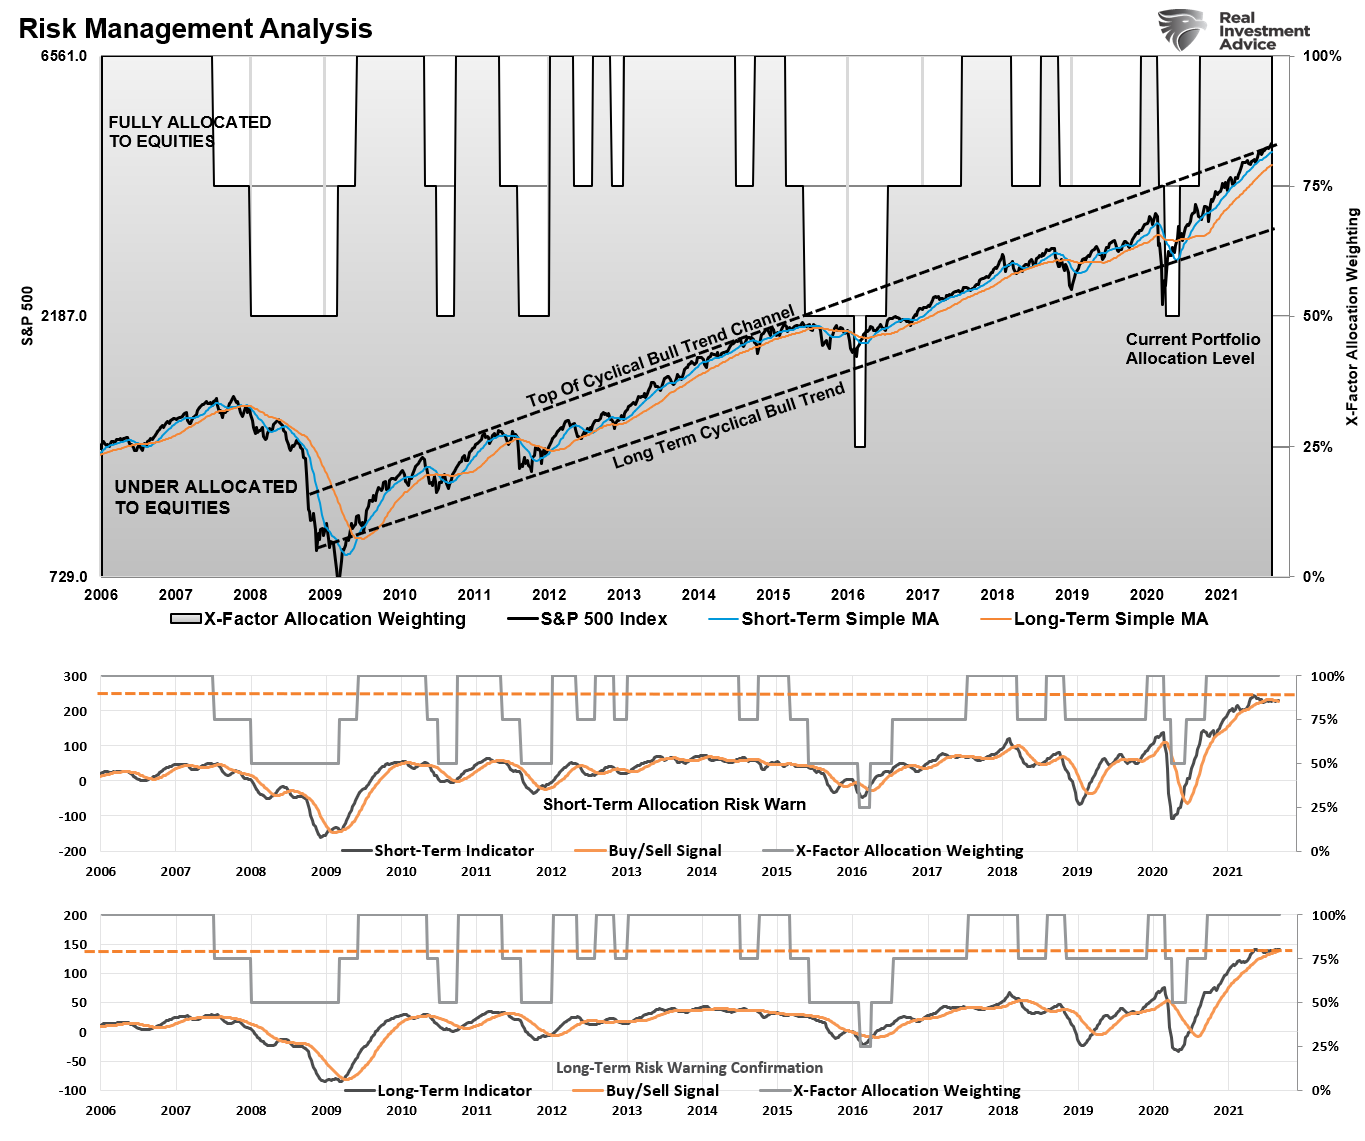
As noted above, internal measures continue to deteriorate, suggesting a rising risk profile to the markets. Unfortunately, investors continue to ignore these warnings due to the “fear of missing out.” Given we manage the retirement assets of clients, we do not have the luxury to do so.
If you are trying to navigate the market cycle currently, you can do things to improve your “survival rate.”
- Avoid the “herd mentality” of paying increasingly higher prices without sound reasoning.
- Do your own research and avoid “confirmation bias.”
- Develop a sound long-term investment strategy that includes “risk management” protocals.
- Diversify your portfolio allocation model to include “safer assets.”
- Control your “greed” and resist the temptation to “get rich quick” in speculative investments.
- Resist getting caught up in “what could have been” or “anchoring” to a past value. Such leads to emotional mistakes.
- Realize that price inflation does not last forever. The larger the deviation from the mean, the greater the eventual reversion will be. Invest accordingly.
The increase in speculative risks, combined with excess leverage, leaves the market vulnerable to a sizable correction. But, unfortunately, the only missing ingredient is the catalyst that brings “fear” into an overly complacent marketplace.
Currently, investors believe “this time IS different.”
“This time” is different only because the variables are different. Of course, the variables always are, but outcomes are always the same.
Have a great Labor Day weekend.
By Lance Roberts, CIO
Market & Sector Analysis
Analysis & Stock Screens Exclusively For RIAPro Members
Discover All You Are Missing At RIAPRO.NET
Come find out what our RIAPRO.NET subscribers are reading right now! Risk-Free For 30-Day Trial.
- Sector & Market Analysis
- Technical Gauge
- Fear/Greed Positioning Gauge
- Sector Rotation Analysis (Risk/Reward Ranges)
- Stock Screens (Growth, Value, Technical)
- Client Portfolio Updates
- Live 401k Plan Manager
THE REAL 401k PLAN MANAGER
A Conservative Strategy For Long-Term Investors
NOTE: We’re moving the 401k Plan Manager to our new website. over the next couple of weeks
Commentary
The market advance continues its bullish ways with little disruption. While the market is currently very overbought and deviated from longer-term averages, the momentum remains strong for now.
Continue to move all new contributions to either money market or stable value funds for now. Also, rebalance your equities and bonds back to weightings as equities are likely now out of tolerance.
International and small-cap stocks continue to underperform as of late as the momentum chase has turned back to the growth trade. Remain underweight these sectors.
There is no need to be aggressive here. With our money-flow “buy signal” intact, the current bias remains upward. However, there isn’t likely a lot of upside to the market as September is historically weak. So, for now, we would recommend not being overly aggressive.
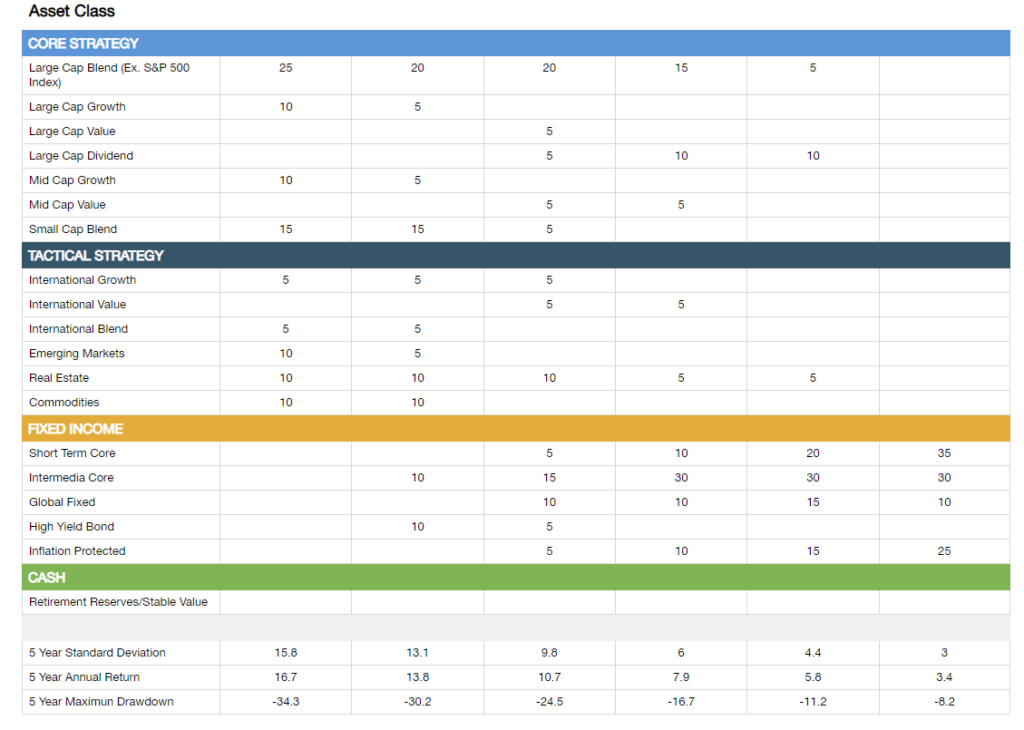
Model Descriptions
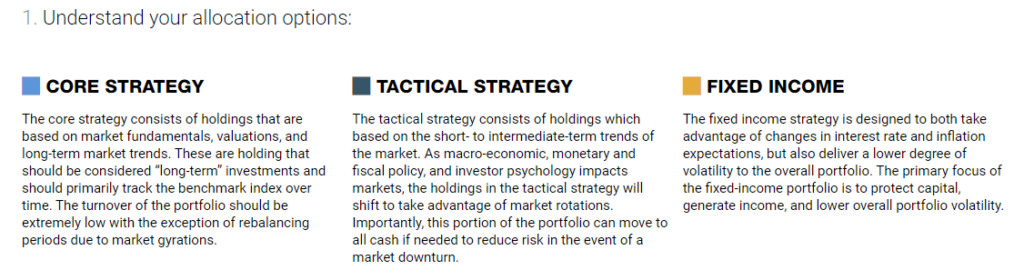
Choose The Model That FIts Your Goals
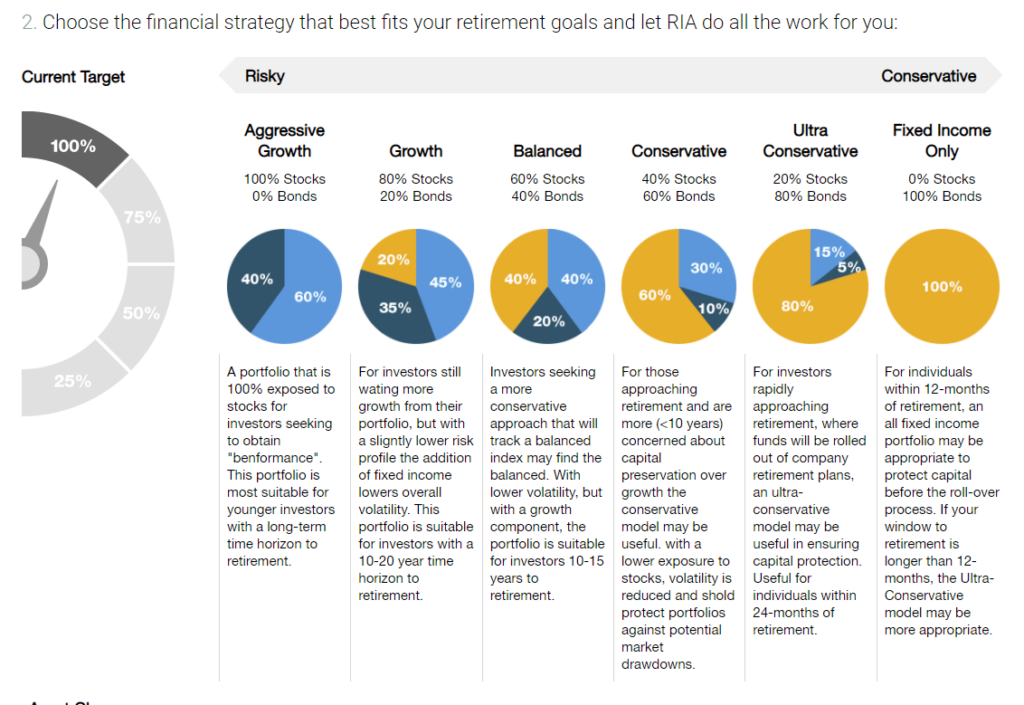
Model Allocations
If you need help after reading the alert, do not hesitate to contact me.
Or, let us manage it for you automatically.

401k Model Performance Analysis
Model performance is a two-asset model of stocks and bonds relative to the weighting changes made each week in the newsletter. Such is strictly for informational and educational purposes only, and one should not rely on it for any reason. Past performance is not a guarantee of future results. Use at your own risk and peril.

Have a great week!


