Investors Fail To “BTFD” As They Await Fed “Taper.” 09-17-21


In this 09-17-21 issue of “‘Investors Fail To BTFD As They Await Fed Taper.“
- Investors Fail To BTFD
- The Slope Of Hope
- A Reason The Fed Can’t Taper…Yet
- Portfolio Positioning
- Sector & Market Analysis
- 401k Plan Manager
Follow Us On: Twitter, Facebook, Linked-In, Sound Cloud, Seeking Alpha
Is It Time To Get Help With Your Investing Strategy?
Whether it is complete financial, insurance, and estate planning, to a risk-managed portfolio management strategy to grow and protect your savings, whatever your needs are, we are here to help.
Schedule your “FREE” portfolio review today.

Market Starts A Correction Right On Cue
“That correction started on Monday with the week ending in 5-straight down days which is the worse slide since February.
However, while that sounds terrible, the total decline for the week was just -1.69%. Yes, that’s it, less than 2%. While CNBC probably ran their “Markets In Turmoil” segment, traders huddled over candles and incense chanting incantations at the Fed for more accommodation.“
The hope, of course, was that retail investors would step in to “Buy The Dip,” as they have done repeatedly this year, at the 50-dma. But, interestingly, such was not the case with the market finishing the week down, as shown below.
If you back the time frame up a bit, you kind of need to squint to see the correction.
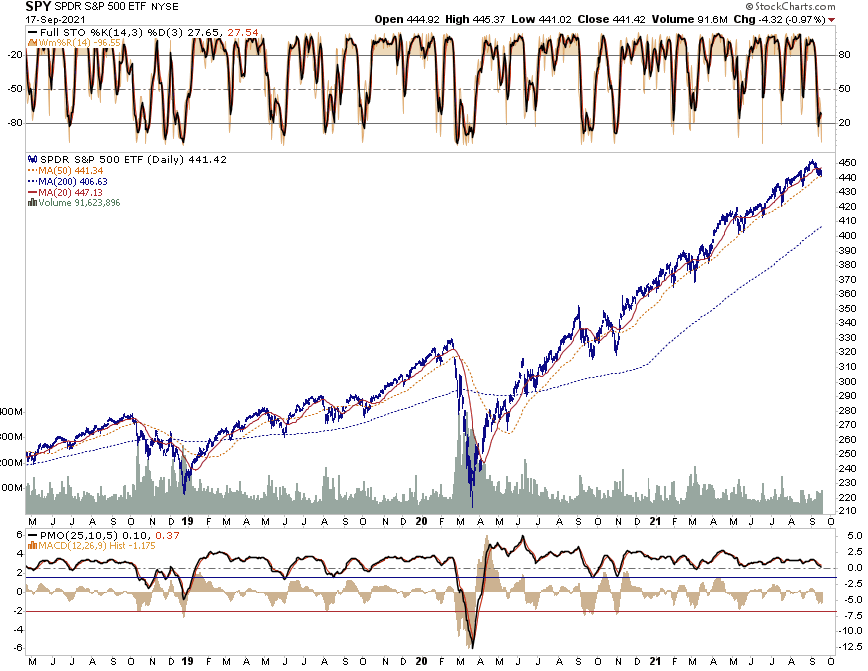
Perspective is always important.
Waiting On The Fed
We can attribute the weakness on Friday to “quadruple witching,” where every type of option (stock index futures, stock index options, stock options, and single stock futures) all expired simultaneously.
However, history is also not on the market’s side, with the S&P 500 averaging a 0.4% decline for September, the worst of any month, according to the Stock Trader’s Almanac. Friday, in particular, began a historically weak period for stocks as those September losses typically come in the back half of the month.
Also, the markets are a bit nervous about the Fed’s meeting next week with an announcement of “tapering” asset purchases expected.
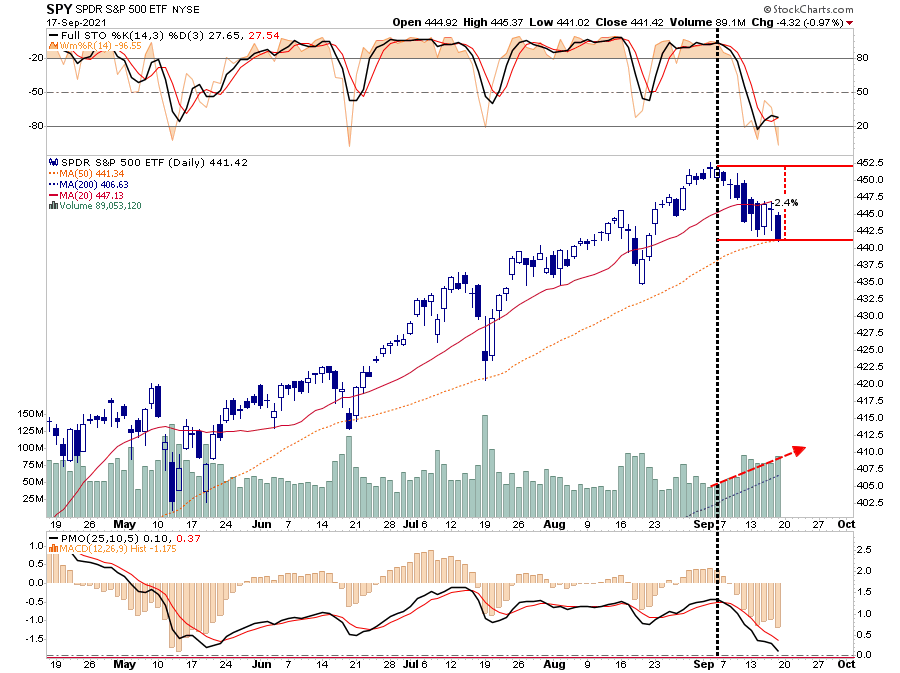
While all that sounds terrible, the total decline for the last two weeks is just -2.4%. Yes, that’s it, just 2.4%. As noted, it looks much worse on a short-term chart due to the low volatility advance this year.
As noted last week, the sell-off to the 50-dma was not a surprise.
“With sell signals in place, volume rising, and breadth weak, a retest of the 50-dma early next week will not be a surprise. The question will be whether traders show up again, as they have done every other time over the last 6-months to ‘buy the dip.’
As shown, the market remains well confined to its rising trend with support sitting at the 50-dma. Volatility did pick up late last week as volume spiked suggesting more selling pressure on Monday.
With the market very oversold, a counter-trend bounce next week will not be a surprise. However, if the market fails to hold the 50-dma, the risk of a more substantial correction is likely.
Longer-term market risk remains exceptionally high.

It’s Always Time To Buy Stocks
When looking at long periods of market history, the current market stands out as an apparent anomaly. Many younger investors in the markets today are unaware of the “melt-up” in prices and the Fed’s naivety of the laws of physics. After more than a decade of rising prices, accelerating markets seem entirely normal, detached from underlying fundamentals. During these periods, investors create new acronyms like “TINA” and “BTFD” to rationalize accelerating prices.
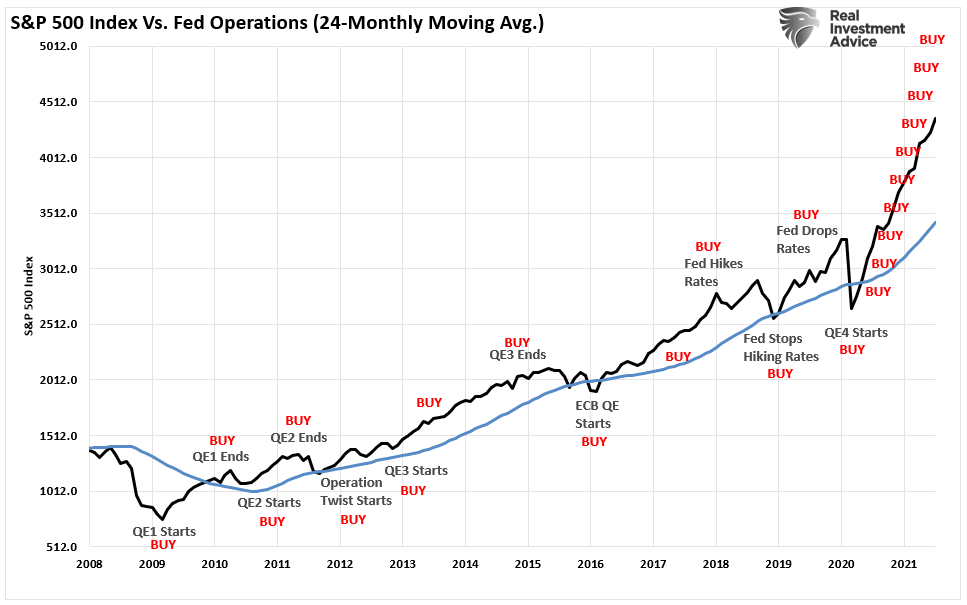
However, a more extended look at price history suggests the current market environment is anything but ordinary. More importantly, the “moral hazard” created by the Federal Reserve’s continuous bailouts have put individual investors at significant risk.
In the short term, like the chart above, prices don’t seem that extraordinarily stretched. However, this is because the chart lacks context from a historical perspective. Once we look at the market from 1900 to the present, a different picture emerges compared to its exponential long-term growth trend.
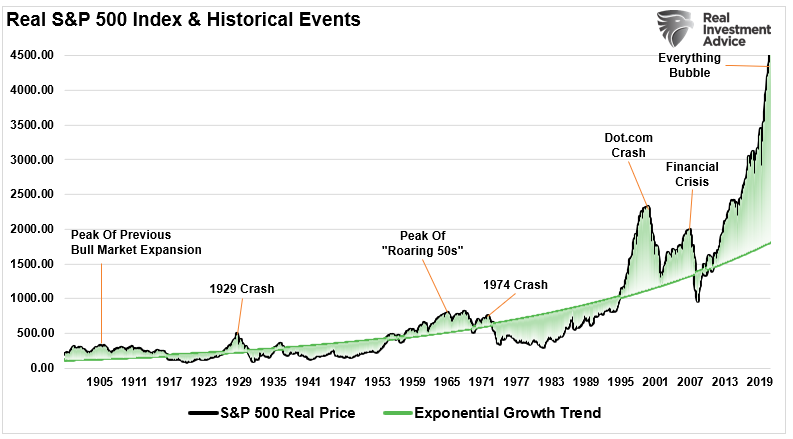
Usually, I would present a long-term chart like this using a log-scale which reduces the impact of large numbers on the whole. However, in this instance, such is not appropriate as we examine the historical deviations from the underlying growth trend.
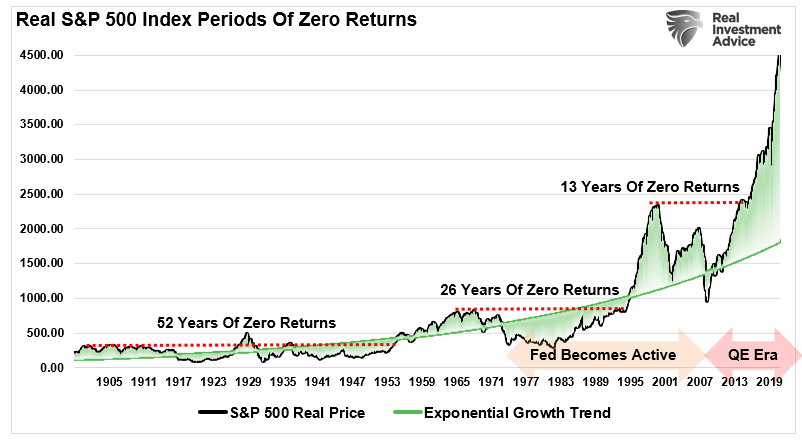
What you should take away from the chart above is apparent. Investing capital when prices are exceedingly above the underlying growth trend repeatedly had poor outcomes. Investing capital at peak deviations led to very long periods of ZERO returns on capital. (Interestingly, as the Fed became active in the markets, the periods of zero returns got cut in half.)

The Slope Of Hope
Sir Issac Newton discovered the relationship between the motion of the moon and the motion of a body falling freely on Earth. His dynamical and gravitational theories established the modern quantitative science of gravitation. Moreover, Newton realized that this force could be, at long range, the same as the force with which Earth pulls objects on its surface downward.
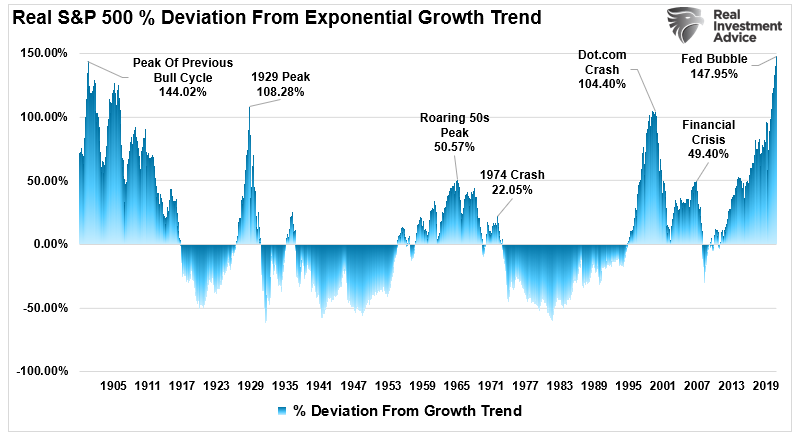
Notably, there is a clear “gravitational pull” of prices to the exponential growth trend line. Thus, without fail, when prices have deviated well above the trend line, there was an eventual reversion below the trend.
Even on a short-term basis, 1990-present, the current advance also stands out. The chart below shows the slope of the linear regression of the market. Historically, markets trade above and below that linear trend. However, currently, the slope is surging higher.
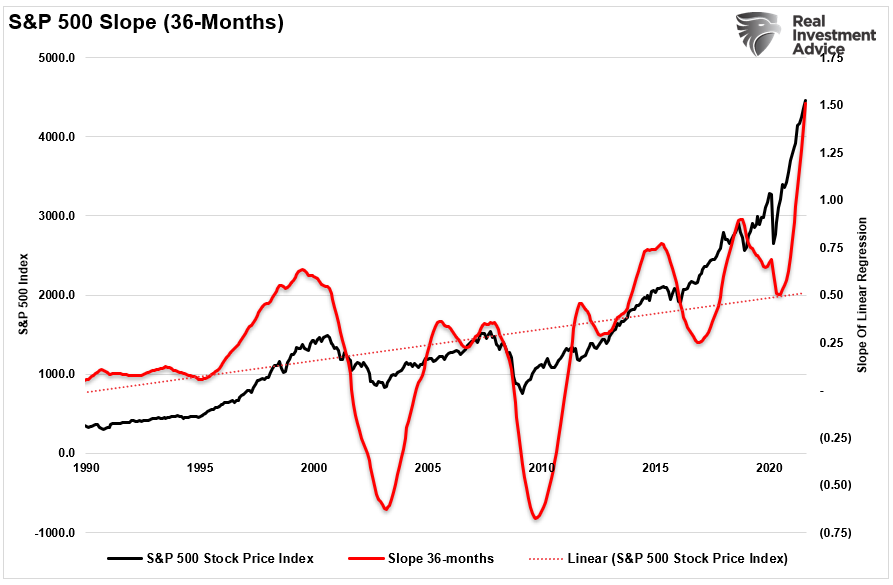
It is important to note that these are all monthly data points. As such, change will come slowly. The problem for investors is that when a “warning” doesn’t immediately devolve into a correction, it gets assumed the warning is wrong.
Therefore, it is essential to be aware of the excesses that currently exist in the financial markets. At some point, something will happen, and a change in “psychology” will occur. When the algorithms eventually switch from “BTFD” to “STFR” (Sell The ****ing Rally), it will be too late for most to avoid capital destruction.
For now, BTFD remains alive and well, as long as the Fed “put” remains.
But is that about to change? Maybe not.
In Case You Missed It

A Reason The Fed Can’t Taper…Yet
While the market expects the Fed to announce “taper” plans next week, there is one reason they might stall.
“As repo expert Scott Skyrm said, ‘for the past several years, Congress always reached a compromise before the possibility of a ‘technical default’ creeped into the markets. This year, as we get closer to the ‘drop dead date’ (which hasn’t yet been determined) the markets will start pricing in distortions.
Mitch McConnell, Senate Minority Leader, repeated to Secretary Yellen what he has said publicly since July: ‘This is a unified Democrat government, engaging in a partisan reckless tax and spending spree. They will have to raise the debt ceiling on their own and they have the tools to do it.” – Zerohedge
As we discussed previously, the current mandatory spending of the Government consumes more than 100% of existing tax revenues. Therefore, all discretionary spending plus additional programs such as “infrastructure” and “human infrastructure” comes from debt issuance.
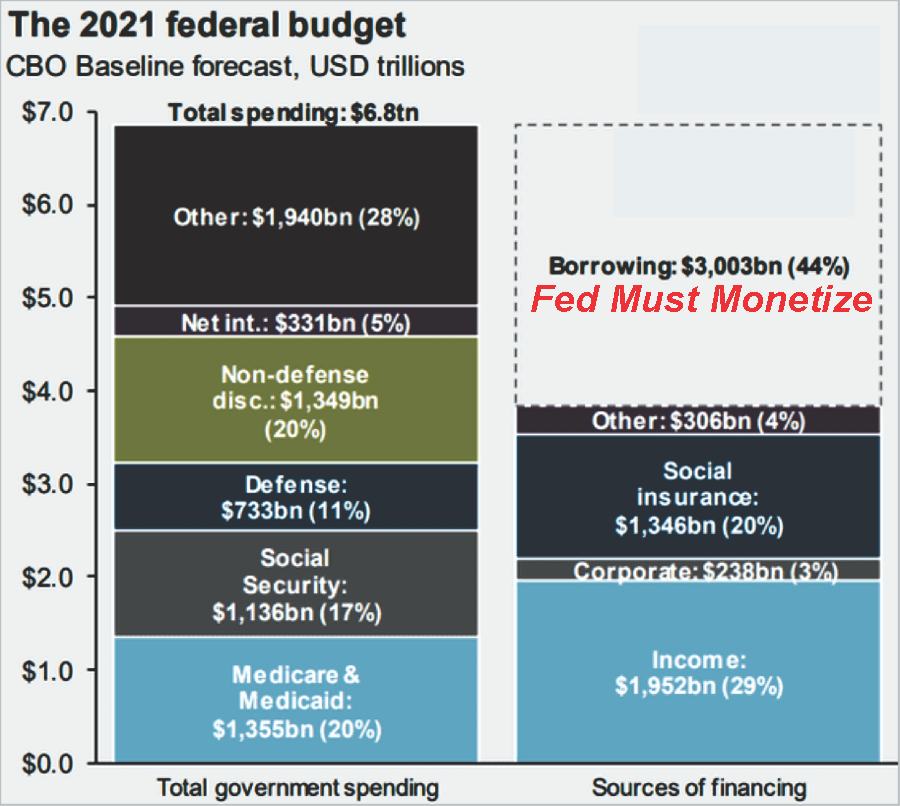
As shown, the 2021 budget will push the current deficit towards $4-Trillion requiring the Federal Reserve to monetize at least $1 Trillion of that issuance per our previous analysis. We discussed this previously, but there is a critical point.
The scale and scope of government spending expansion in the last year are unprecedented. Because Uncle Sam doesn’t have the money, lots of it went on the government’s credit card. The deficit and debt skyrocketed. But this is only the beginning. The Biden administration recently proposed a $6 trillion budget for fiscal 2022, two-thirds of which would be borrowed.” – Reason
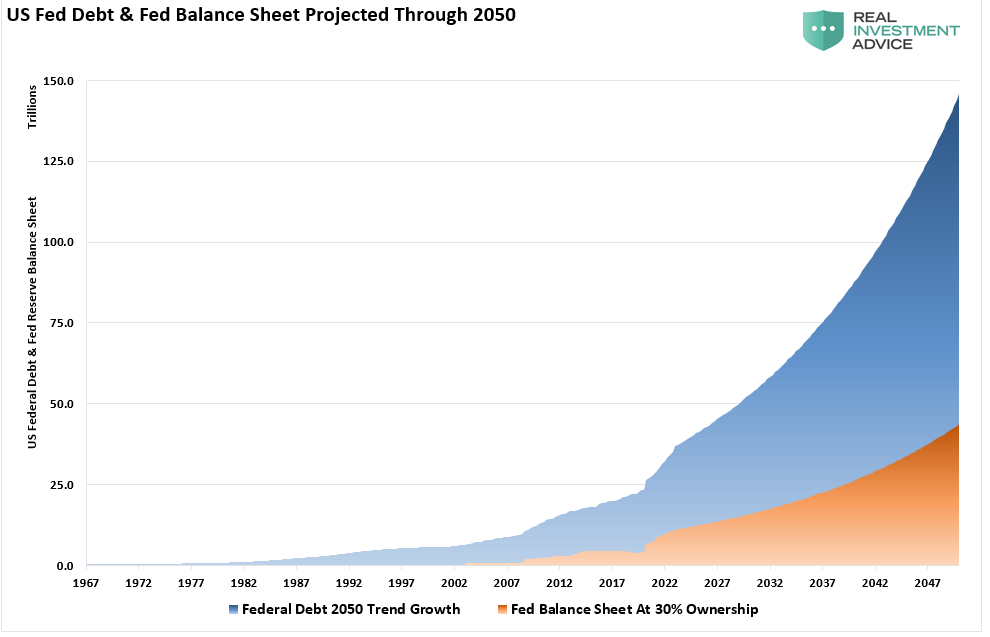
The CBO (Congressional Budget Office) recently produced its long-term debt projection through 2050, ensuring poor economic returns. I reconstructed a chart from Deutsche Bank showing the US Federal Debt and Federal Reserve balance sheet. The chart uses the CBO projections through 2050.
For The Democrats It’s “Reconciliation Or Bust!”
The problem for the Democratically controlled Congress is they can not issue a “Continuing Resolution” solely to lift the debt ceiling. Such would entail passing a resolution that takes last year’s base budget spending and adding 8% to it.
While doing so would immediately solve the funding problem for the Government, it would force Congress to abandon the “reconciliation process” for passing their massive socialistic, debt-driven agenda. For the Democrats, who only hold slim majority control, their spending plans depend on the reconciliation process. The process is a budgetary procedure to align the House and Senate on spending bills and only requires a majority vote. (51%).
Such was a point made by Bloomberg:
“The expansive $3.5 trillion package entails much of Biden’s first-year agenda and includes a mix of tax increases on the wealthy and corporations, as well as greater spending in areas including child care, health care, and climate change.
With Republicans unified in opposition, Democrats are pushing it through the Senate using a process called reconciliation that lets them skirt a GOP filibuster. But with the slimmest of majorities in both chambers, Democrats will have to be unified in support.
The differences among Democrats manifested themselves as the House panels finished their work. The Ways and Means Committee deferred action on raising the limit on the state and local tax deductions, or SALT, and a sweeping proposal to regulate drug prices failed to win approval in the Energy and Commerce Committee. It will be up to party leaders to decide whether those provisions can be inserted later in the process and still muster the votes needed to pass the final bill.“
Caught In Their Own Trap
If the Democrats pass a continuing resolution to raise the debt ceiling and fund the Government without including the $3.5 trillion “human infrastructure” bill, then the spending bill would require a 60-vote margin to pass. Given that no Republicans will support the spending bill, a failure to include it in the budget process is a “death knell.”
“In reconciliation, we’re going to all come together to get something big done and it will be our intention to have every part of the Biden plan in a big and robust way. We’re going to work very hard to have unity, because without unity we’re not going to get anything.” – Senator Chuck Schumer, Senate Majority Leader
In other words, the Democrat’s own “greed” to shove their agenda down the throats of the American people, rather than working on a bipartisan solution (the way Congress is supposed to work), now has them trapped into a “do or die” situation.
Given the Democrats recognize this problem, they are unlikely to pass a “C.R.” anytime soon. Such will force the Treasury to use “emergency measures” to fund mandatory spending. If that is indeed the case, the Fed will not be able to “taper” their balance sheet purchases unless they are willing to risk a surge in interest rates, a collapse in economic growth, and a deflationary spiral.
Things are likely to start getting interesting.

Portfolio Update
The expected correction back to the 50-dma occurred right on schedule. As noted in our daily market commentary:
The graph below shows the incredible regularity of the market over the last four months. As shown, every 20 days the S&P 500 tends to decline for a few days, bottom, and then rally back to prior highs.
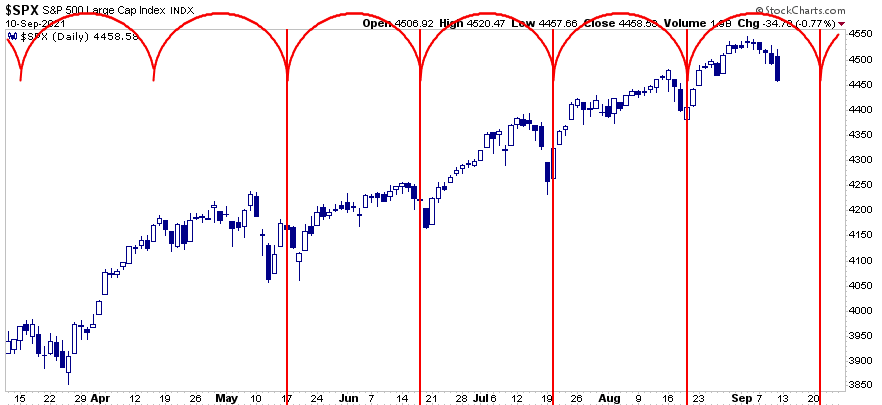
So the only question is whether this time will be different?
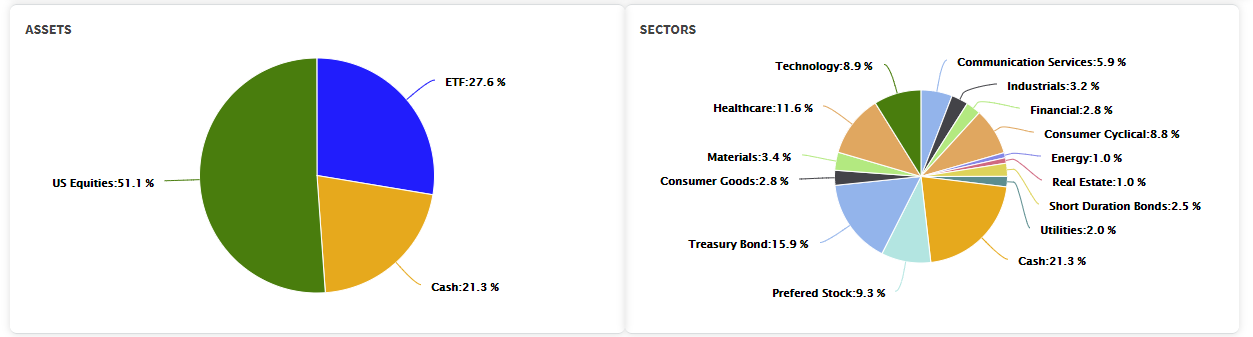
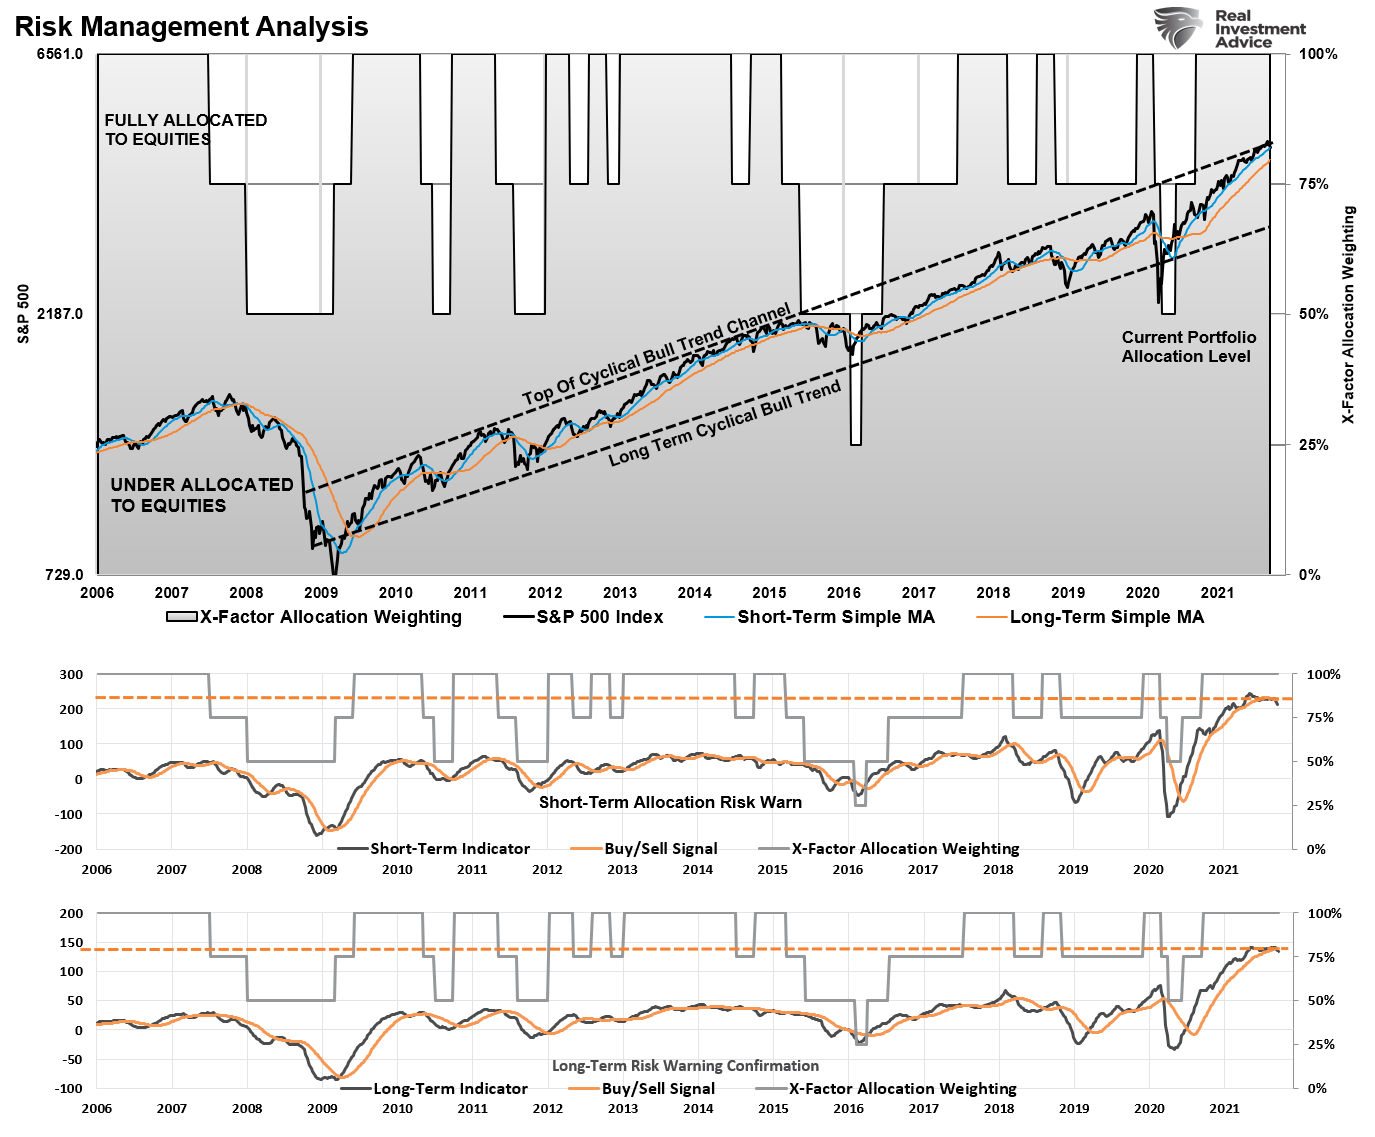
We have no idea what will happen next week, given the Fed’s announcement. Therefore, we are maintaining our current allocations. As noted last week, equity allocations remain underweight, bond duration remains close to our benchmark, and cash remains roughly 10% of our equity allocations.
While there currently seems to be “no risk” to taking on excessive “risk,” this overconfidence in our abilities always leads investors to make overwhelming bad decisions in their portfolio.
Let me close this week with a quote from Howard Marks of Oaktree Capital Management:
“Information and knowledge are two different things. We can have a lot of information without much knowledge, and we can have a lot of knowledge without much wisdom. In fact, sometimes too much data keeps us from seeing the big picture; we can “miss the forest for the trees.”
It’s extremely important to know history, but the trouble is that the big events in financial history occur only once every few generations. In the investment environment, memory and the resultant prudence regularly do battle with greed, and greed tends to win out.
Prudence is particularly dismissed when risky investments have paid off for a span of years. John Kenneth Galbraith wrote that the outstanding characteristics of financial markets are shortness of memory and ignorance of history.“
Have a great weekend.
By Lance Roberts, CIO
Market & Sector Analysis
Analysis & Stock Screens Exclusively For RIAPro Members
Discover All You Are Missing At RIAPRO.NET
Come find out what our RIAPRO.NET subscribers are reading right now! Risk-Free For 30-Day Trial.
- Sector & Market Analysis
- Technical Gauge
- Fear/Greed Positioning Gauge
- Sector Rotation Analysis (Risk/Reward Ranges)
- Stock Screens (Growth, Value, Technical)
- Client Portfolio Updates
- Live 401k Plan Manager
THE REAL 401k PLAN MANAGER
A Conservative Strategy For Long-Term Investors

Attention: In the next couple of weeks, the 401k plan manager will no longer appear in the newsletter. However, the link to the website will remain for your convenience. Be sure to bookmark it in your browser.
Commentary
Last week was more of the same. While the market action was a bit sloppier, the market decline barely encompassed 2%. Such is not a correction we can consider “buying into.”
As noted last week:
“The one thing to watch for is a violation of the 50-dma, which will most likely indicate we are starting a bit larger correction between 5-10%. Given the Fed looks to be aggressively moving towards tapering their balance sheet purchases, we may have seen the peak in the market for now. However, the bullish bias remains very strong, so it is still too early to get overly defensive.”
That remains the case this week. Continue to take some actions to reduce portfolio risk accordingly. Continue moving all new contributions to either money market or stable value funds for now. Rebalance your equities and bonds back to weightings as equities are now out of tolerance. Remain clear of international and small-cap stocks that continue to underperform,
There is no need to be aggressive here. We will have the opportunity eventually to do so, but it remains a seller’s market for now.
Model Descriptions
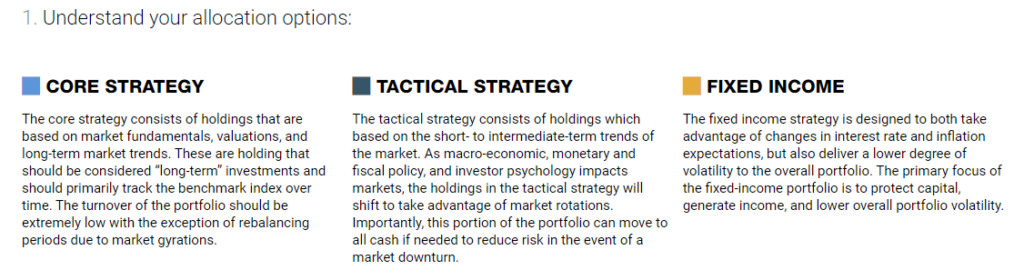
Choose The Model That FIts Your Goals
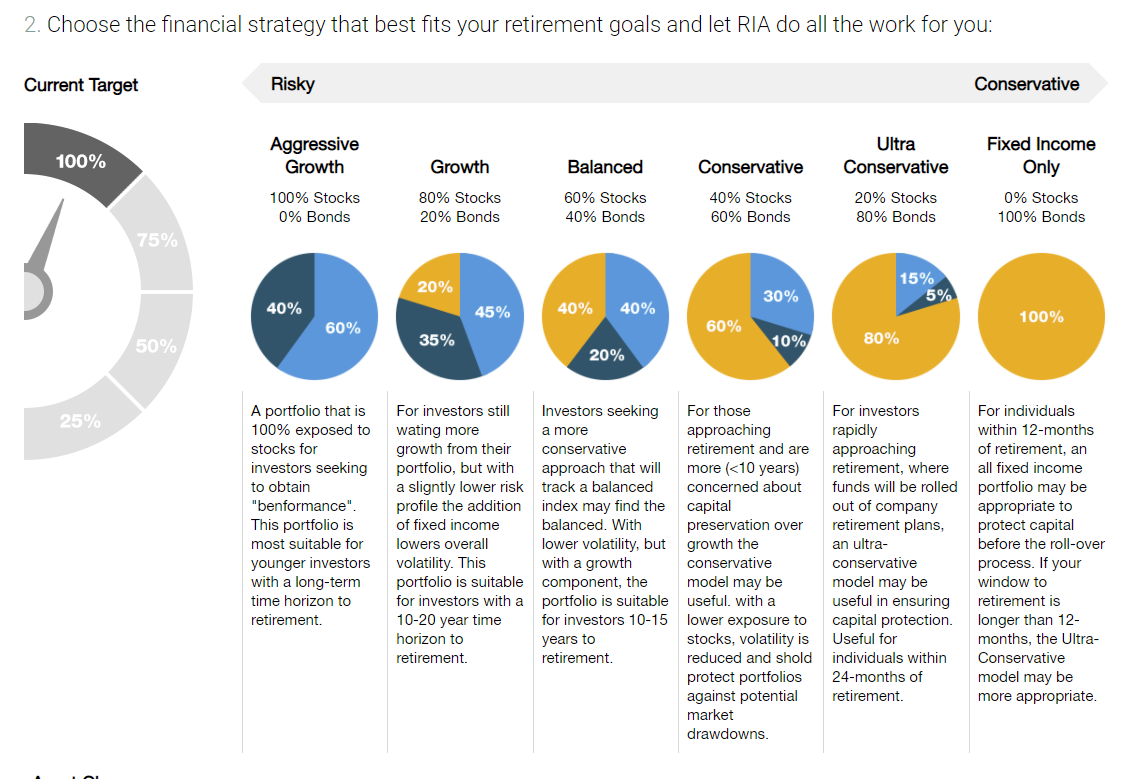
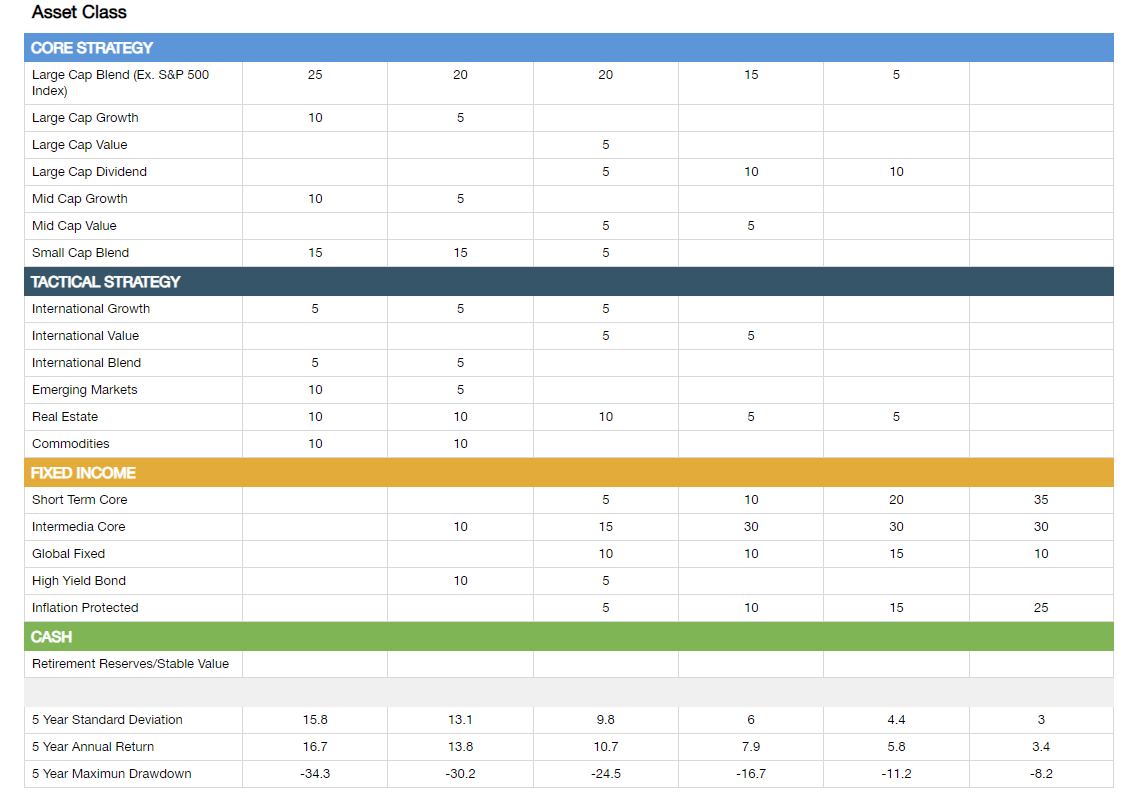
Model Allocations
If you need help after reading the alert, do not hesitate to contact me.
Or, let us manage it for you automatically.

401k Model Performance Analysis
Model performance is a two-asset model of stocks and bonds relative to the weighting changes made each week in the newsletter. Such is strictly for informational and educational purposes only, and one should not rely on it for any reason. Past performance is not a guarantee of future results. Use at your own risk and peril.

Have a great week!


