Rally Fails As Recession Risks Rise


In this 06-03-22 issue of “Rally Fails As Recession Risks Rise.”
- Rally Fails
- Recession Risk Higher Than We Think
- Portfolio Positioning
- Sector & Market Analysis
Follow Us On: Twitter, Facebook, Linked-In, Sound Cloud, Seeking Alpha
Need Help With Your Investing Strategy?
Are you looking for complete financial, insurance, and estate planning? Need a risk-managed portfolio management strategy to grow and protect your savings? Whatever your needs are, we are here to help.
Schedule your “FREE” portfolio review today.

Weekly Market Recap With Adam Taggart
Rally Fails
Last week, we discussed how the reflexive rally that started mid-May ran into resistance at the first levels from the recent low. To wit:
“While the market did clear the 20-dma, the “trapped longs” headed to the exits at the initial 38.2% Fibonacci retracement level from the March highs. That level was also where previous important support for the February and April lows got broken.”
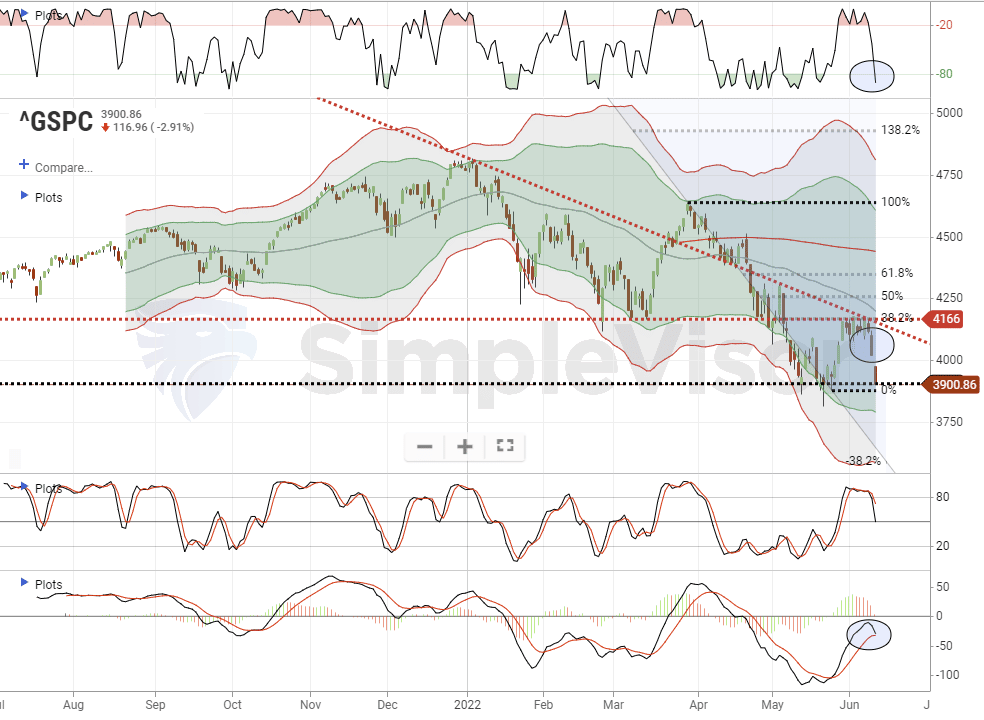
Unfortunately, the rally failed as recession risks from continued high inflation became evident.
We previously reviewed the market’s technical backdrop from a bullish and bearish perspective. While the short-term backdrop favored the bulls, the longer-term signals were bearish. Adding to the bearish backdrop is the tighter Fed policy and the reduction of market support as “quantitative tightening” begins.
Furthermore, the economic backdrop of high inflation and slowing economic growth certainly doesn’t give the bulls much to work with.
As shown above, our concern was that the longer the market remained in a tight trading range, the risk of a failed rally increased. While there was certainly room for the market to break to the upside, the multiple levels of resistance immediately overhead limited any advance. The failed rally now adds additional downward pressure on prices near term.
Therefore, from a risk management perspective, we continue to suggest using rallies to reduce exposure and raise cash. Given the failed rally, it is important the retest of the previous lows holds. A break of those lows will confirm the “bear market” is fully engaged.
Recession Risks Are Higher Than We Think
One of the issues that we think the market has yet to factor in completely is the risk of a recession. When it comes to the market, a recession substantially impacts earnings and profits.
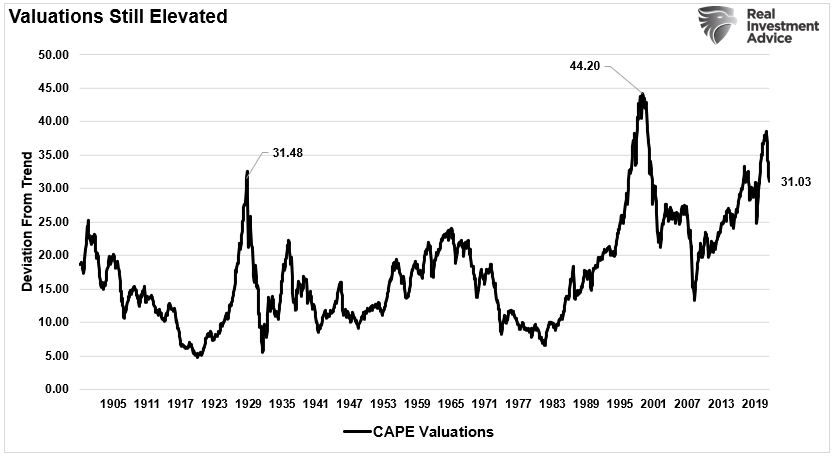
Since the beginning of the year, valuations have declined from their previous peak. However, such is due to both the price decline and the escalation in earnings estimates. Regardless, valuations are still expensive by many measures.
Despite the market decline, analysts remain very bullish about 2023 earnings. Furthermore, expectations for increasing profit margins are high. However, there is much risk to those forecasts.
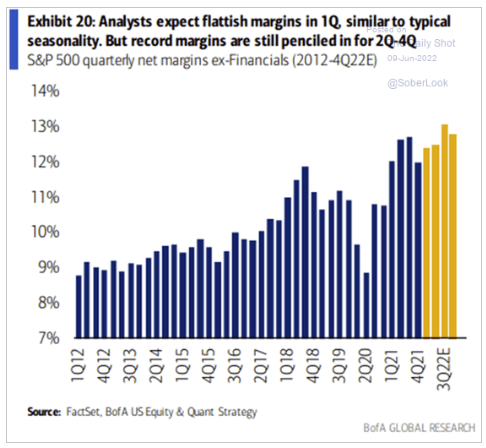
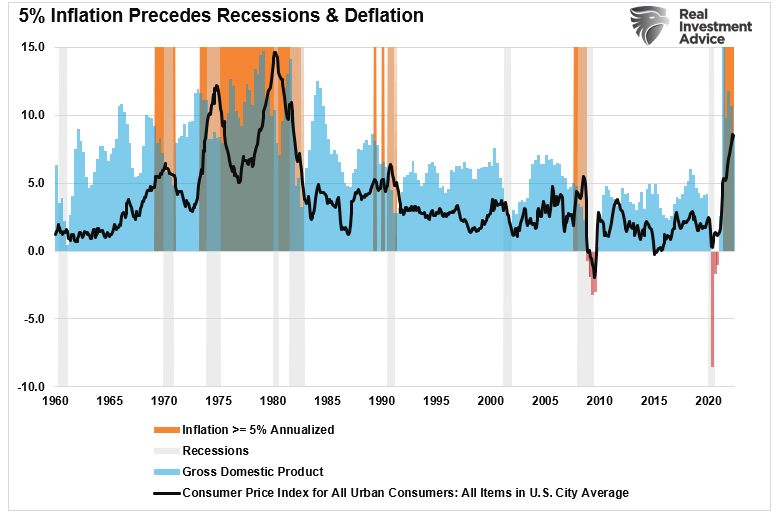
As inflationary pressures remain more persistent, economic growth will decline. As shown, each time inflation exceeds 5% annualized, a recession, and deflation, soon follow.
Since personal consumption drives earnings and profits, the risk of a profit margin reversion is elevated. As my colleague Albert Edwards noted, one warning sign is the explosion in personal credit.
“Revolving consumer credit is even growing at close to a record pace. Is this a sign of consumer health – or rather a consumer screaming out in end-of-cycle pain as their incomes are crushed by the cost of living crisis? For my recollection is that desperate consumers often turn to this expensive form of debt at the end of the economic cycle, just ahead of the recession.”

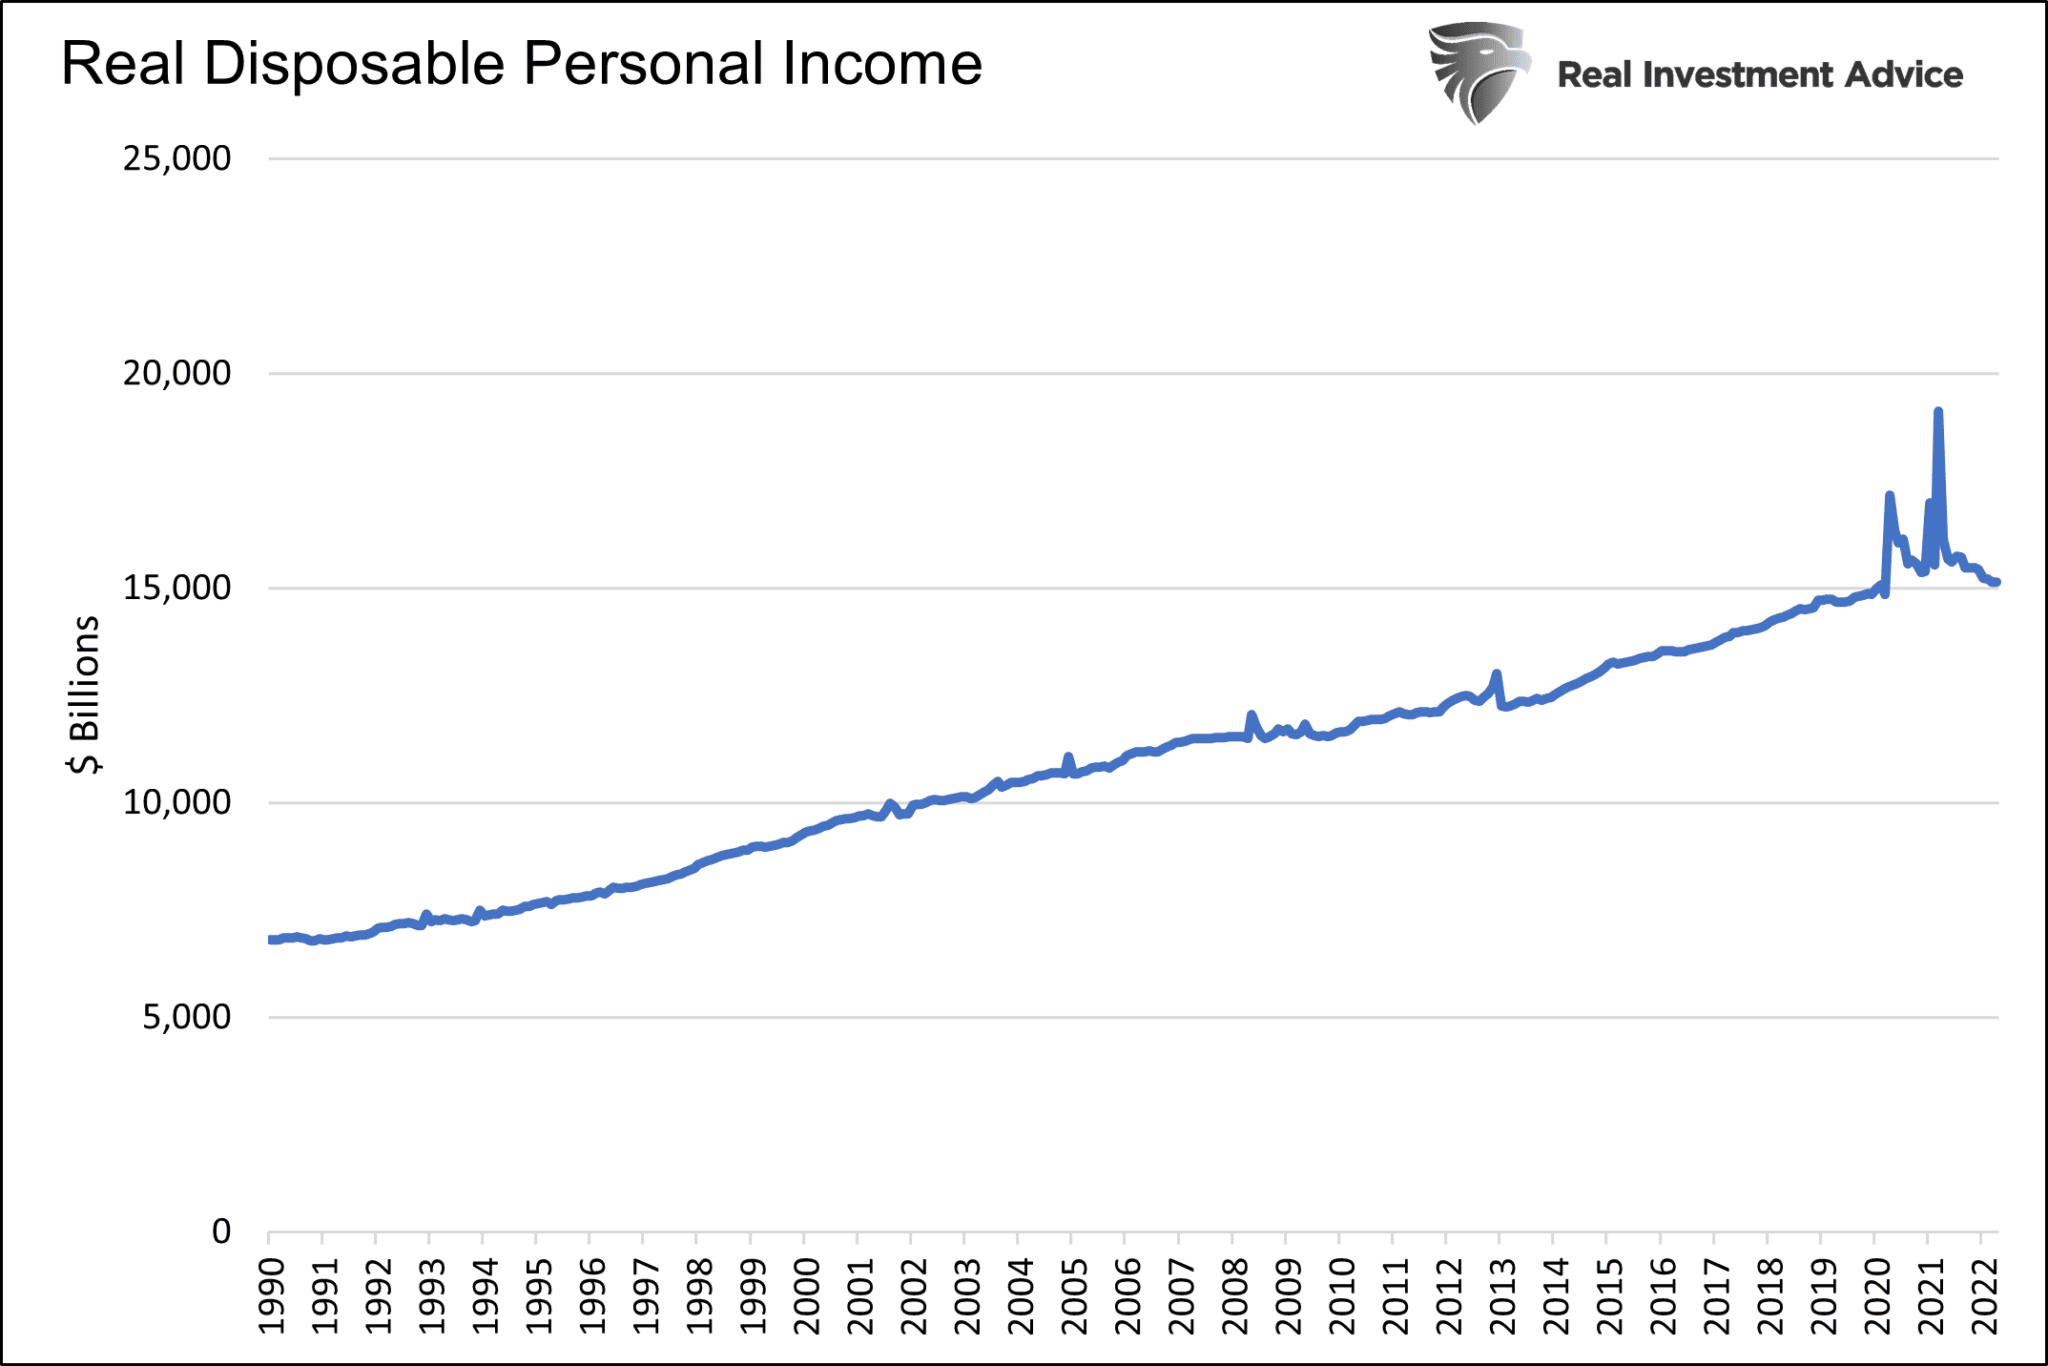
The surge in credit is not surprising with the recent personal income declines, as Michael Lebowitz noted this past week.
“The trend in real wages does not bode well for personal consumption. With inflation remaining in the 8% range and wages growing at about 5%, many consumers are losing.”
As he concludes:
“Such does not mean a recession is probable, but given the consumer’s predicament, we must assume it’s a distinct possibility.“

Macro Data Continues To Deteriorate
As macro risks continue to deteriorate, the downside risk to markets increases. The market is starting to recognize such with the sharp selloff. Notably, the Atlanta Fed’s GDPNow tracker fell to just 0.9% for the second quarter. That dismal growth rate is well below Wall Street consensus and follows the negative 1.4% growth in Q1.

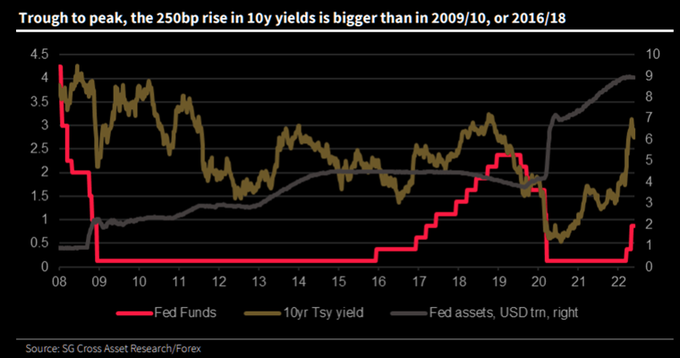
Furthermore, as noted above, the previous market tailwinds of Fed liquidity and zero interest rates are reversing, which will impair returns in the future.
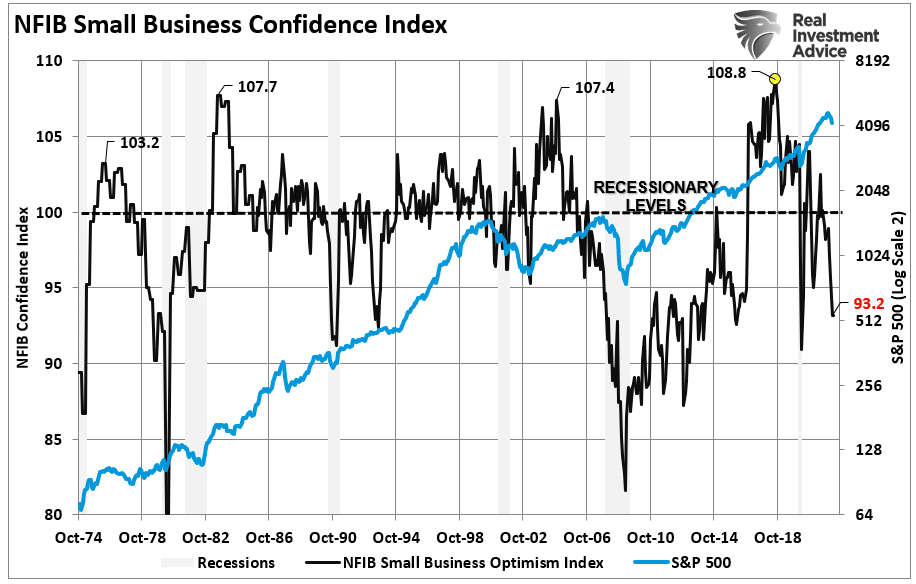
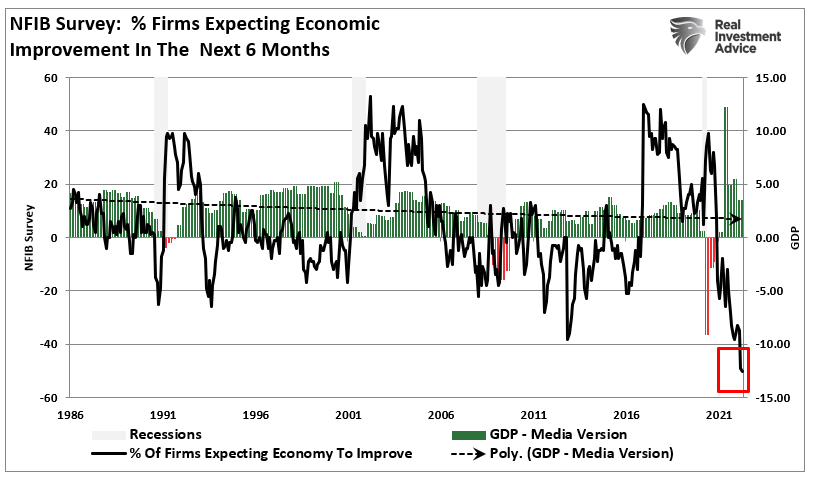
The National Federation of Small Business survey is an often overlooked but an important indicator. In April, the survey plunged to 93.2 from a pre-COVID high of 108.8. Historically, a reading below 100 is a recessionary warning.
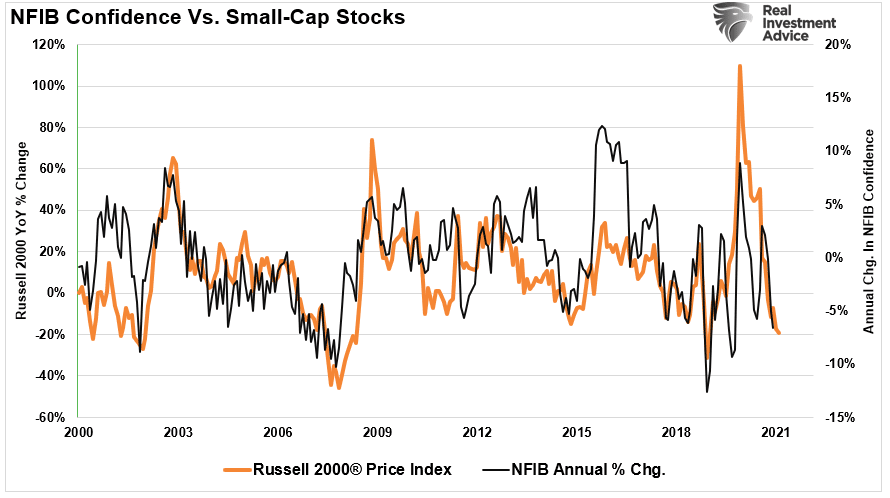
It is also important to note that small business confidence is highly correlated to changes in, not surprisingly, small-capitalization stocks.
The stock market and the NFIB signals risk are rising. As noted by the NFIB:
“Small business owners are struggling to deal with inflation pressures. The labor supply is not responding strongly to small businesses’ high wage offers and the impact of inflation has significantly disrupted business operations.” – NFIB Chief Economist Bill Dunkelberg.
Lastly, the NFIB’s economic optimism has plunged to the lowest levels on record.
Of course, the Federal Reserve remains NO help in instilling confidence in small business owners to deploy capital into the economy. As NFIB’s Chief Economist Bill Dunkleberg stated:
“The Fed announced a rate hike of half a point this month with more hikes to come in future meetings. Under Paul Volcker, the Fed’s rate hit 20 percent, a long way from where we are today. If, historically, the Fed’s rate needs to be above inflation to be effective, we have a long way to go and the Fed is way behind the curve.”
This Week’s MacroView

What I Do & Don’t Know
I don’t know if we are already in a recession or about to be in one. Unfortunately, no one will know until after the fact. However, the problem is waiting to take action until a recession gets announced. At that point, it will be far too late to matter.
Therefore, we must respond to market warnings and take action to prepare for a recession in advance. That said, the most important thing isn’t necessarily what steps to take but what behaviors to avoid. During market downturns, our emotional and behavioral biases tend to inflict the most damage to our financial outcomes.
“Loss aversion” is one of the leading factors influencing investment decisions, according to a recent survey from the CFA Institute.

“Loss aversion is a tendency in behavioral finance where investors are so fearful of losses that they focus on trying to avoid a loss more so than on making gains. The more one experiences losses, the more likely they are to become prone to loss aversion.” – Corporate Finance Institute
Therefore, to avoid losing money in a recession, you must:
- Avoid trying to time the exact bottom.
- Don’t try to “day trade” markets
- Reduce leverage and speculative bets
- Avoid selling quality companies just because they are down.
“A recession is a good time to avoid speculating, especially on stocks that have taken the worst beating. Weaker companies often go bankrupt during recessions, and while stocks that have fallen by 80%, 90%, or even more might seem like bargains, they are usually cheap for a reason. Just remember — a broken business at an excellent price is still a broken business.” – Motley Fool

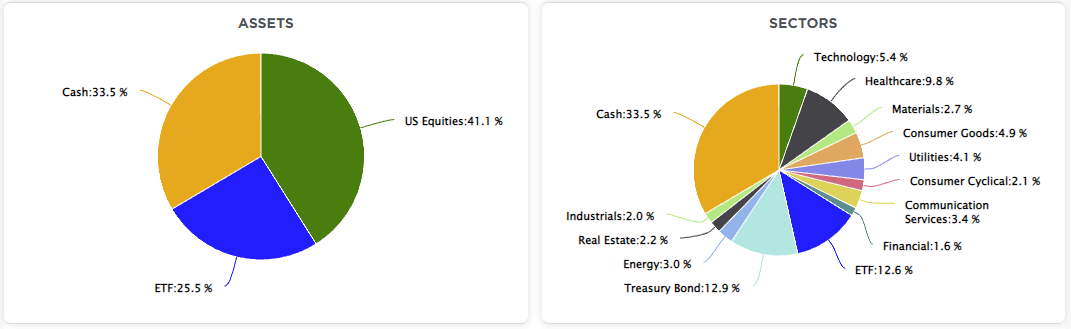
Portfolio Update
While the market remained stuck over the last couple of weeks, we worried the risk of a failed rally was increasing. Therefore, early last week, we made additional changes to our portfolio. We raised extra cash and added an S&P 500 Short ETF as a hedge to our portfolio.
We suggest using any rallies to reduce risk and increase cash levels further until the market provides better clarity. There will be plenty of time to determine if and when the current bearish cycle is over. We remain pretty confident we are not at that point just yet.
If you missed last week’s message, let me repeat the guidelines to take now.
- Tighten up stop-loss levels to current support levels for each position. (Provides identifiable exit points when the market reverses.)
- Hedge portfolios against significant market declines. (Non-correlated assets, short-market positions, index put options, bonds.)
- Take profits in positions that have been big winners (Rebalancing overbought or extended positions to capture gains but continue participating in the advance. Think “energy” stocks.)
- Sell laggards and losers. (If something isn’t working in a market rally, it most likely won’t work during a broad decline. Better to eliminate the risk early.)
- Raise cash and rebalance portfolios to target weightings. (Rebalancing risk regularly keeps hidden risks somewhat mitigated.)
While we are reducing capital risk opportunistically, we are very aware we could give up performance in the short term if the market rallies. For us, that is a choice we can live with if we potentially bypass the risk of a more significant correction.
In our view, we have a choice to either manage risk or ignore it.
The only problem with “ignoring risk” is that such has a long history of not working well.
Have a great week.
Market & Sector Analysis
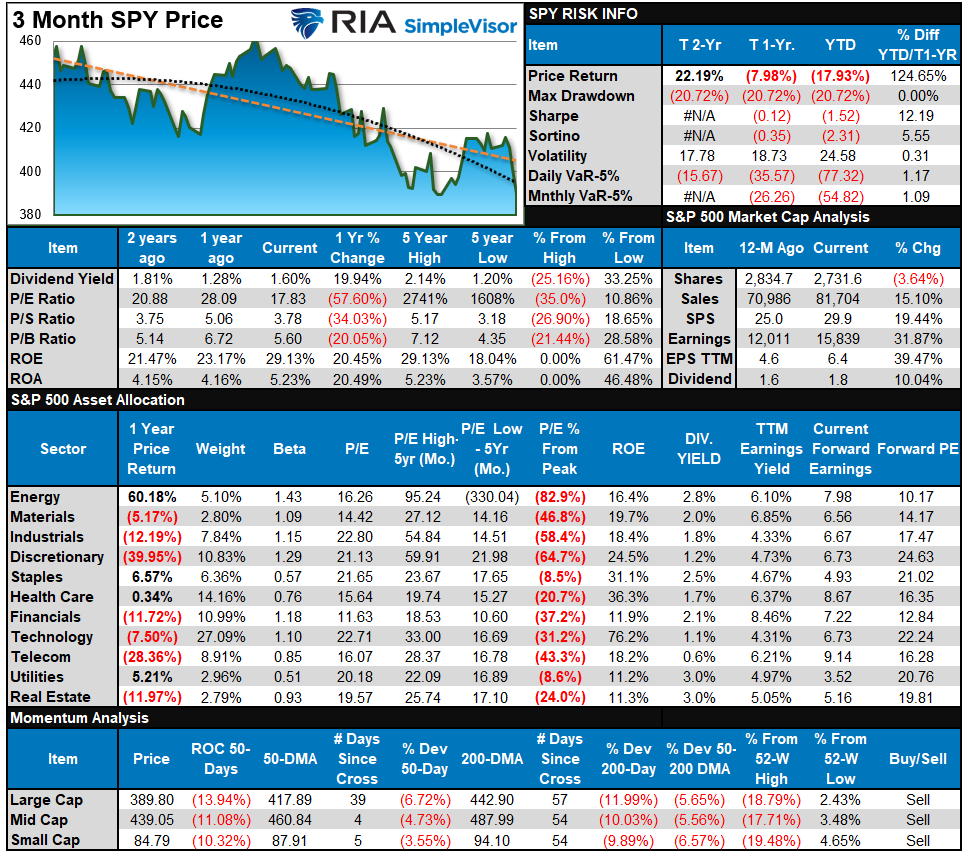
S&P 500 Tear Sheet
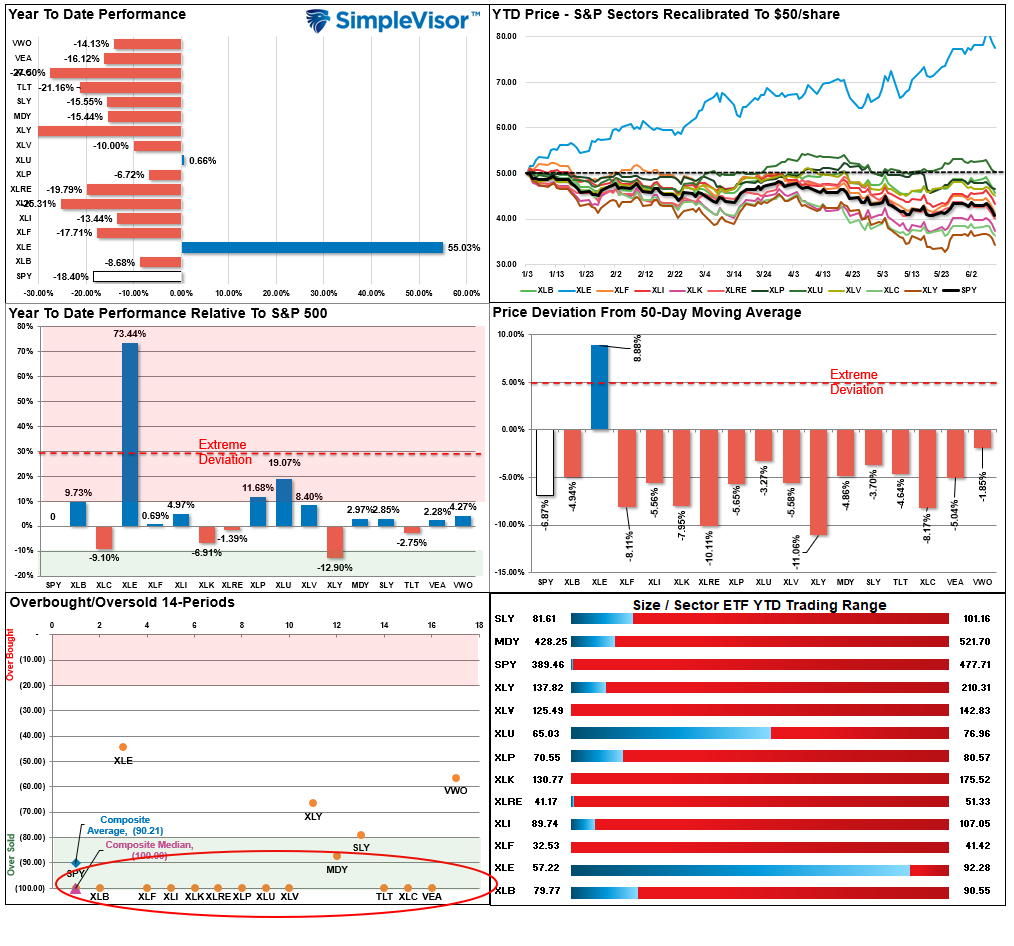
Relative Performance Analysis
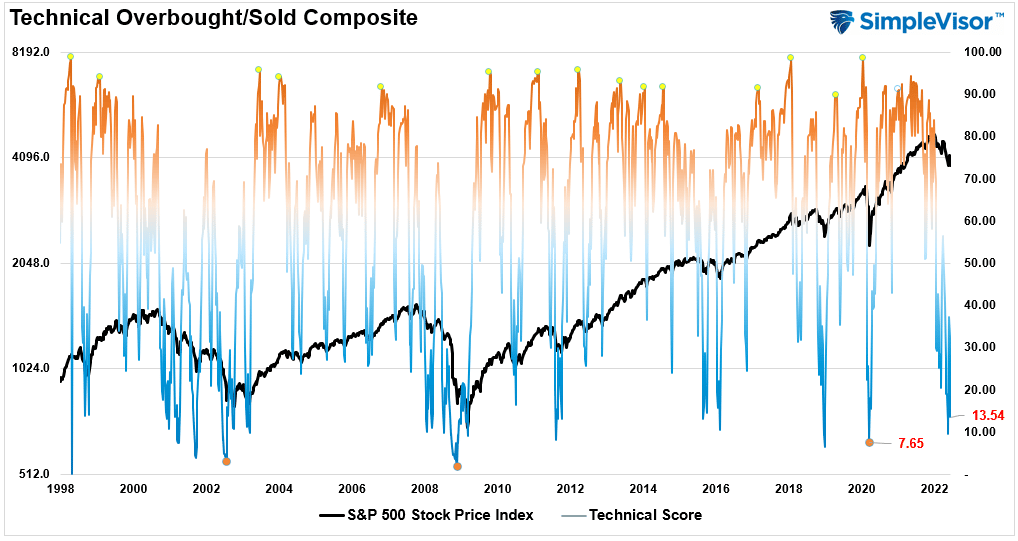
Technical Composite
The technical overbought/sold gauge comprises several price indicators (RSI, Williams %R, etc.), measured using “weekly” closing price data. Readings above “80” are considered overbought, and below “20” are oversold. The current reading is 13.54 out of a possible 100.
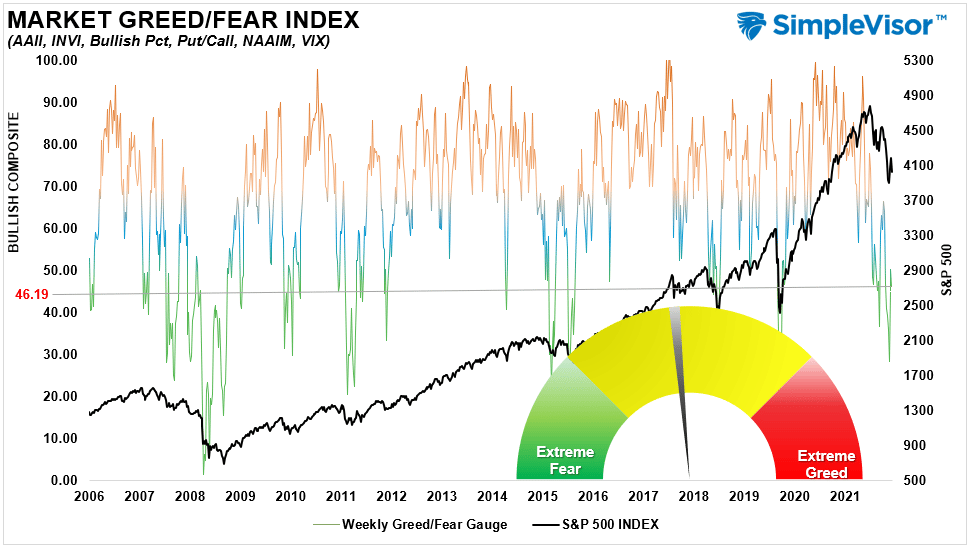
Portfolio Positioning “Fear / Greed” Gauge
The “Fear/Greed” gauge is how individual and professional investors are “positioning” themselves in the market based on their equity exposure. From a contrarian position, the higher the allocation to equities, to more likely the market is closer to a correction than not. The gauge uses weekly closing data.
NOTE: The Fear/Greed Index measures risk from 0 to 100. It is a rarity that it reaches levels above 90. The current reading is 46.19 out of a possible 100.
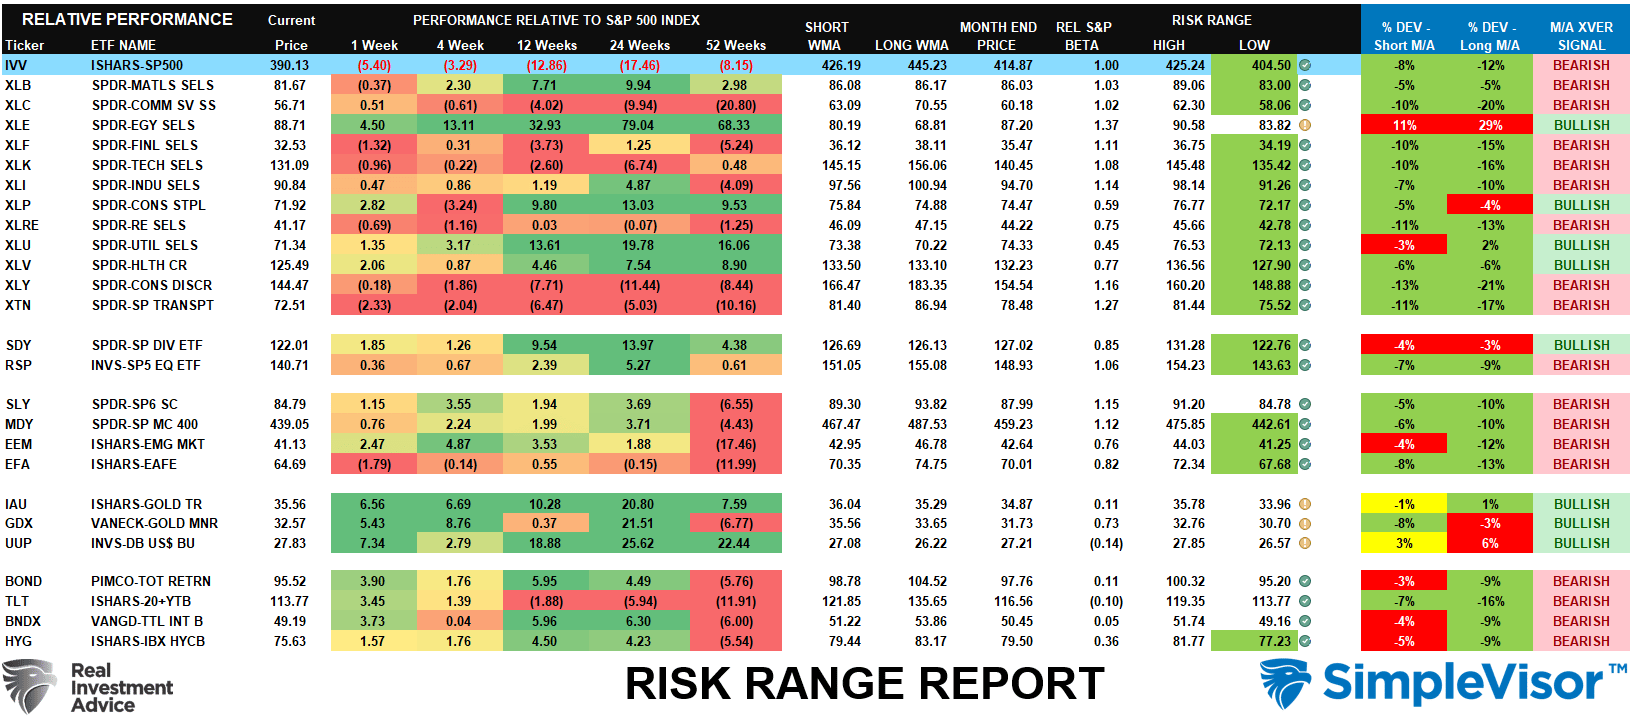
Sector Model Analysis & Risk Ranges
How To Read This Table
- The table compares the relative performance of each sector and market to the S&P 500 index.
- “M/A XVER” is determined by whether the short-term weekly moving average crosses positively or negatively with the long-term weekly moving average.
- The risk range is a function of the month-end closing price and the “beta” of the sector or market. (Ranges reset on the 1st of each month)
- The table shows the price deviation above and below the weekly moving averages.
- The complete history of all sentiment indicators is under the Dashboard/Sentiment tab at SimpleVisor.
Weekly Stock Screens
Each week we will provide three different stock screens generated from SimpleVisor: (RIAPro.net subscribers use your current credentials to log in.)
This week we are scanning for the Top 20:
- Relative Strength Stocks
- Momentum Stocks
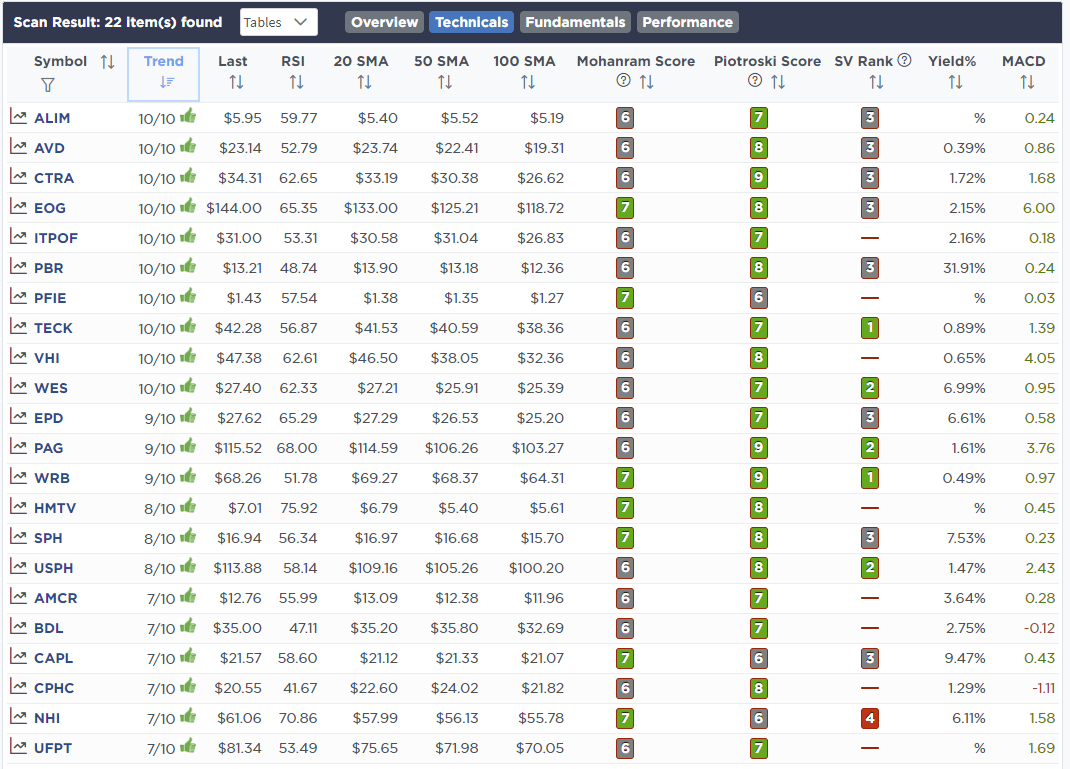
- Technically Strong With Strong Fundamentals
These screens generate portfolio ideas and serve as the starting point for further research.
(Click Images To Enlarge)
RSI Screen

Momentum Screen
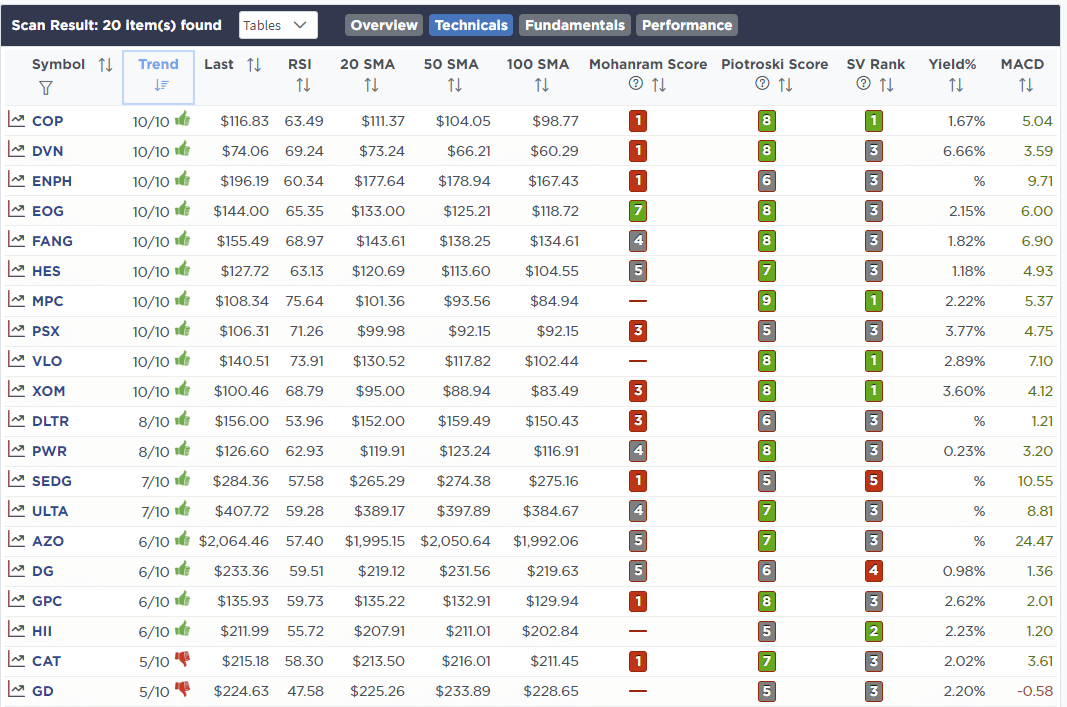
Technical & Fundamental Strength Screen
SimpleVisor Portfolio Changes
We post all of our portfolio changes as they occur at SimpleVisor:
June 7th
“As we have noted in recent commentaries, we are using rallies to reduce risk in portfolios until the market provides a clear signal that the “bearish” backdrop is over. This morning we further rebalanced and reduced exposure by selling equity positions and raising cash. We are also starting to build a hedge in the portfolio by adding 2.5% of the S&P 500 Short ETF (SH) to both models.
We are concerned the recent bounce is getting long in the tooth and may reverse quickly. Any catalyst for a sustained rally, such as easing Fed rhetoric, lower inflation, and financial instability, is not likely to materialize in the coming weeks which puts markets at risk. Furthermore, as noted by Target (TGT) this morning, consumer concerns and recessionary risks are rising.”
Equity Model
- Rebalanced MRO to the model weight of 1.5% of the portfolio
- Took profits in XOM, reducing weight to 1.5% of the portfolio
- Reducing CVS to 2.5% of the portfolio.
- Took profits in COST trade, reducing weight to 3% of the portfolio
- Reduced PG to 2% of the portfolio.
- Added 2.5% of S&P 500 Short ETF (SH) to start building a hedge in portfolios
ETF Model
- Added 2.5% of S&P 500 Short ETF (SH) to start building a hedge in portfolios
- Reduced XLE to 2.5% of the portfolio to take profits.
- Reduced XLK to 8% of the portfolio to lower beta risk and raise cash.

Lance Roberts, CIO
Have a great week!


