Reported Earnings Has Wall Street Hoping The Bottom Is In


Inside This Week’s Bull Bear Report
- Market Breaks Out
- Earnings Hopium
- How We Are Trading It
- Research Report – Monetary Support Suggests Bear Market Is Over
- Youtube – Before The Bell
- Stock Of The Week
- Daily Commentary Bits
- Market Statistics
- Stock Screens
- Portfolio Trades This Week
Market Breaks Out
With earnings season mostly behind us, reported earnings came in “better than expected.” This has put Wall Street analysts in an optimistic mood hoping the worst is behind us. However, before we dig into the data, let’s review the market action this past week.
We noted last week that:
“Such was the case as the market again struggled within a relatively tight trading range. Despite many bearish headlines, from more potential bank failures to weaker economic data, the market continues to trade bullishly. With moving averages sloping higher and downtrend support levels holding, we continue to grind away our current sell signal. It is important to remember that a market can correct excesses in two ways. The first is by declining in price. The second is by consolidating sideways.”
That consolidation was resolved this past week. After 45 days of sideways action, the market broke decisively higher this week. While narrow in scope, that breakout allows the market to move higher. As I noted in Friday morning’s Daily Market Commentary:
“Following more good news from retailers, which further confirmed no imminent recession, stocks broke above the trading range that has contained markets since February. That breakout sparked massive short covering and a rush to buy into the technology sector index, with the mega-caps again leading the way, as we discussed in yesterday’s morning note.“
On Friday, the market pulled back and held the breakout level with the first test of the previous resistance. If that level holds next week, the market will have a new support level to build off of.
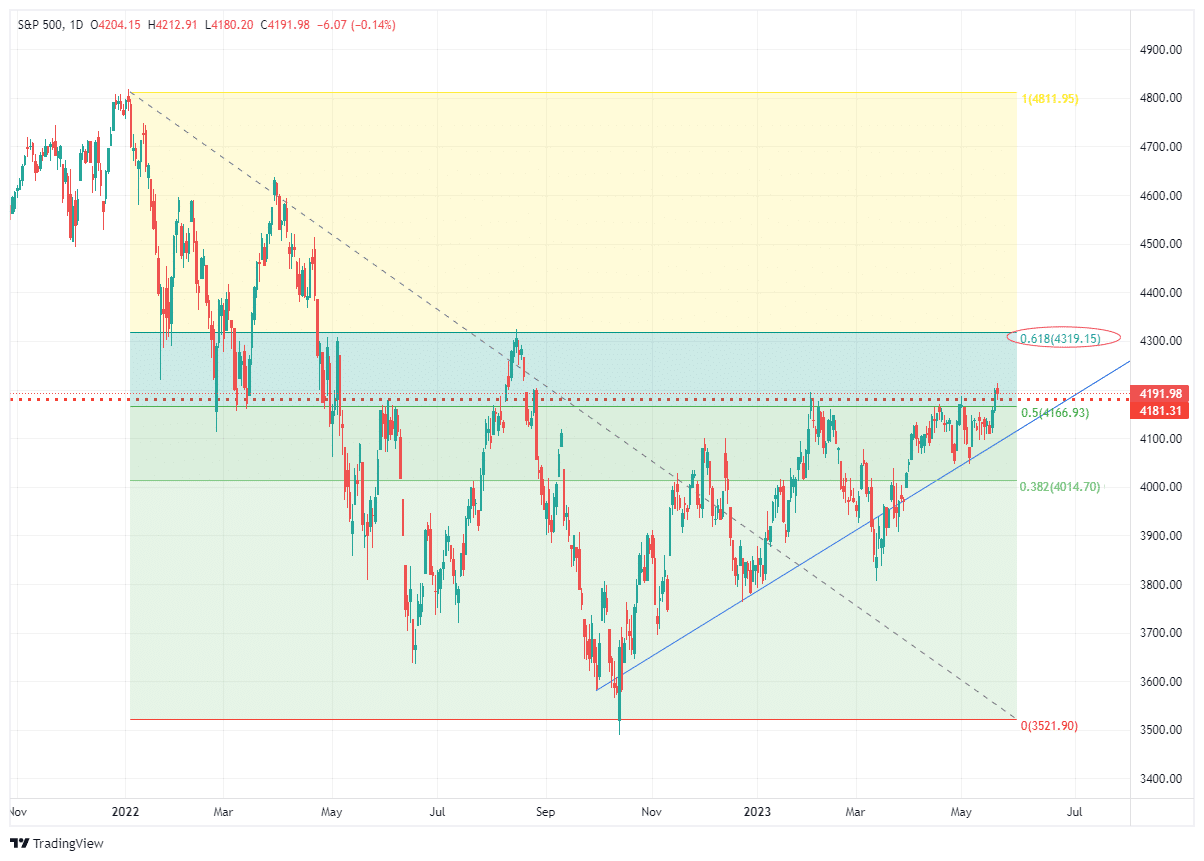
More importantly, as shown below, the MACD and the MoneyFlow “buy signals” confirmed that breakout. Such suggests that the most likely move for the market is higher for now.
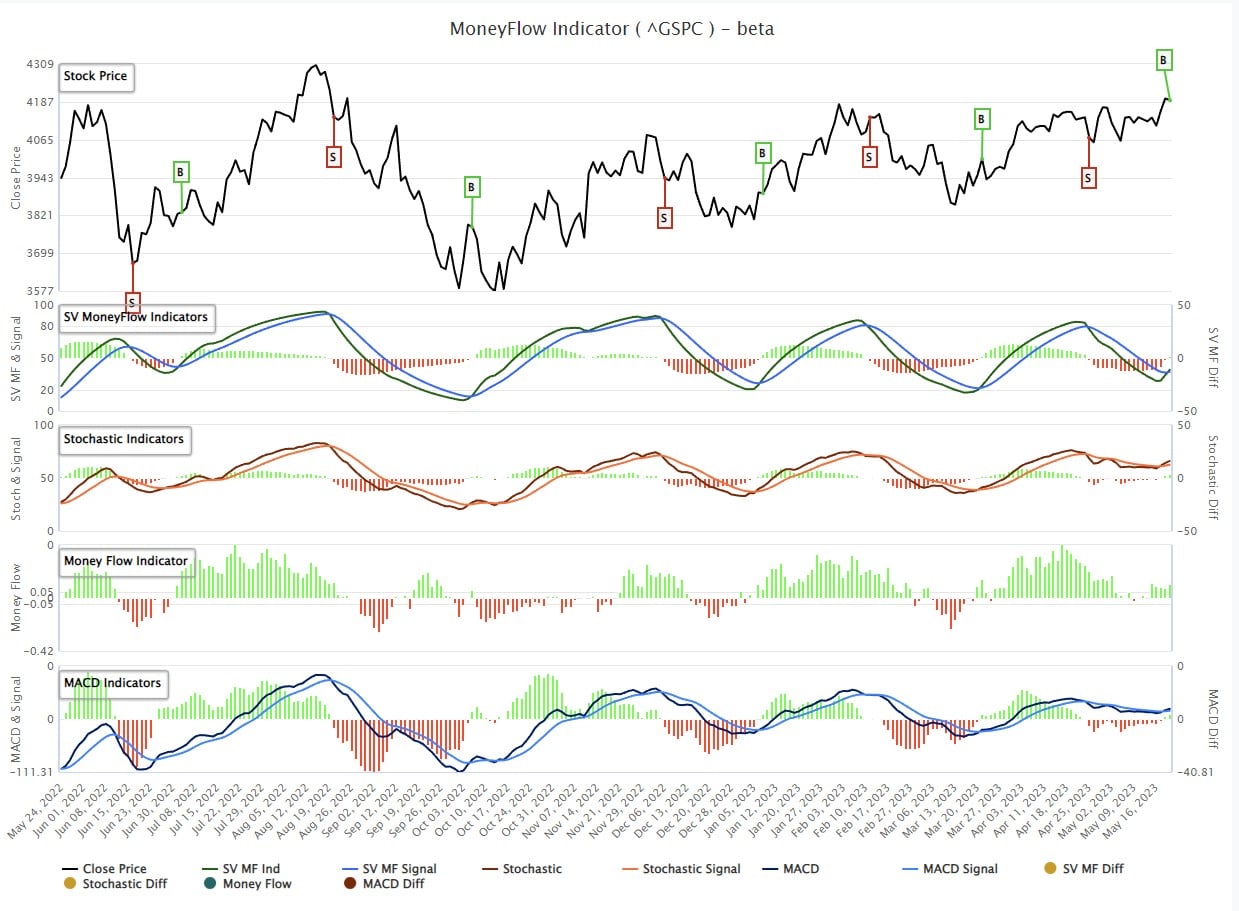
The only “negative” to the market action is that the buy signals are triggering at pretty high levels from a historical basis, which will likely contain the upside of whatever rally the market provides. As noted in the chart above, the next target for the market near term is 4300. Any dips between the current market level and the rising trend line from the October lows, or the 50-DMA, should be used to increase equity exposure accordingly.
For now, there is no reason to be negative on the market as the bulls are clearly in control.
However, over the intermediate term, some risks must be considered. While earnings season was much stronger than expected, expectations have once again gotten well ahead of potential reality. This week, we will review the earnings data from the first quarter.
Need Help With Your Investing Strategy?
Are you looking for complete financial, insurance, and estate planning? Need a risk-managed portfolio management strategy to grow and protect your savings? Whatever your needs are, we are here to help.

Reported Earnings “Better Than Expected”
With the bulk of the S&P 500 companies having reported earnings, we can understand how the economy is performing and how companies have adapted to a high inflation, high-interest rate environment. At first glance, the data is relatively optimistic, with many companies beating estimates. To wit:
“To date, 92% of the companies in the S&P 500 have reported earnings for the first quarter. Of these companies, 78% have reported actual EPS above the mean EPS estimate, which is above the 10-year average of 73%. It is also the highest percentage of S&P 500 companies reporting a positive EPS surprise since Q3 2021 (82%). In aggregate, earnings have exceeded estimates by 6.5%, which is above the 10-year average of 6.4%. It is also the highest surprise percentage reported by S&P 500 companies since Q4 2021 (8.1%).“ – FactSet
That sounds highly optimistic until you remember companies beating drastically lowered estimates. Such was a point we discussed when evaluating Q4 results in “Forward Earnings Remain At Risk:”
That “beat rate” was primarily a function of the rapid cuts to estimates since June of last year. If analysts were held to their original estimates, roughly 100% of companies would have disappointed expectations.
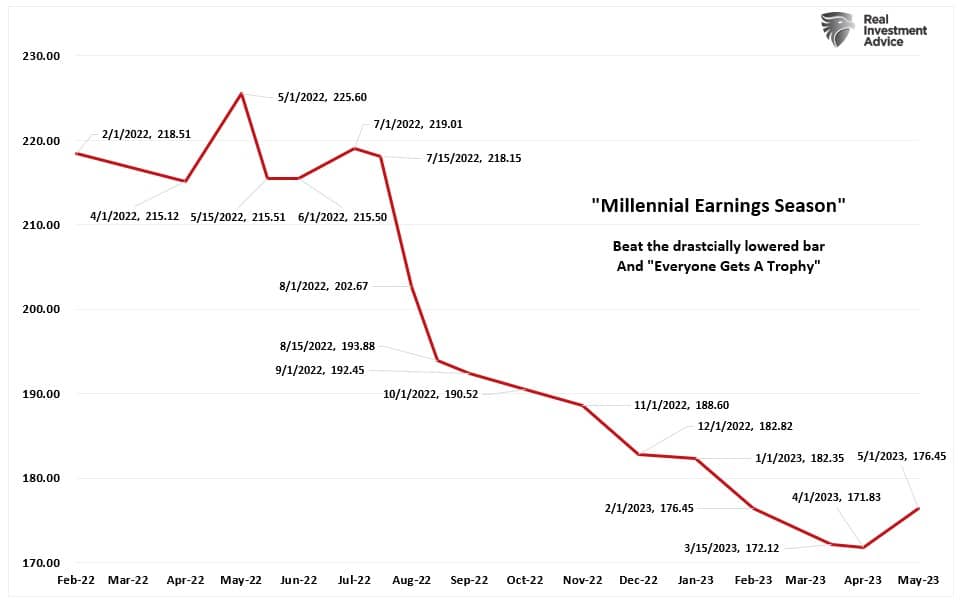
This is why we call it “Millennial Earnings Season.” Wall Street continuously lowers estimates as the reporting period approaches so “everyone gets a trophy.” An easy way to see this is the number of companies beating estimates each quarter, regardless of economic and financial conditions.
The chart below shows the evaluation of Q1 reported earnings expectations from June 2022.
Nonetheless, the earnings results, and more importantly, the overall forecasts, were indeed more optimistic than Wall Street expected. Such has led to more optimism about the rest of the year as analysts are now ratcheting up expectations into the end of 2024. Goldman Sachs is suggesting the worst is now behind us. To wit:
“The earnings backdrop is showing green shoots of improvement. Excluding Energy, S&P 500 year/year EPS growth improved sequentially from -6% in 4Q 2022 to -5% in 1Q 2023.”
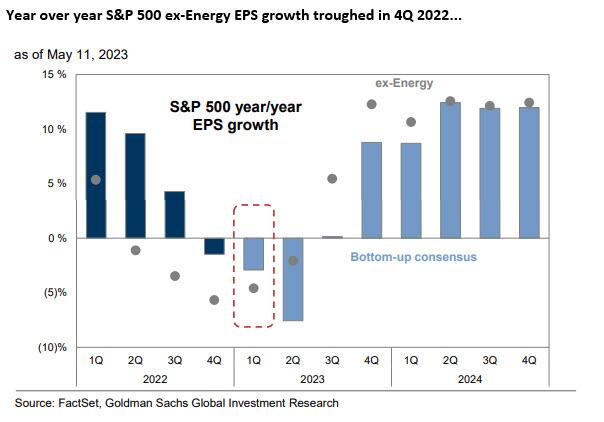
Goldman’s optimism is not unique, as Factset confirmed, stating that analysts expect earnings to grow sequentially through the end of 2023. That outlook was also shared by rather sharp increases in earnings expectations through 2024 from S&P Global.
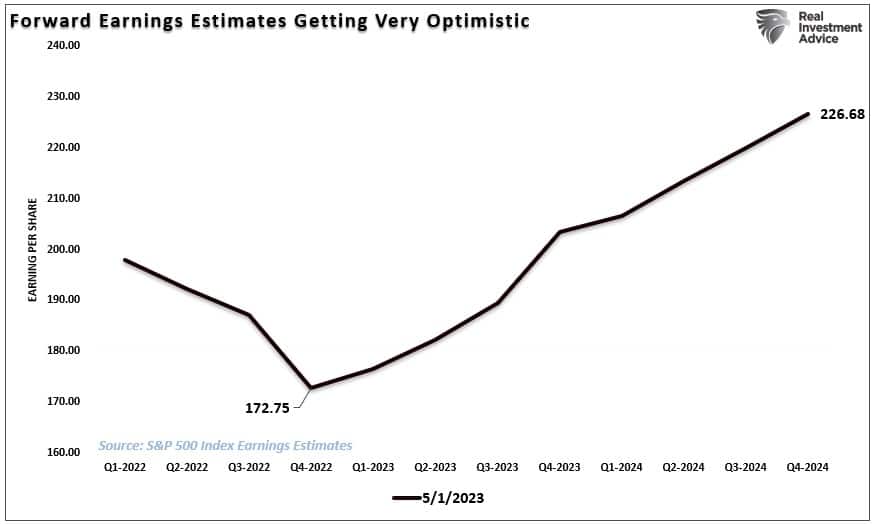
These expectations of re-accelerating reported earnings are certainly optimistic, but those outcomes heavily depend on a resurgence of economic growth.
Economic Growth Expectations
Much will depend on economic growth for reported earnings to grow as anticipated. The reason is apparent, given that 70% of economic growth comes from personal consumption, which provides corporate revenue. Currently, the most important sets of economic data still suggest slower economic growth ahead as the lag effect of higher interest rates collides with consumers. Two of the most critical indicators of recessions certainly don’t support current assumptions. The 6-month rate of change of the Leading Economic Index (LEI) and the Economic Composite Index continue to suggest further economic weakness in the near term.
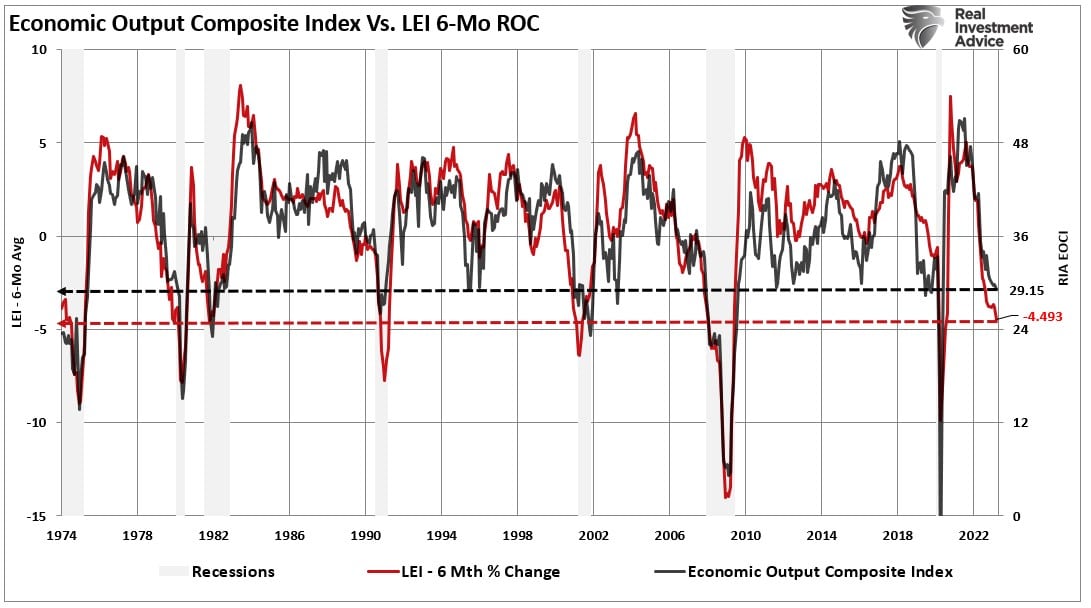
Both of those measures, not to mention yield curve inversions and a host of other indicators, suggest a recession is more likely than not. However, even if we don’t have a recession but only a slower economic growth rate, those reported earnings estimates remain optimistic. As shown below, there is a very high correlation between the Leading Economic Index and the reported earnings growth rates.
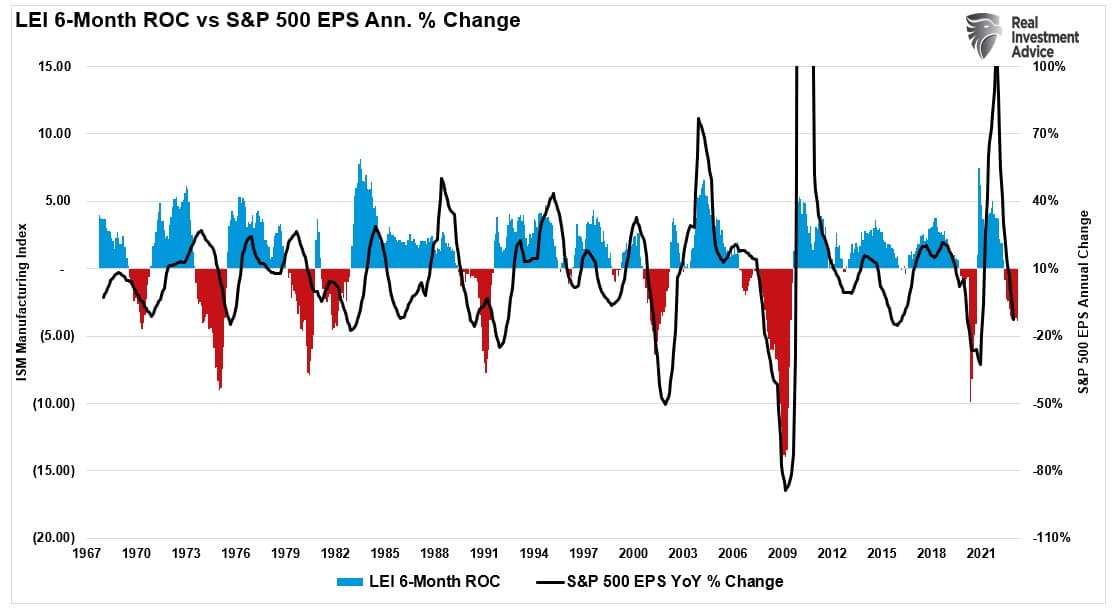
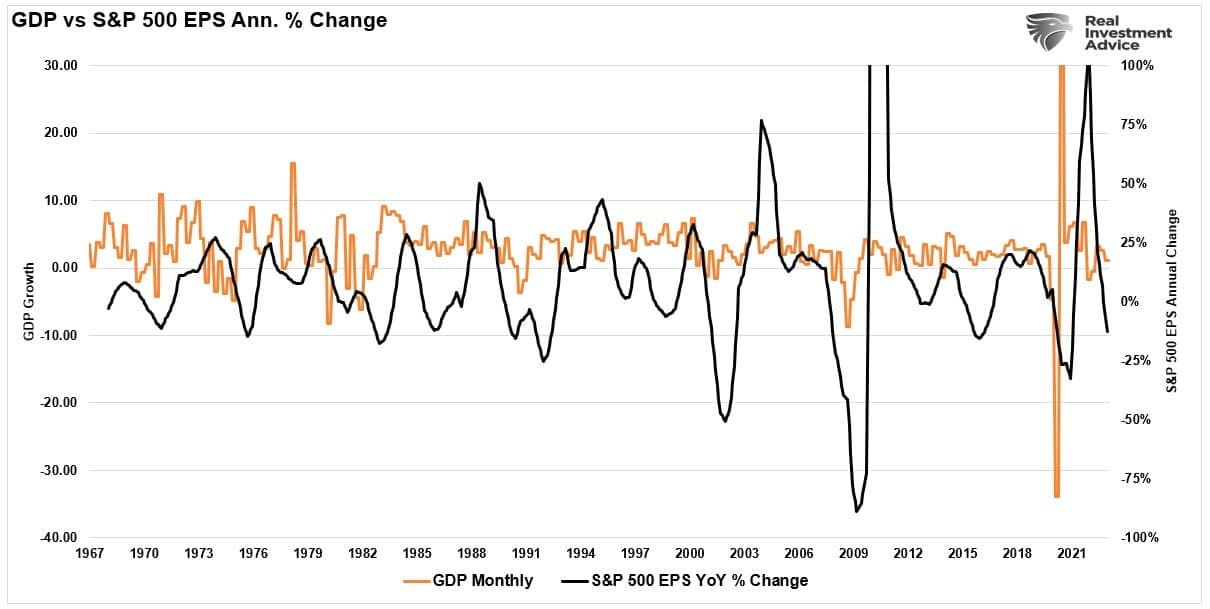
Again, unsurprisingly, if the economy is slowing down, then it is unlikely that earnings will begin to accelerate, given the long-term correlation between the economy and earnings.
Lastly, as the economy slows, then inflation will decline. Such will further pressure corporate reported earnings as the profit margins get reduced. A big boon to corporate profitability following the economic shutdown was the surge in spending caused by stimulus payments against a backdrop of restricted supply. Such allowed for an explosion in profit margins and a boost to reported earnings. Inflation is now reversing, providing another headwind to Wall Street expectations.

A Reversion To The Mean
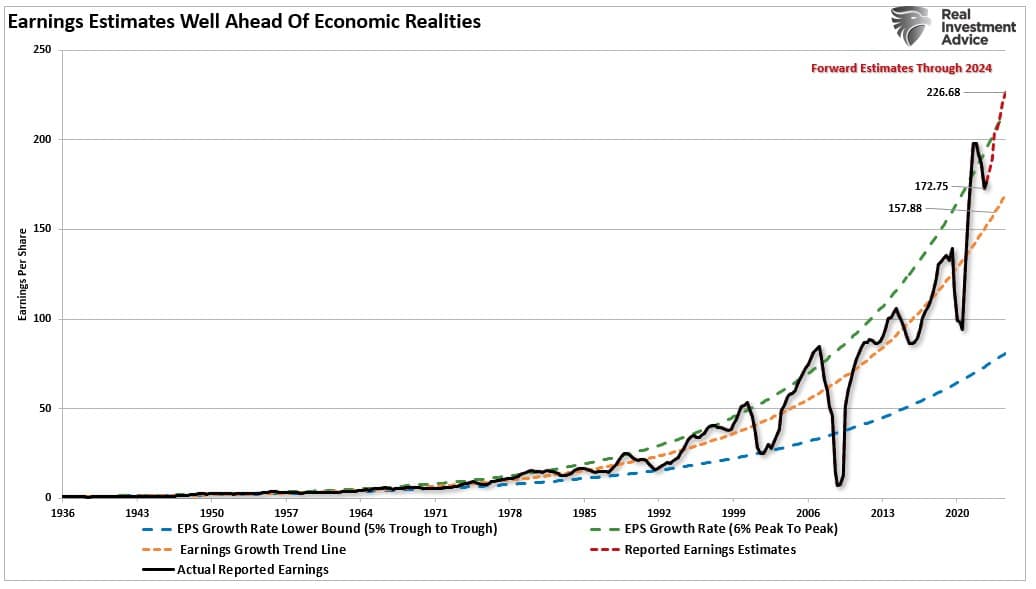
One of the most significant current concerns is that despite the decline in reported earnings over the last year, the deviation from the long-term growth trends remains exceptionally elevated.
Analysts remain optimistic about earnings even with economic growth weakening as inflation increases, reduced liquidity, and declining profit margins. As shown above, analysts expect the first quarter of 2023 will mark the bottom for the earnings decline, and growth will accelerate into year-end. Again, this is despite the Fed continuing to hike interest rates specifically to slow economic growth.
The problem with these expectations is the detachment of earnings estimates above the long-term growth trend.
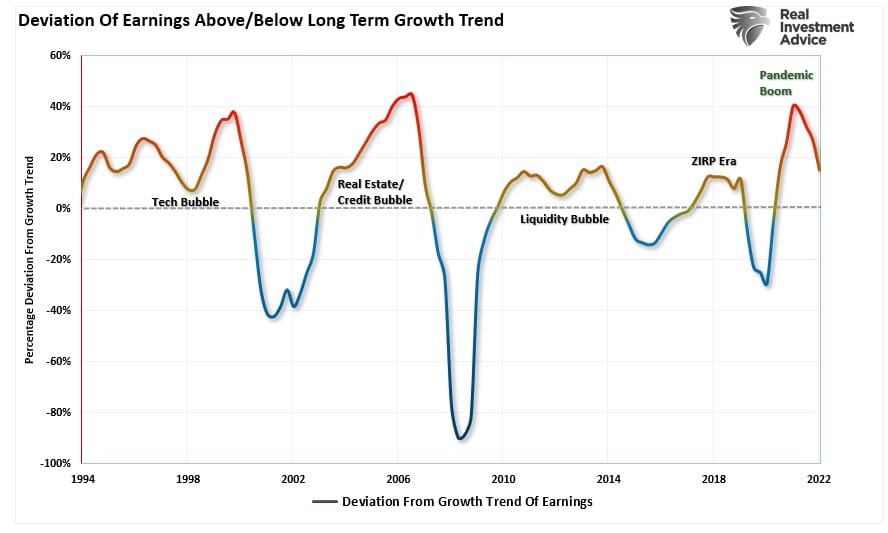
That deviation from the long-term growth trend is shown more clearly in the following chart. The only two previous periods with similar deviations are the “Financial Crisis” and the “Dot.com” bubble.
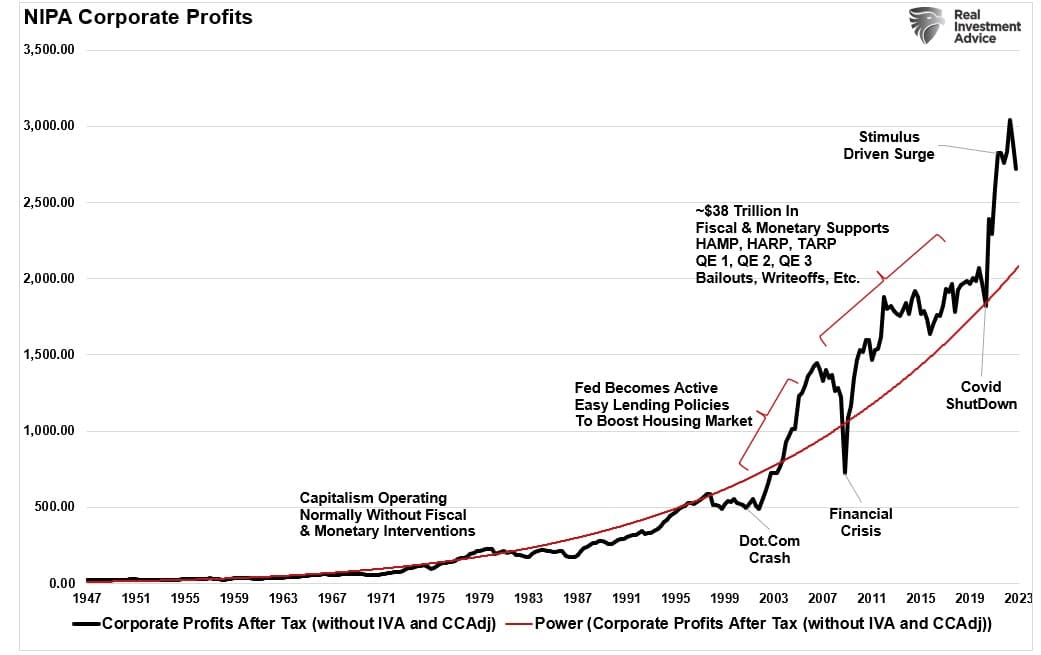
Given that earnings are the byproduct of economic growth, the sustainability of record-high earnings and corporate profit margins is problematic. As we discussed in “Capitalism Is Broken:”
“With the economy shut down and an inorganic surge in demand due to “free money,” the selling prices of a restricted supply of goods rose. The basic economic function of supply and demand proves capitalism is functioning properly. Furthermore, as shown, corporate profits surged with labor costs greatly reduced due to the shutdown and higher prices due to artificially stimulated demand.”
So, what happens next, assuming the combination of a shuttered economy, no supply, and massive rounds of fiscal stimulus fostered the surge in corporate earnings and profits?
Over the next few years, the environment will look different than in the past.
- The economy is returning to a slow growth environment with a risk of recession.
- Inflation is falling, meaning less pricing power for corporations.
- No artificial stimulus to support demand.
- Over the last two years, the pull forward of consumption will now drag on future demand.
- Interest rates are substantially higher, impacting consumption.
- Consumers have sharply reduced savings and higher debt.
- Previous inventory droughts are now surpluses.
Forward Earnings Remain At Risk
Notably, this reversion of activity will become exacerbated by the “void” created by pulling forward consumption from future years.
“We have previously noted an inherent problem with ongoing monetary interventions. Notably, the fiscal policies implemented post the pandemic-driven economic shutdown created a surge in demand and unprecedented corporate earnings.”
As shown below, the surge in the M2 money supply is now over. Without further stimulus, earnings will revert to economically sustainable levels.

While the media often states that “stocks are not the economy,” economic activity creates corporate revenues and earnings. As such, stocks can not grow faster than the economy over long periods.
The problem with forward earnings should be obvious. Given that forward earnings estimates are almost always wrong, such means that investors overpay for investments. As should be obvious, overpaying for an investment today leads to lower future returns.
The hope, as always, is that earnings will rise to justify the market’s overvaluation. However, when earnings are rising, so are the markets.
Analysts have a long and sordid history of being overly bullish on expectations of growth which fall well short. Such is particularly the case today. Much of the economic and earnings growth was not organic. Instead, it was from the flood of stimulus into the economy, which is now evaporating.
Overpaying for assets has never worked out well for investors.
With the Federal Reserve intent on slowing economic growth to quell inflation, it is only logical earnings will decline. Prices must accommodate lower earnings by reducing current valuation multiples if such is the case.
How We Are Trading It
With the fears of a debt ceiling default fading quickly, the market has started to trade more bullishly. We further increased our equity exposure to areas of the market that are currently out of favor, which we think will benefit from a rotational shift in the market.
These continue to be tiny moves to align the risk profile of portfolios to the market. Given the confirming buy signals from our indicators, we will add exposure opportunistically. The improvement in the overall price action confirms that downside risk is somewhat limited in the current environment.
To repeat from last week.
“The bullish technicals but bearish fundamentals continue to make this a challenging market. As such, we continue to make small movements while erring to the side of caution. That careful positioning is penalizing our performance so far this year. While we are not enthused about that, we will accept near-term underperformance to hedge against a more significant downturn later. Reallocating cash and fixed-income holdings into equity risk is always easy when needed. Trying to recoup more severe losses is a far more challenging prospect. “
While we want to make money for our clients, we don’t want to overly expose portfolios to the risk of loss to chase performance. Such actions have a long history of poor outcomes.
There will be a time to be fully allocated to equity markets. While we may be getting close to that point, there are many logical reasons to remain cautious until we know with certainty.
Have a great week.
Research Report

Subscribe To “Before The Bell” For Daily Trading Updates (Formerly 3-Minutes)
We have set up a separate channel JUST for our short daily market updates. Please subscribe to THIS CHANNEL to receive daily notifications before the market opens.
Click Here And Then Click The SUBSCRIBE Button
Subscribe To Our Youtube Channel To Get Notified Of All Our Videos
Stock Of The Week In Review
Burgeoning Buyback Potential – Part 2
Last week’s Five for Friday highlighted large-cap energy companies with “a high potential for returning capital to investors through share buybacks.” Since many governments are incentivizing renewable energy sources and penalizing carbon-based energies, traditional carbon-based energy companies may likely divert profits from exploration toward shareholders.
This week we take the analysis another step. We seek energy companies with excess cash and trading at cheap valuations. With the possibility of a recession looming, companies with a margin of cushion, i.e., low valuations, should hold up better than stocks with high valuations. The selected companies may elect to buy back stock or increase dividends to support their stocks in a weaker market.
Here is a link to the full SimpleVisor Article For Step-By-Step Screening Instructions.
Login to Simplevisor.com to read the full 5-For-Friday report.
Daily Commentary Tidbits
Saudi Says Phooey To De-Dollarization
We led a recent article about de-dollarization with the following quote: “For those losing sleep that the Chinese yuan, bitcoin, or some other currency will commandeer the dollar’s throne as the world’s reserve currency, sleep tight. That day is not coming anytime soon.” Saudi Arabia reminds us why we believe that the much-heralded death of the dollar is not coming soon. Saudi Arabia just issued $6 billion of U.S. dollar-denominated bonds. That follows approximately $10 billion of dollar issuance earlier this year.
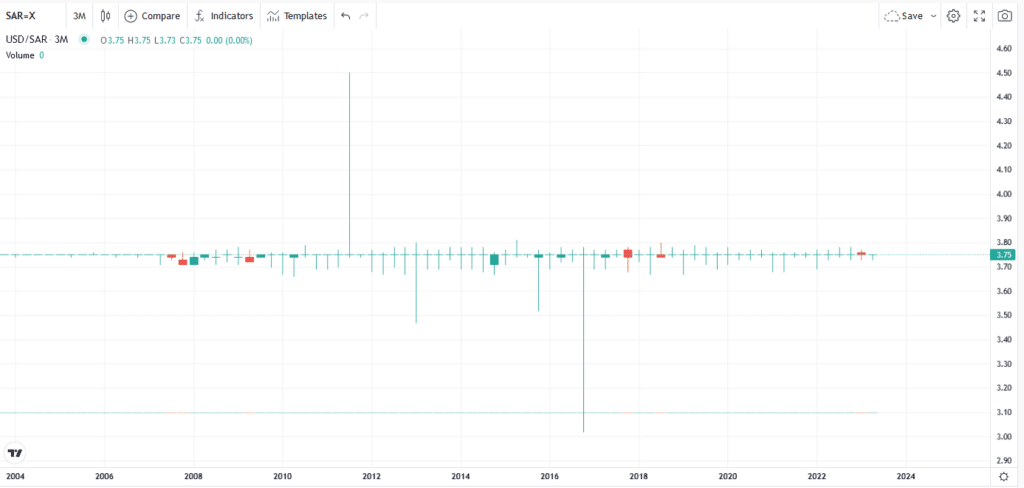
Saudi Arabia has been vocal about replacing the dollar as the world’s reserve currency. Yet their demand and use of dollars, as witnessed by the recent dollar debt issuance, say they want or need dollars. Further enlightening, Saudi Arabia pegs their currency to the dollar and has for over 70 years. The graph below shows the flat exchange rate between the Saudi Riyal and the U.S. dollar over the last 20 years. For a country that seems intent on getting rid of dollars, they are as attached to dollars as any country. Even more interesting, Saudi Arabia has the one export almost every country needs, oil. Of all countries, Saudi Arabia has the most leverage in dictating trade terms away from the dollar. Why are they talking loudly about de-dollarization but further tieing themselves to the dollar’s value? Simply, there is no viable large-scale alternative.
Actions speak louder than words!
(Subscribe To The Daily Market Commentary For A FREE Pre-Market Email)
Bull Bear Report Market Statistics & Screens

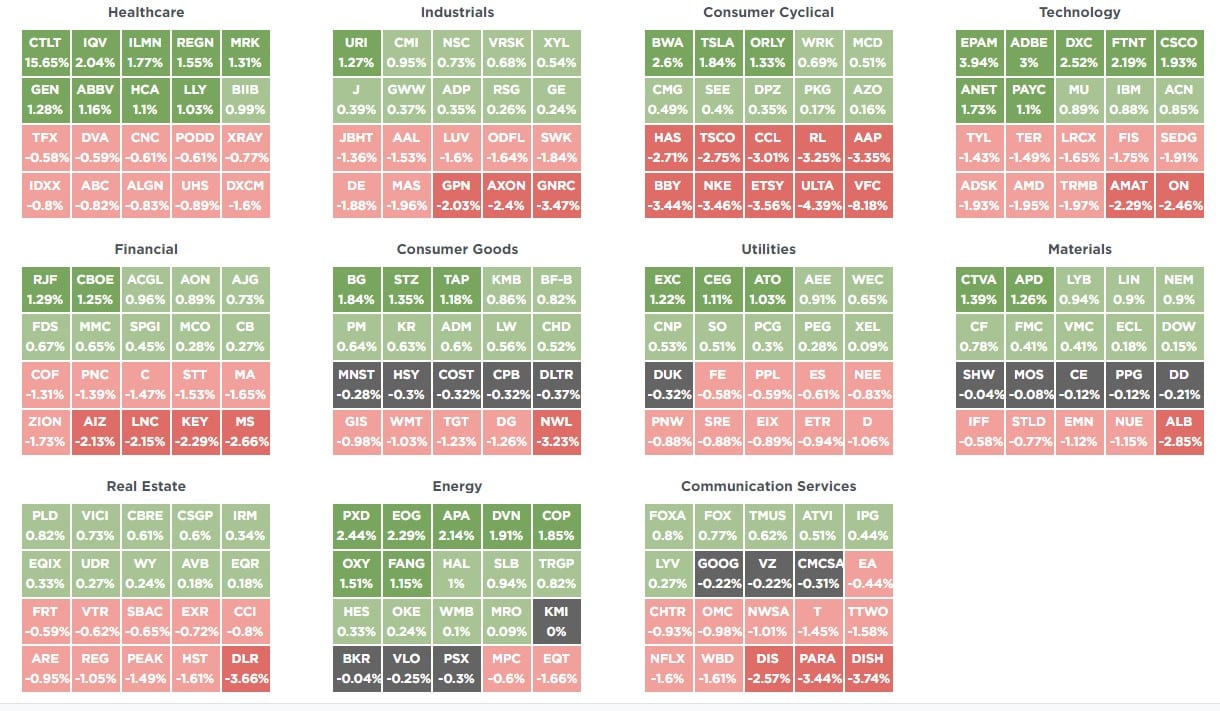
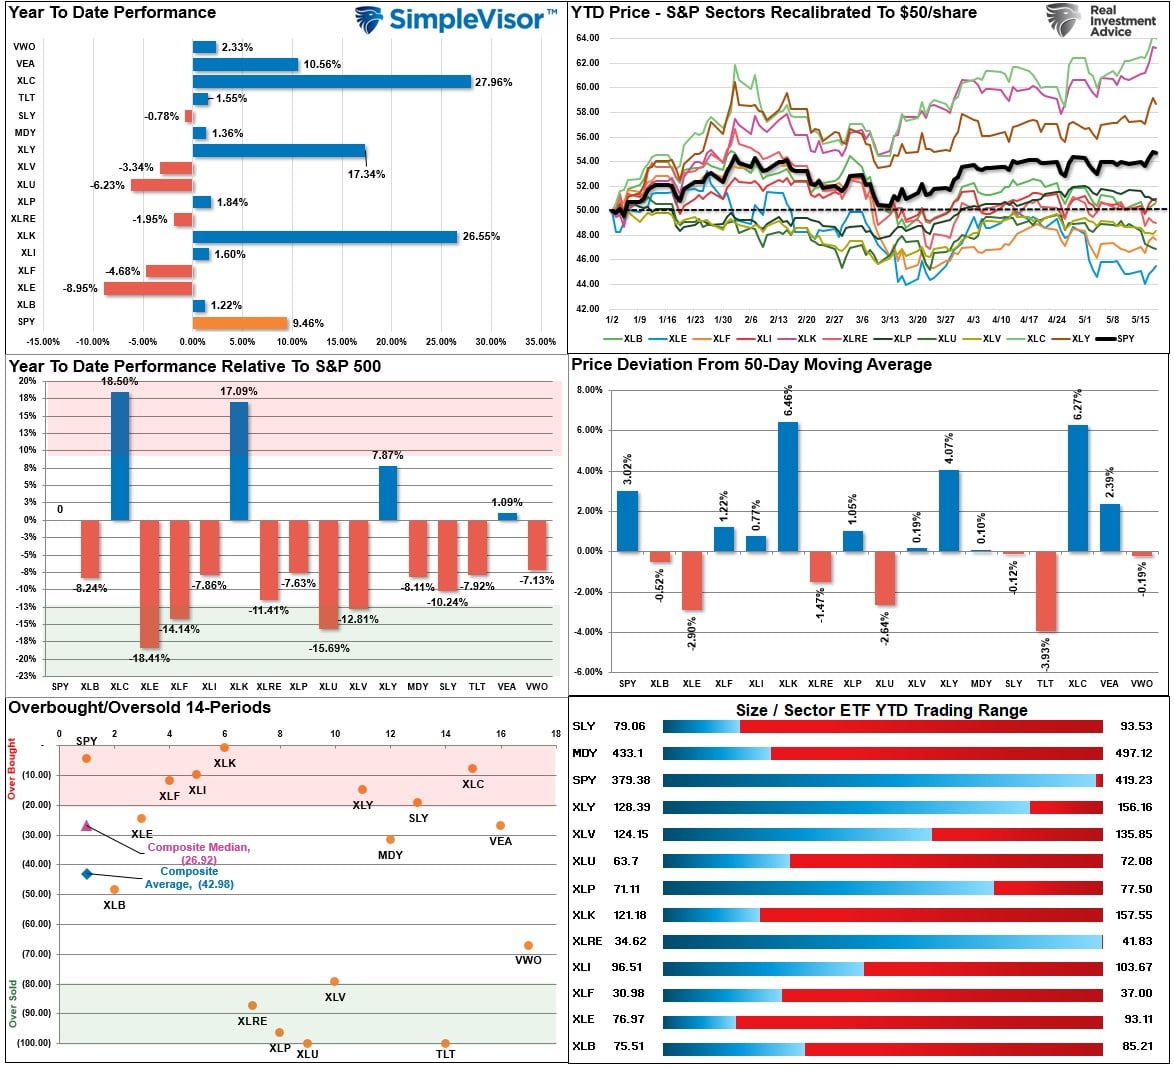
SimpleVisor Top & Bottom Performers By Sector
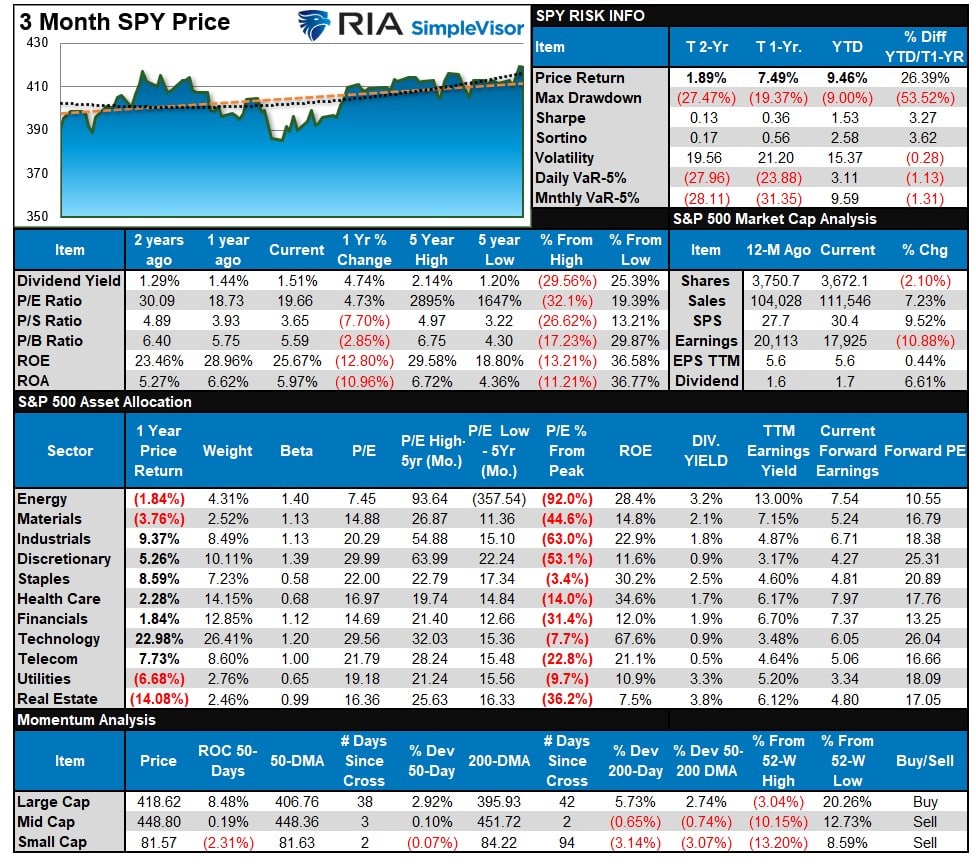
S&P 500 Weekly Tear Sheet
Relative Performance Analysis
With the market breaking out this past week, such suggests a continued move higher. However, the market has a clear division between the leaders (Technology, Communication, Discretionary) and the laggards (Staples, Real Estate, and Utilities.) We should probably expect a short-term rotation between the overbought areas of the market and the oversold. However, the overall market is not overbought, so higher prices are still likely. Don’t forget to harvest some profits in the leaders and look for dips to add back to exposures.
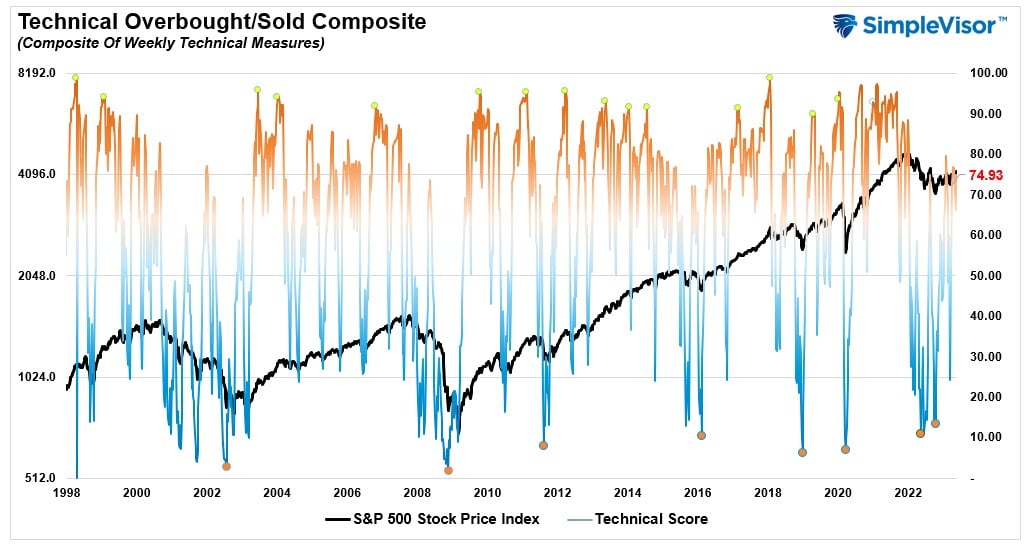
Technical Composite
The technical overbought/sold gauge comprises several price indicators (RSI, Williams %R, etc.), measured using “weekly” closing price data. Readings above “80” are considered overbought, and below “20” are oversold. The market peaks when those readings are 80 or above, suggesting prudent profit-taking and risk management. The best buying opportunities exist when those readings are 20 or below.
The current reading is 74.93 out of a possible 100.
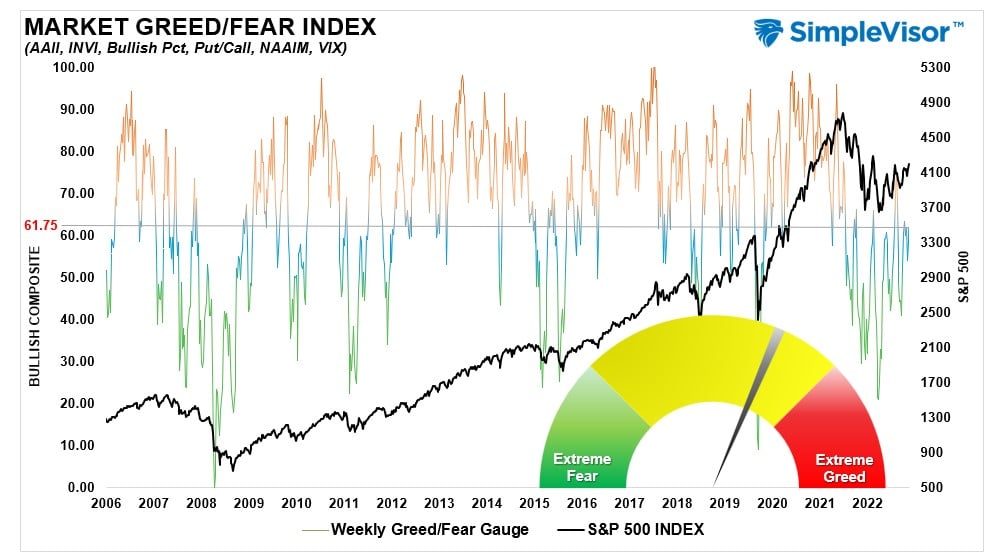
Portfolio Positioning “Fear / Greed” Gauge
The “Fear/Greed” gauge is how individual and professional investors are “positioning” themselves in the market based on their equity exposure. From a contrarian position, the higher the allocation to equities, the more likely the market is closer to a correction than not. The gauge uses weekly closing data.
NOTE: The Fear/Greed Index measures risk from 0 to 100. It is a rarity that it reaches levels above 90. The current reading is 61.75 out of a possible 100.
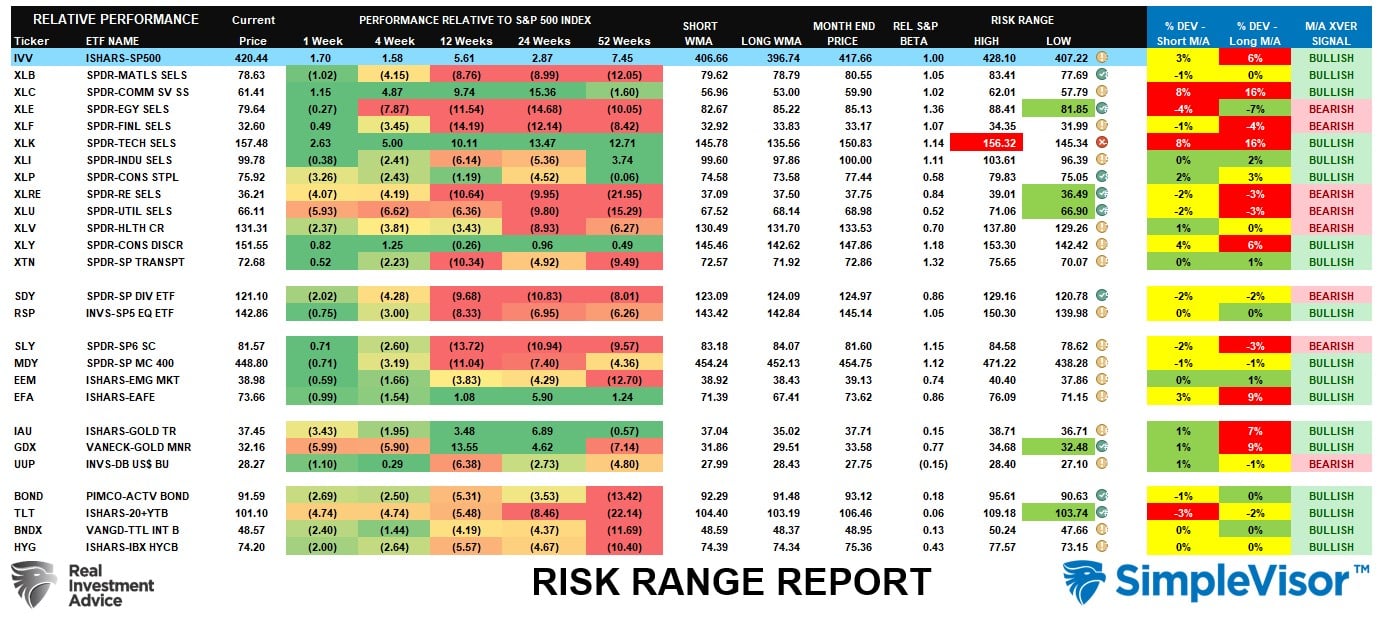
Sector Model Analysis & Risk Ranges
How To Read This Table
- The table compares the relative performance of each sector and market to the S&P 500 index.
- “MA XVER” (Moving Average Cross Over) is determined by the short-term weekly moving average crossing positively or negatively with the long-term weekly moving average.
- The risk range is a function of the month-end closing price and the “beta” of the sector or market. (Ranges reset on the 1st of each month)
- The table shows the price deviation above and below the weekly moving averages.
The market remains bullish, with Technology, Discretionary, and Communications continuing to lead the way. Financials, Energy, Real Estate, Utilities, and Health Care remain on bearish crossovers, which suggests we may continue to see underperformance in the near term from those areas. Fixed income has registered a bullish moving average crossover indicating bonds should continue performing better, particularly once the debt ceiling debate is resolved.
Weekly SimpleVisor Stock Screens
We provide three stock screens each week from SimpleVisor.
This week we are searching for the Top 20:
- Relative Strength Stocks
- Momentum Stocks
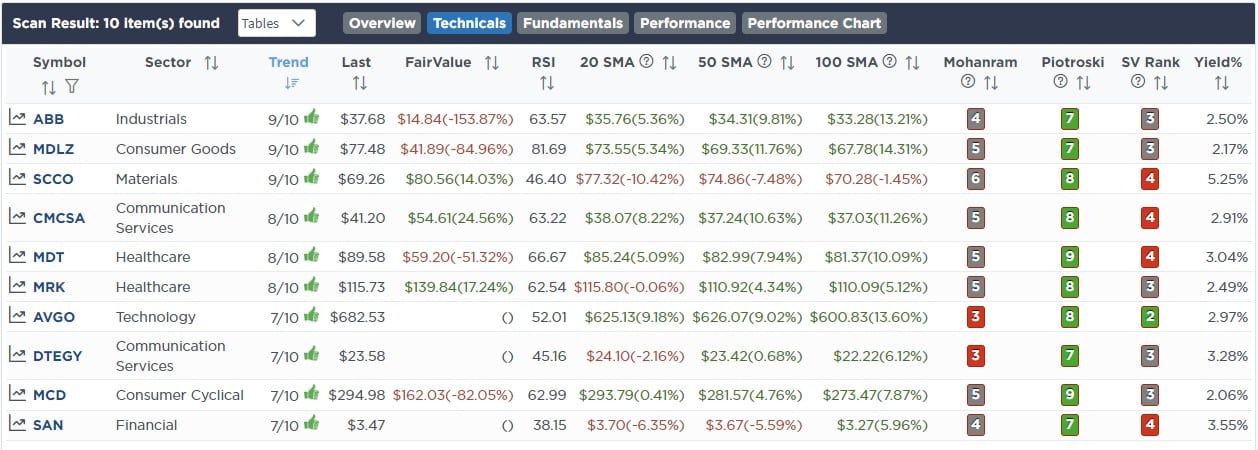
- Technically Strong Stocks With Dividends
(Click Images To Enlarge)
RSI Screen
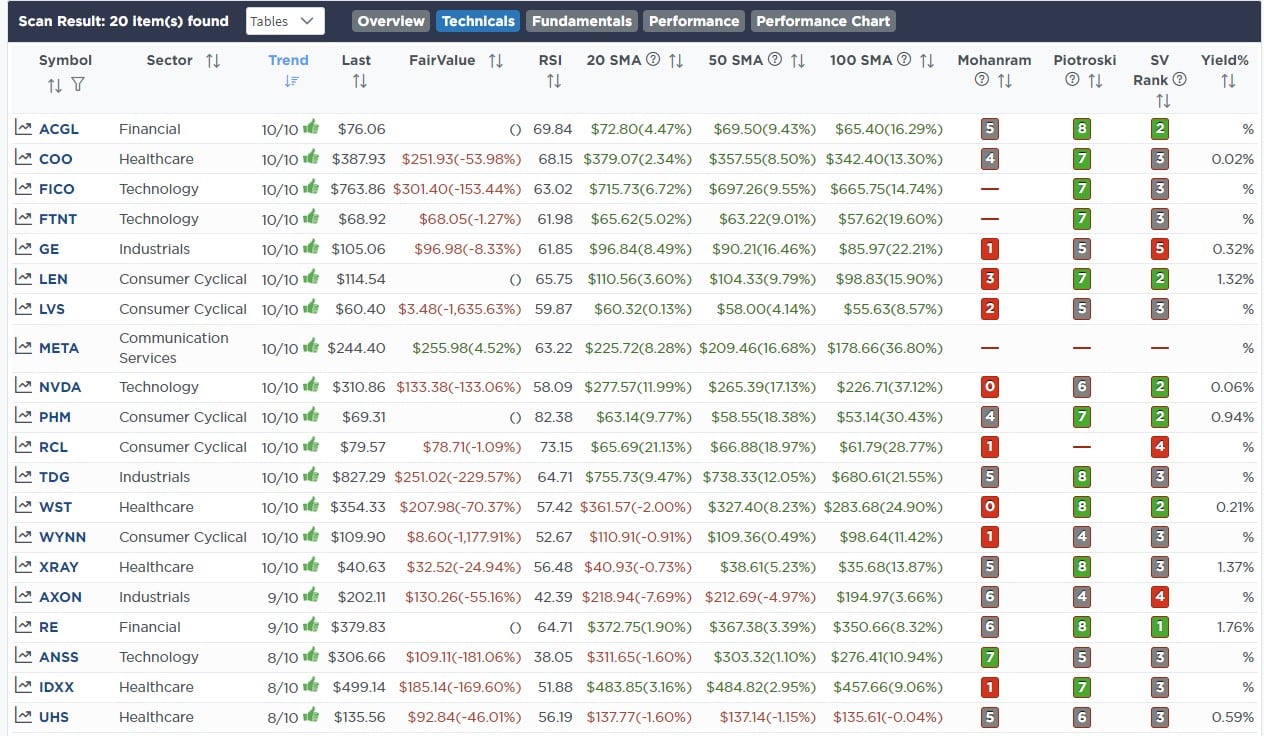
Momentum Screen

Technically Strong With Dividends
SimpleVisor Portfolio Changes
We post all of our portfolio changes as they occur at SimpleVisor:
May 16th
This morning we bought back into the energy sector. As I noted on Monday, the sector is now markedly oversold on a relative and absolute basis. Further, XLE and the underlying stocks are turning, or about to turn, to a buy signal on our money flow indicators and from low levels. We are adding very small starter positions currently, as momentum remains weak in the sector. However, if we begin to see a rotation, we will add further to the positions.
Equity Model
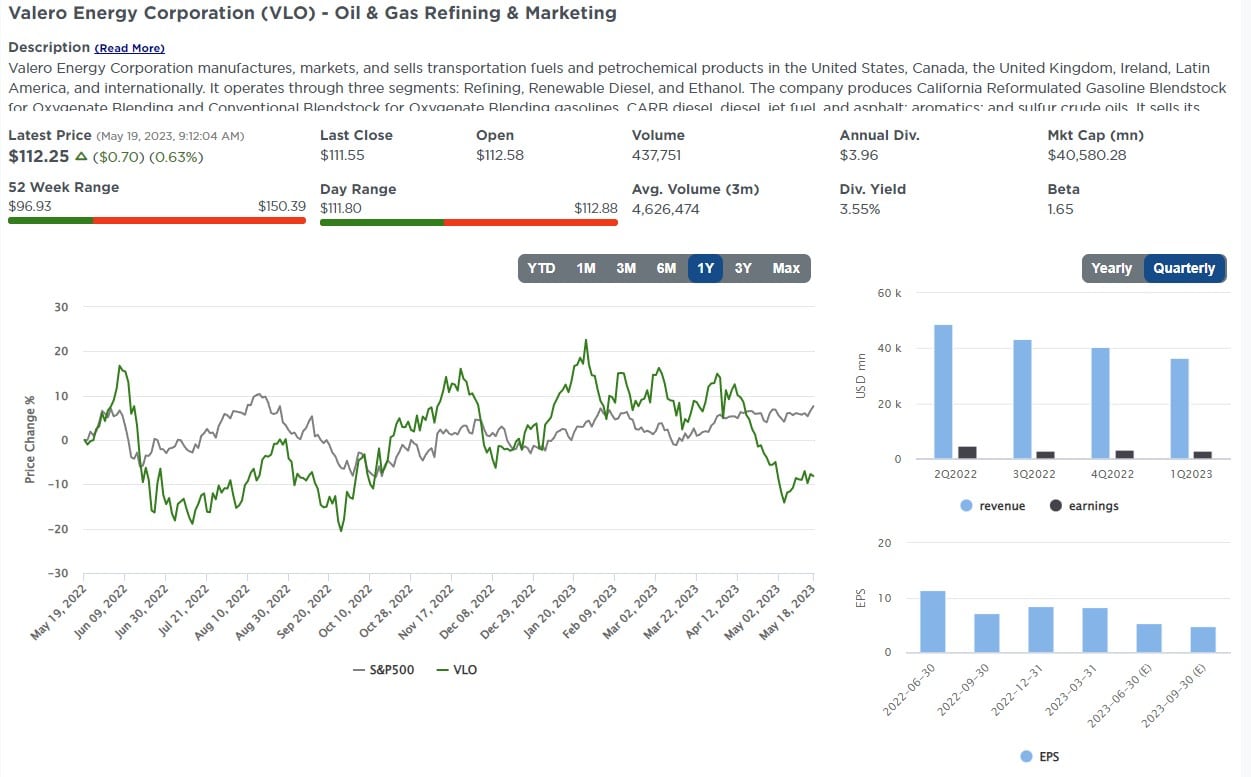
- Initiate a 1% portfolio position in both Valero Energy (VLO) and Exxon Mobil (XOM)
ETF Model
- Buy 2% of the total portfolio size into the iShares Energy ETF (XLE)
May 19th
Back in March, when Silicon Valley Bank failed, we eliminated all financial exposure in portfolios until we could better assess the situation unfolding. Since then, several banks have been folded, and the regional banking sector has suffered significant losses in stock prices and deposits. While the situation is yet to be fully resolved, there are opportunities in the regional bank space to take advantage of. As such, we are stepping into the sector with very small initial positions in Truist Financial (TFC) and PNC Bank (PNC). Of the two, Truist is the most at risk of an impact from further deposit losses and commercial real estate. Most likely, PNC will be the acquirer of any other bank resolutions needed. So, while TFC does have price risk, we are hedging that risk with a safer bank in PNC.
Opportunistically, if our thesis plays out, we will continue to build into the positions over time. Ultimately, we will back these two regional banks with exposure in a non-related financial entity like Berkshire Hathaway (BRK.B) or Visa (V).
Equity Model
- Initiate a 1% portfolio position in both Truist Financial (TFC) and PNC Bank (PNC.)
ETF Model
- Initiate a 1% portfolio position in the iShares Financial ETF (XLF).

Lance Roberts, CIO
Have a great week!


