Trump’s COVID Infects The Market Bounce. Is It Over? 10-02-20


In this issue of “Trump’s COVID Infects The Market Bounce, Is It Over?”
- Administrative Note
- Market Catches Trump’s COVID Infection.
- Does It Matter Who Wins The Election?
- Portfolio Positioning Update
- MacroView: The Astonishing Lack Of Value In Value
- Sector & Market Analysis
- 401k Plan Manager
Follow Us On: Twitter, Facebook, Linked-In, Sound Cloud, Seeking Alpha
We Need You To Manage Our Growth.
Are you a strong advisor who wants to grow your practice? We need partners we can work with to manage our lead flow. If you are ready to move your practice forward, we would love to talk.

Catch Up On What You Missed Last Week

Administrative Note
Yes. Yes. I know. I have not done any videos this week for our YouTube Channel.
One of the benefits of getting older is you get the opportunity to undergo unexpected surgeries. In this case, a hernia that knocks you out of action for a few days. I will be back in action shortly, and appreciate all the kind emails of support and outreach.
However, with that said, I am on a lot of drugs while writing this. So, if you disagree with my views this week, I will blame the drugs. The drugs are also why this week’s message will be a bit shorter than usual.
Next week, everything should return to normal.
But, to make up for “what I didn’t do this week,” I am giving everyone access to the FULL Subscriber Report this week.
Thank you again for your patience and support.
Market Catches Trump’s COVID Infection
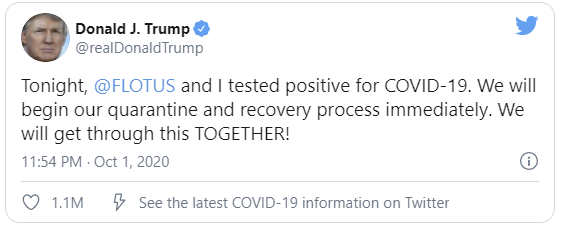
Everything was working according to plan this week, until Friday morning. As news hit that President Trump and the First Lady contracted COVID-19, so did the market at the open with Dow down roughly 450 points.
Last week’s missive “The Selloff Is Overdone,” noted the decline was orderly and not one of a “panic” induced rout.
“While the sell-off in the market has gotten overdone short-term, we still suggest using rallies back to the 50-dma to rebalance portfolio risks. If the market can break above resistance on Monday, clear the 50- and 20-dma’s, then old highs should not be an issue.“
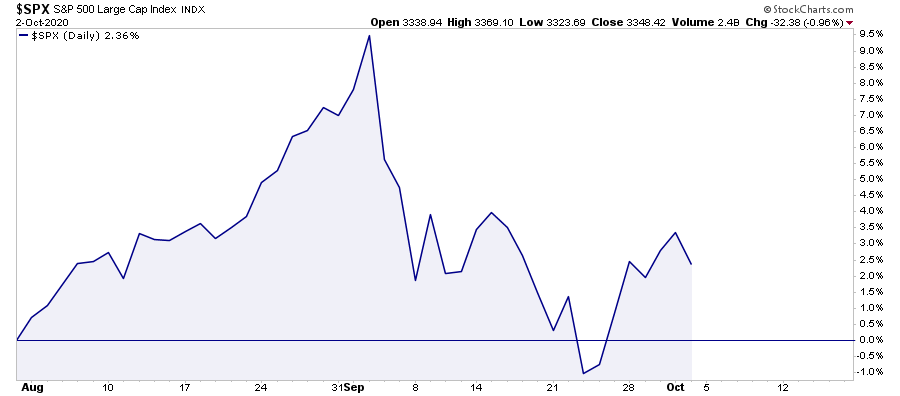
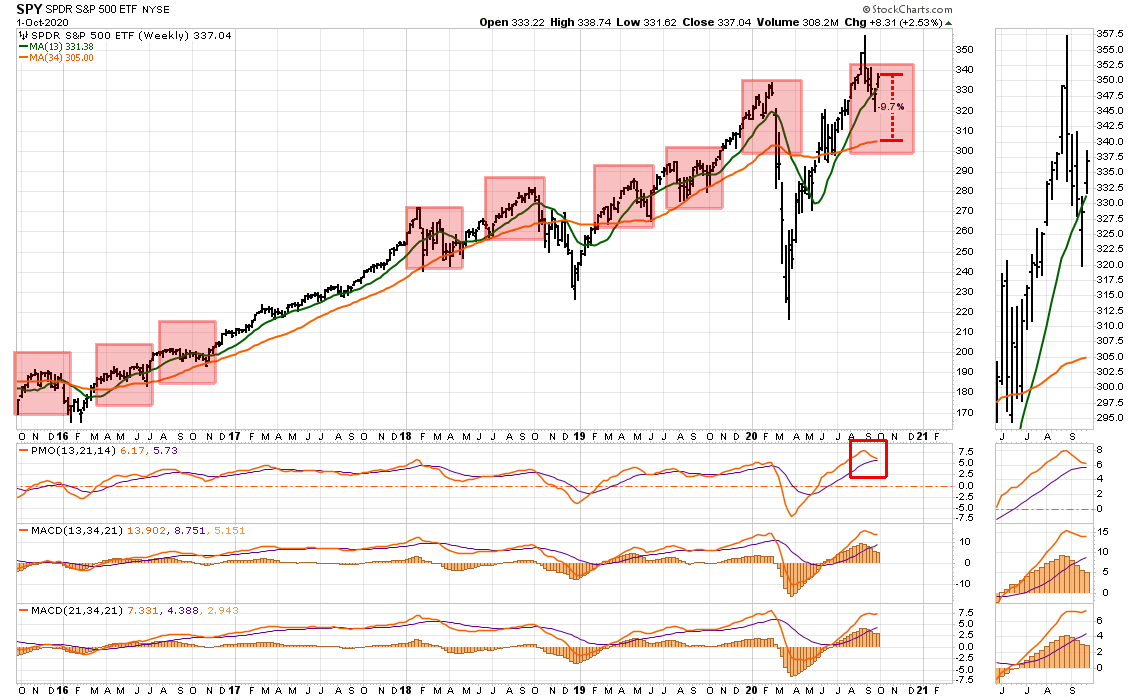
As shown below, the market did only “some” of the hard work by holding the previous resistance level, making it support, breaking out of the downtrend, but failing to clear the 50-dma. Such is an improvement from our last analysis but keeps downside risk elevated going into next week.
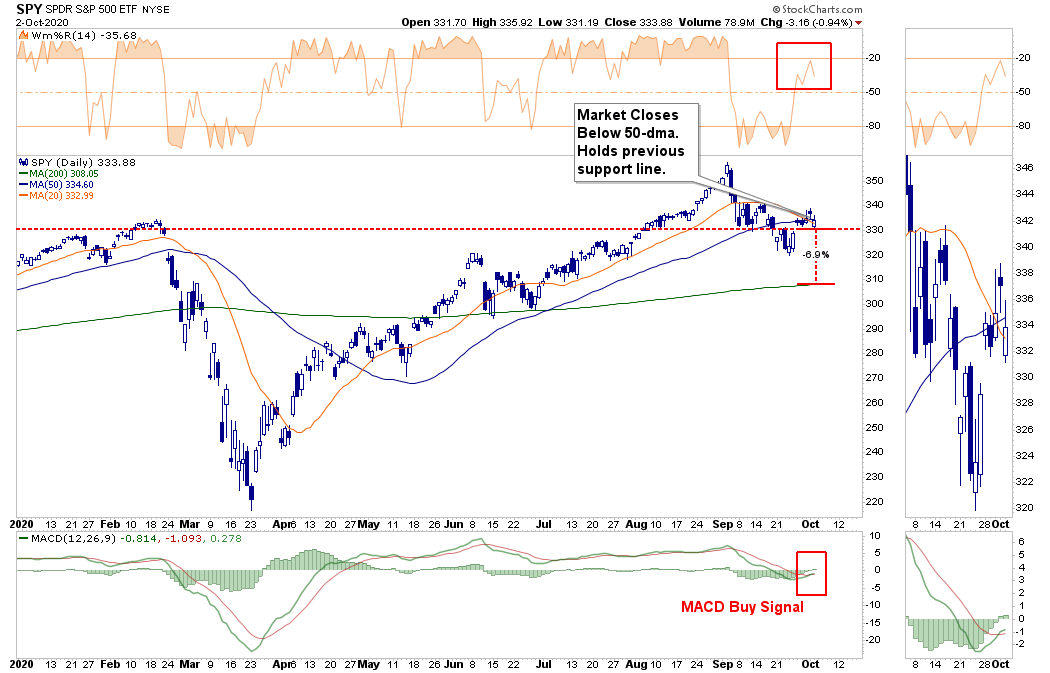
Notably, while the rally that we have witnessed from the recent lows has eaten up a fair bit of the previous oversold condition, the MACD “buy signal” was triggered on Friday.
Such suggests that we could see some additional buying next week. However, again, with the failure at the 50-dma, such means continuing to use rallies to rebalance risks accordingly.
With the election already a concern, no fiscal stimulus on the way, and rising weakness in the economic data, we added a short-market hedge to portfolios on Friday to reduce our equity exposure over the next few days as a precaution.
That is just part of our risk management process.

Does It Matter Who Wins The Election?
I got a lot of emails following our previous discussion on market performance during Presidential election years. The basic premise of these emails was:
“Yes, but if Biden wins the election, the market will crash.”
I understand. But let’s remember that in 2016, the media claimed that if Trump won the Presidential election, the market would crash.
It didn’t.
Yes, Biden’s proposed tax changes, green energy plans, and Government takeover of “healthcare” would indeed be bad for the markets. Such policies would weaken corporate profitability, specific sectors (energy and healthcare) would come under stress, and the surge in debt will make the Fed’s programs less effective.
However, the reality is that while Presidential candidates make lots of claims on the campaign trail, it is Wall Street that ultimately dictates the eventual outcomes. Such is why many suggest that our Congressmen wear racing jackets to see who is sponsoring them for office.

If you think for a moment that Congress comes up with, and writes, bills on their own, you are sadly mistaken. They are not that smart. Such is why whenever bills come to the floor for a vote, they always favor the group or industry whose lobby wrote and promoted the bill in the beginning.
I am not cynical. It is just how the Government works.
From a policy change perspective, assuming Joe Biden wins the November election, Trump remains in office until January 20th of 2021. That gives the market roughly 3-months to begin pricing in what the expected policy impact will be.
Time is always kind to the market. It is still the quick, unexpected, exogenous events, like shutting down the economy, that markets do not take kindly too.
Presidential Election Returns
Historical market data also confirms the same. While I detailed the historical data previously, Dan Clifton of Strategas Research Partners also shows the markets don’t care much about election outcomes.
His data is interesting as it shows how stock market performance leading up to an election has been an indicator of the outcome. The performance of the S&P 500 in the three months before an election has predicted 87% of elections since 1928 and 100% since 1984. When returns were positive, the incumbent party wins. If the index suffered losses in the three-month window, the incumbent loses.
For now, the market is favoring a Trump win.
However, 1-year after the election, returns were positive regardless of who won or lost. In other words, the market ultimately doesn’t care who is in office. Finally, markets only care if the economic backdrop is strong enough to support earnings growth and valuation expansion.
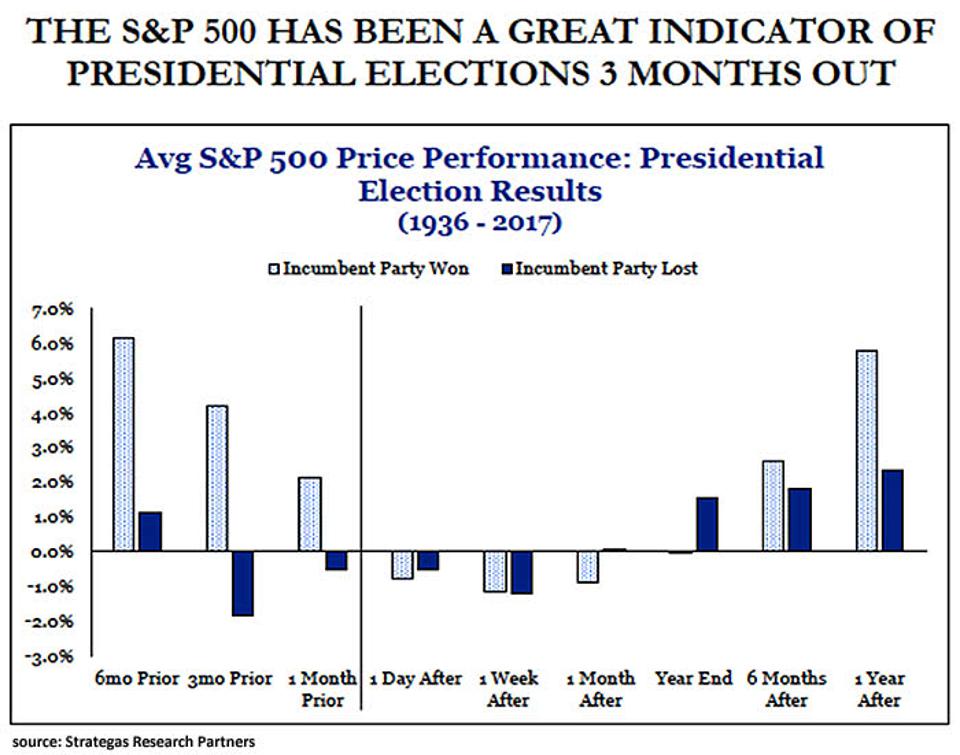
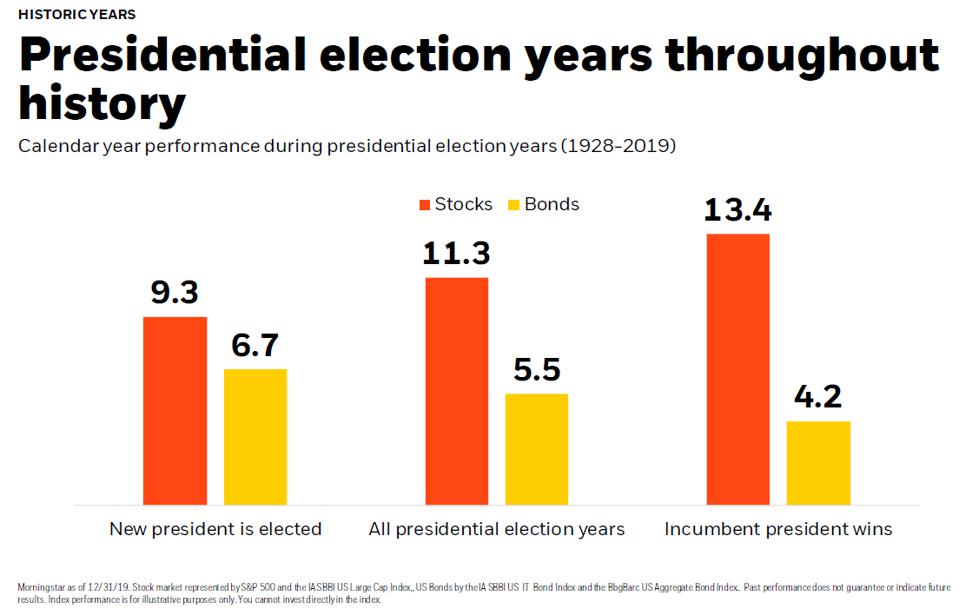
However, it is worth noting that while returns are positive regardless of who is elected, it should be of no surprise the markets performed better during a year when voters re-elect the incumbent. The market hates uncertainty. In this case, Biden presents many unknowns: the potential for increased regulations, higher taxes, and other shifts the market perceives as anti-business.

But A Biden Win Could Be Positive Too
While you may not like the title, let me explain.
The one thing holding back the market, the economy, and more importantly, the Federal Reserve, is the lack of another “fiscal stimulus” package from Washington. As my colleague Doug Kass explains:
“A Biden Presidential win (and possible Congressional sweep) could be market-friendly. Before one objects to my interpretation, let me explain.
The government (and by that I mean both the Congress and the White House) has failed our small businesses that have been gutted by Covid-19. As Jim Cramer tweeted, “they failed us,” the big ones won (Amazon (AMZN) , Target (TGT) , Costco (COST) , Walmart (WMT) , etc.) and it is growing almost too late for fiscal stimulus that could provide the necessary help to Main Street:
So, most importantly, a Biden win and Democratic sweep of Congress would hasten the imperative and passage of a massive fiscal stimulus program.”
Don’t Get All In A Bunch
Before you get all fired up and start emailing me, this is NOT about politics. (Also, remember I am on drugs.)
I am only discussing the investing outcome.
As I noted last week, the Federal Reserve is trying to plug a hole that fiscal policy was widely expected to fill by now. However, the Fed’s ability to expand on current programs is limited to the Treasury Department’s issuance of additional debt. Without another “fiscal relief” bill, there isn’t enough debt issuance to support another round of interventions by the Fed.
The Fed needs a stimulus program to expand QE, and they need it now.
However, more #fiscal stimulus is needed if the #stock #market rally is going to persist. The #Fed is limited without more #bonds to monetize. pic.twitter.com/dgkXpW3WtT
— Lance Roberts (@LanceRoberts) October 1, 2020
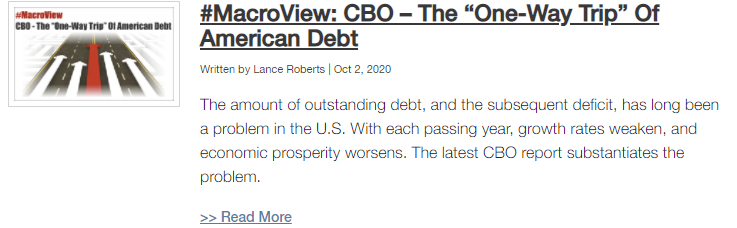
Of course, more debt is also a problem, but that is the story we discussed in our MacroView yesterday.
Projected debt in 2050 is nearly five times higher than the 50-year average of 42 percent of GDP. It will be on track to double the previous record of 106 set just after World War II. In dollar terms, debt will rise from nearly $21 trillion today to $121 trillion by 2050.” – CFRB
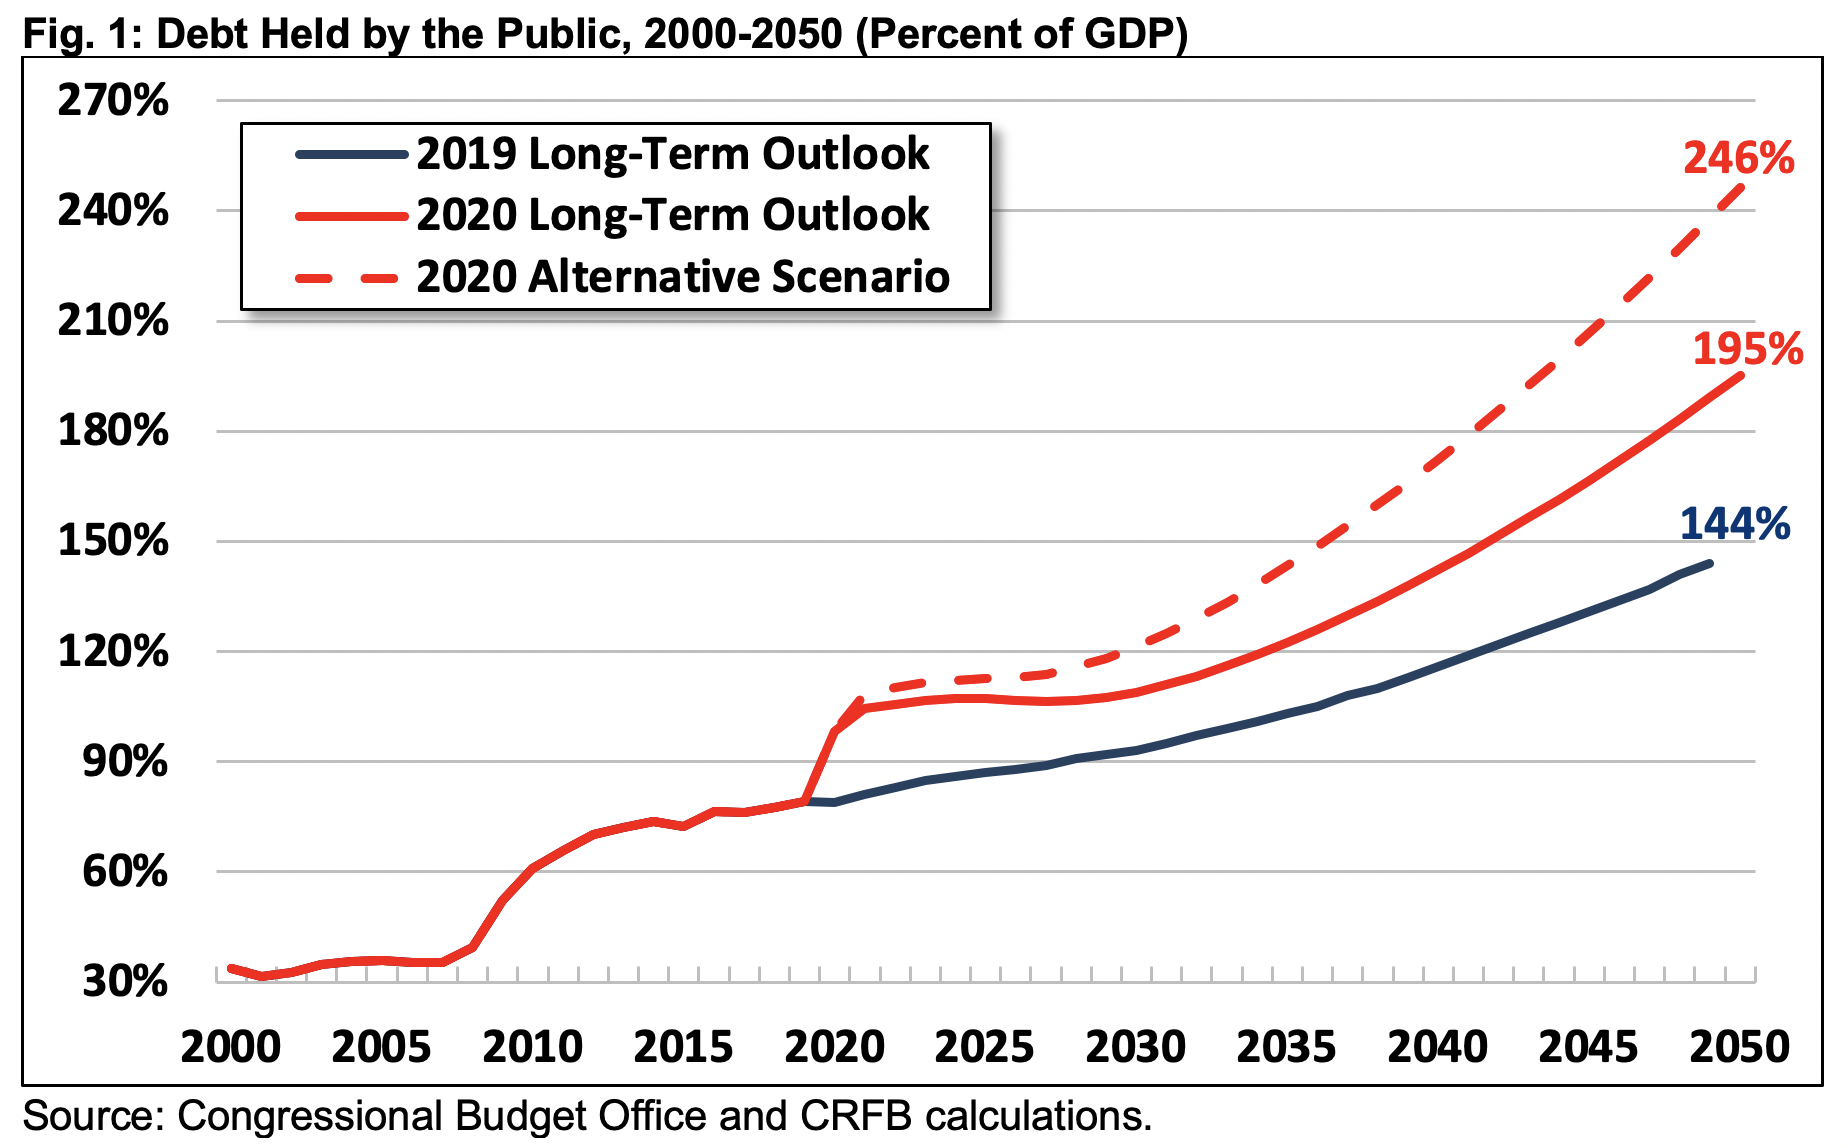
“Actual debt levels could grow significantly faster than CBO forecasts. Under our alternative scenario, debt would reach 246 percent of GDP in 2050.
Even under current law, high and rising debt represents a large fiscal gap. For example, CBO estimates policymakers would need to enact 3.6 percent of GDP in spending cuts and tax increases starting in 2025. Such actions could restore the debt to 2019 levels by 2050. That’s the equivalent of cutting all spending by one-sixth or increasing all revenue by one-fifth.” – CFRB
Neither of those things will happen.
More importantly, those are not market-friendly in the long-term.
So what should you do?
Invest based on what you know. Hedge for what don’t know.

Portfolio Positioning Update
So what do we know?
As noted last week, the short-term “selloff” was overdone. We stated:
“This past week, we continued to look for a ‘tradeable bottom,’ but did not see a reasonable risk/reward set up just yet.
Given the extent of the correction over the last three weeks, and the increase in negative sentiment, we will likely add trading positions to portfolios on Monday. We will primarily focus on the Technology, Communications, Discretionary, and Staples sectors.
Such aligns with our short-term “risk-reward” ranges, which are provided weekly to our RIAPRO Subscribers (Click Here For 30-day Free Trial)“
Such is what we did in both our Sector ETF Rotation and Equity Models. We did increase some of our existing holdings; we also sold positions that violated our stop levels.
Importantly, we continue to hold a healthy dose of cash. We also remain exposed to high-quality credit primarily in the areas the Federal Reserve continues to buy (i.e., Treasuries and MBS.) We also added a market-short position on Friday as a risk-hedge for the next few days.
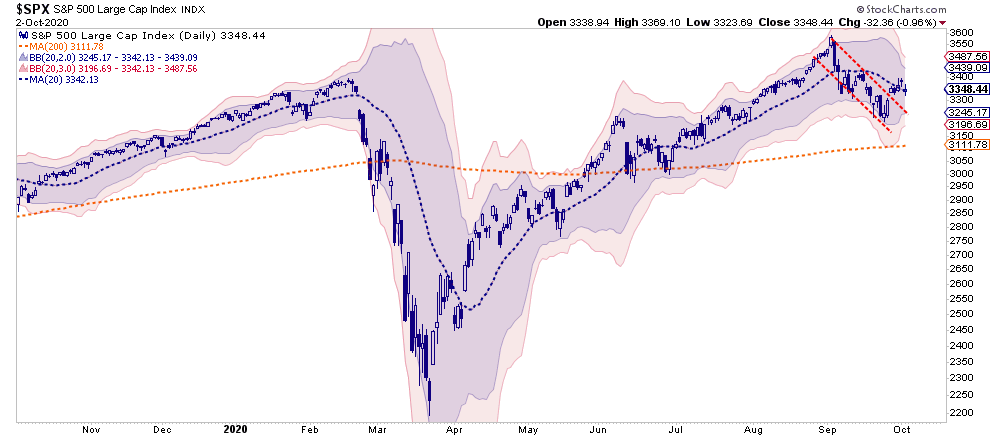
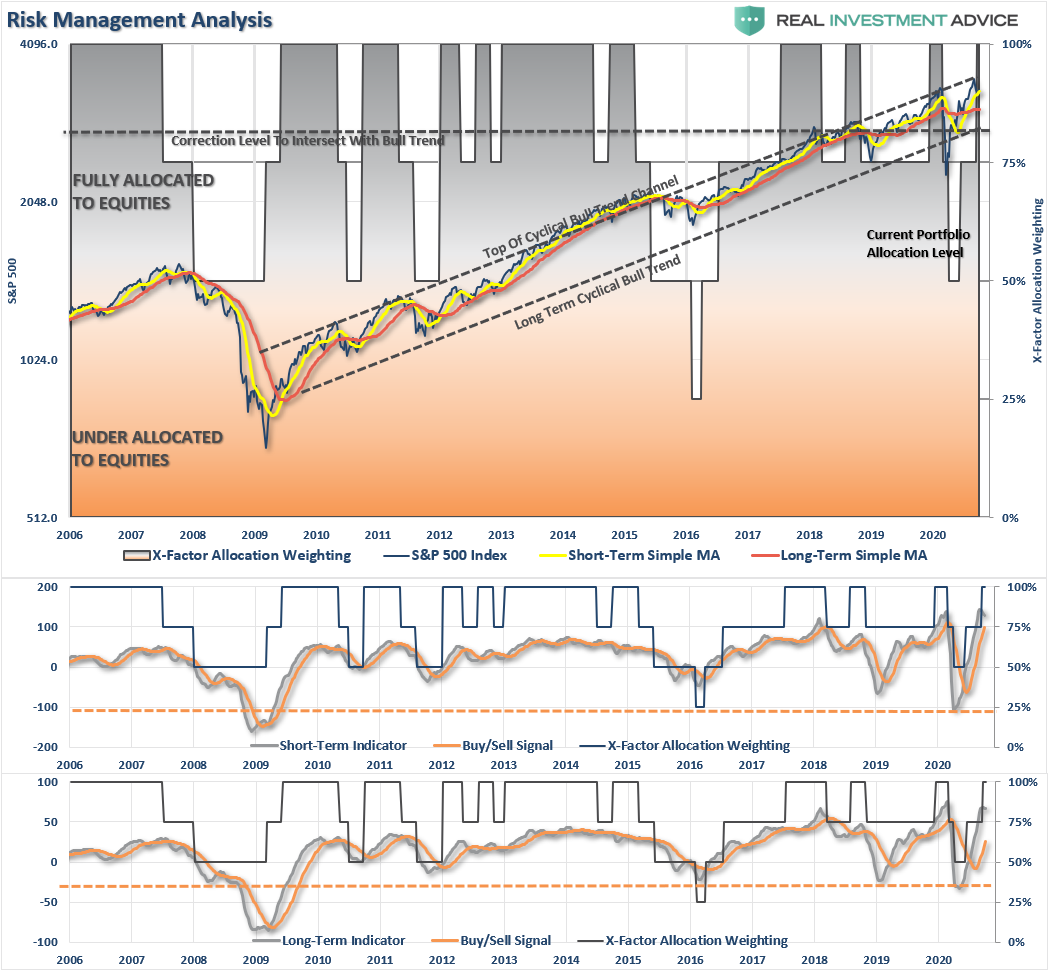
For now, we continue to play the rally for what it is – a sellable one. Over the next few weeks, a retracement back towards previous highs is possible. However, without fiscal support well on its way, another correction is likely. On a longer-term basis, as shown in the chart below, the market remains well deviated from longer-term means. That deviation will get resolved either through price or time. We don’t know which one it will be.
That is why we manage risk.
If you missed it, here are the 10-rules of risk management you can follow.

The MacroView
If you need help or have questions, we are always glad to help. Just email me.
See You Next Week
By Lance Roberts, CIO
Market & Sector Analysis
Analysis & Stock Screens Exclusively For RIAPro Members
S&P 500 Tear Sheet
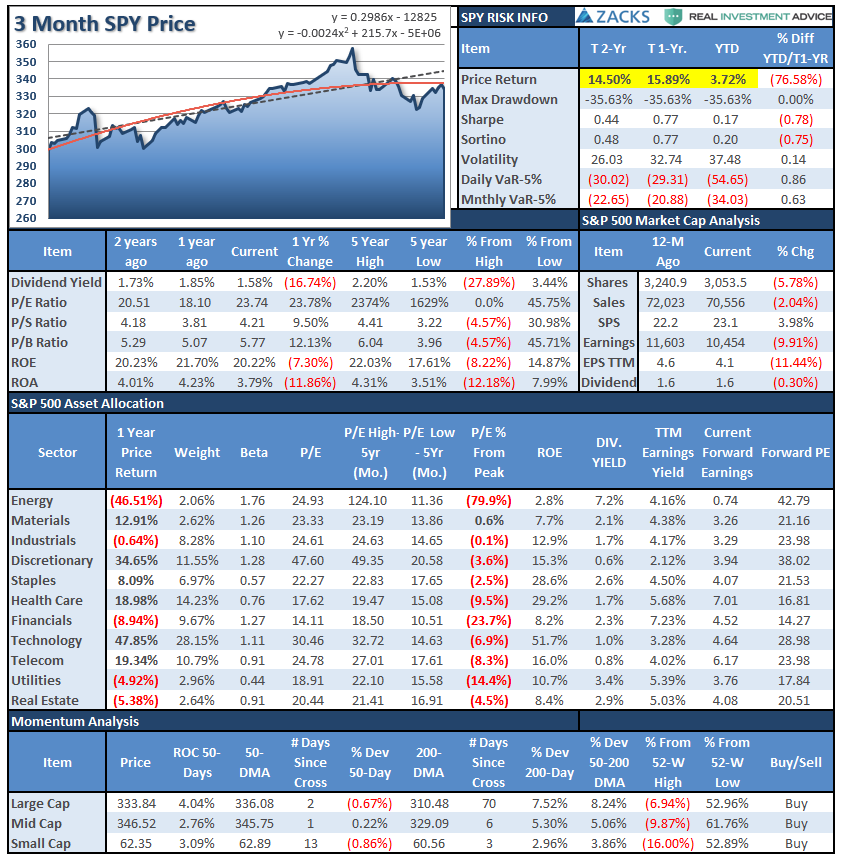
Performance Analysis
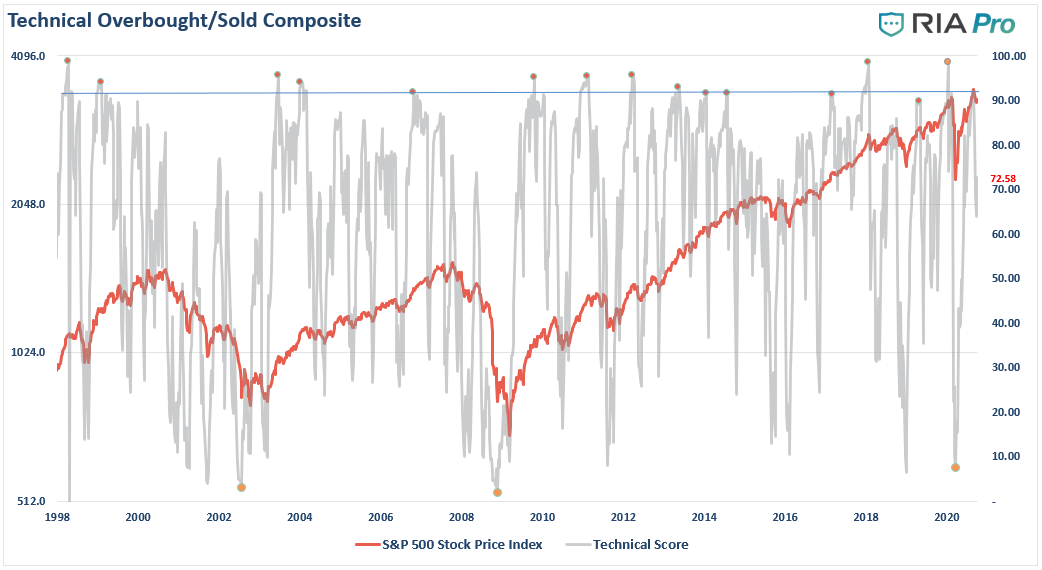
Technical Composite
The technical overbought/sold gauge comprises several price indicators (RSI, Williams %R, etc.), measured using “weekly” closing price data. Readings above “80” are considered overbought, and below “20” is oversold.
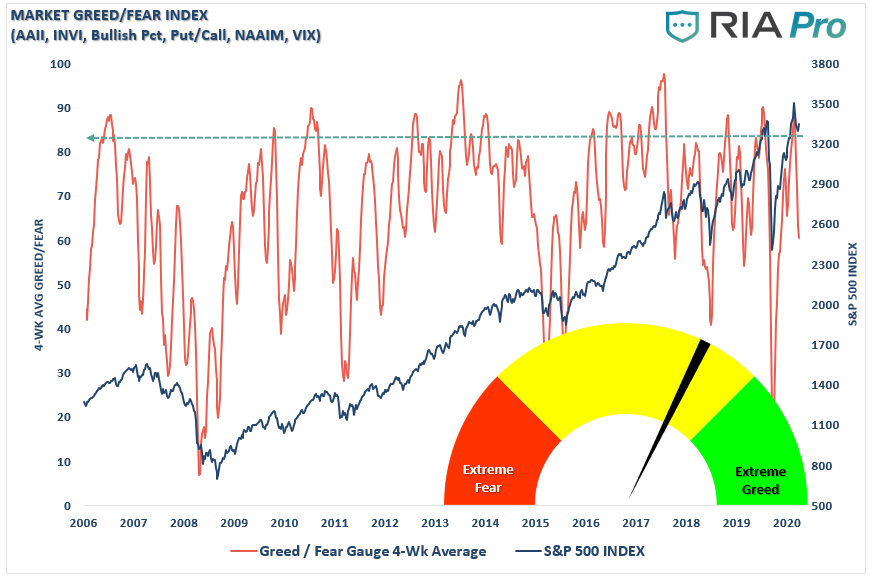
Portfolio Positioning “Fear / Greed” Gauge
The “Fear/Greed” gauge is how individual and professional investors are “positioning” themselves in the market based on their equity exposure. From a contrarian position, the higher the allocation to equities, to more likely the market is closer to a correction than not. The gauge uses weekly closing data.
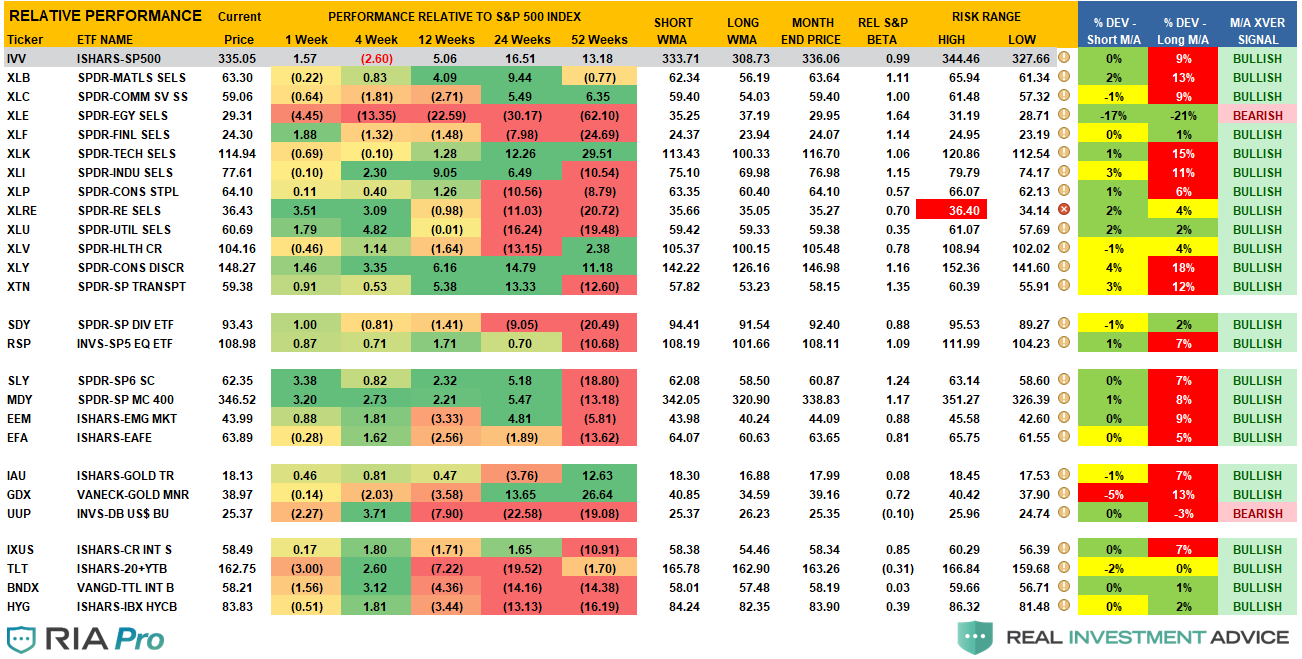
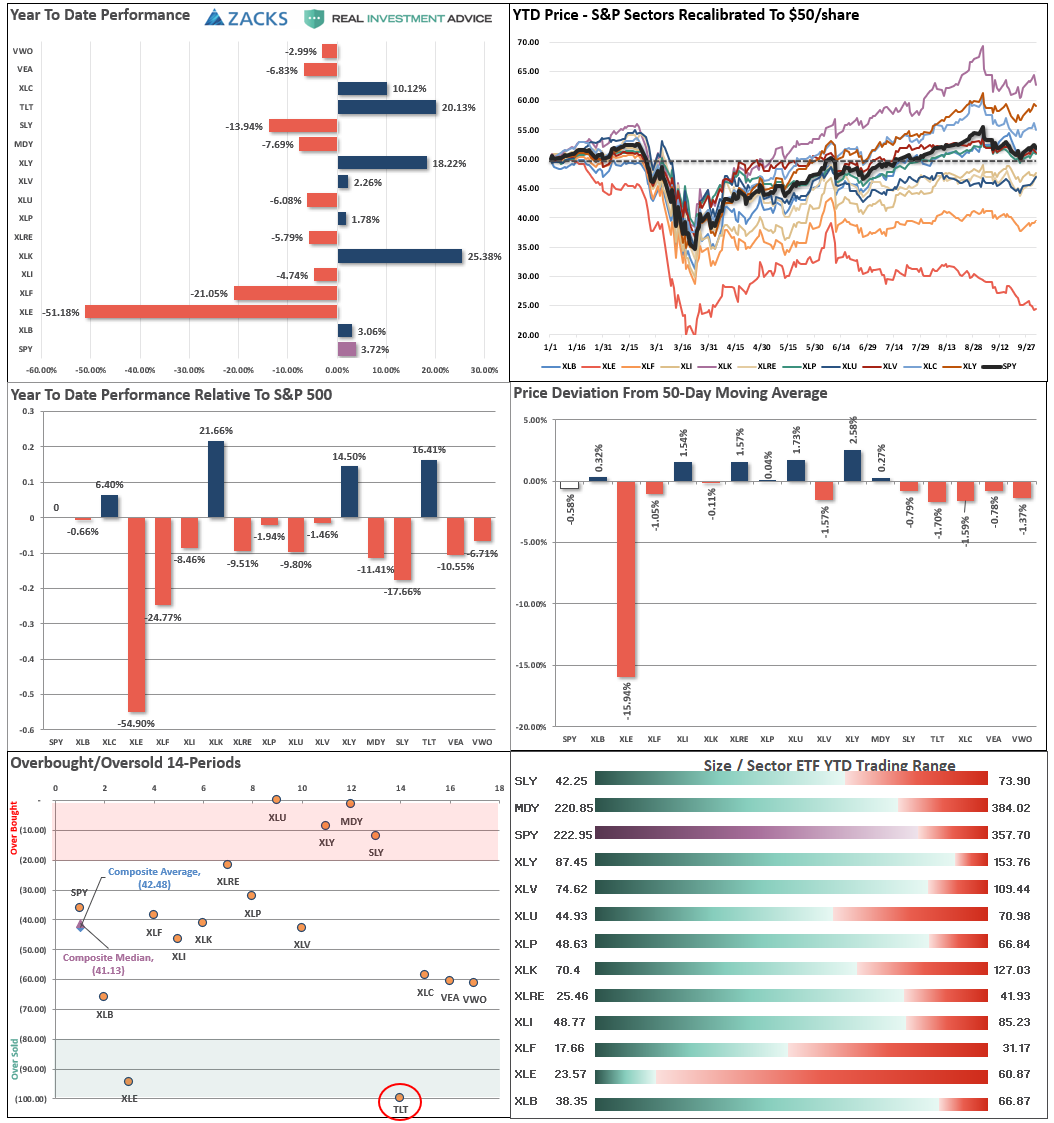
Sector Model Analysis & Risk Ranges
How To Read.
- The table compares each sector and market to the S&P 500 index on relative performance.
- The “MA XVER” is determined by whether the short-term weekly moving average crosses positively or negatively with the long-term weekly moving average.
- The risk range is a function of the month-end closing price and the “beta” of the sector or market.
- The table shows the price deviation above and below the weekly moving averages.
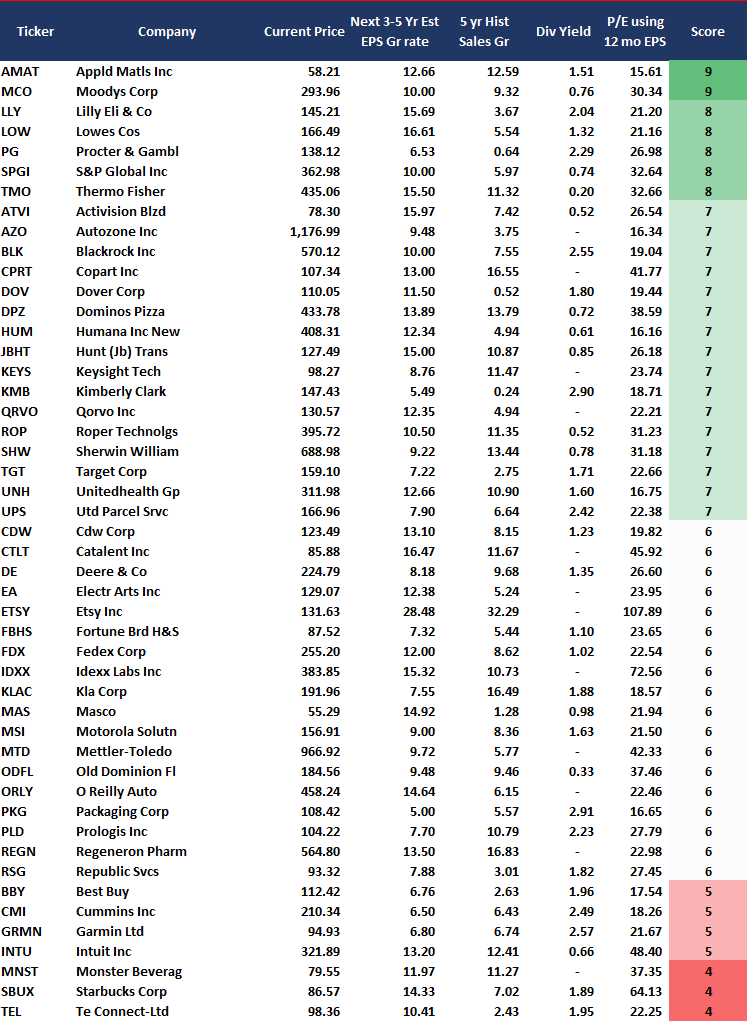
Weekly Stock Screens
Currently, there are 3-different stock screens for you to review. The first is S&P 500 based companies with a “Growth” focus, the second is a “Value” screen on the entire universe of stocks, and the last are stocks that are “Technically” strong and breaking above their respective 50-dma.
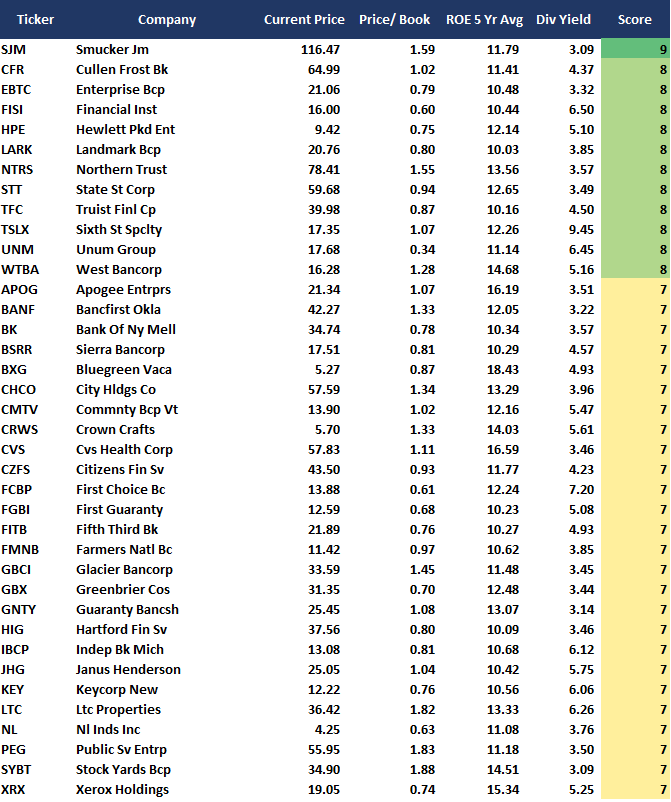
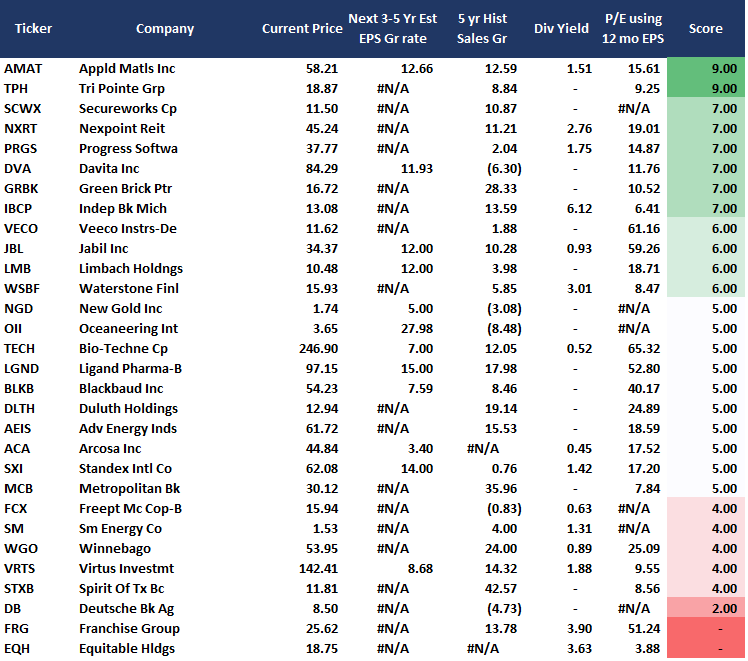
We have provided the yield of each security and a Piotroski Score ranking to help you find fundamentally strong companies on each screen. (For more on the Piotroski Score – read this report.)
S&P 500 Growth Screen
Low P/B, High-Value Score, High Dividend Screen
Technical Trading Screen
Portfolio / Client Update
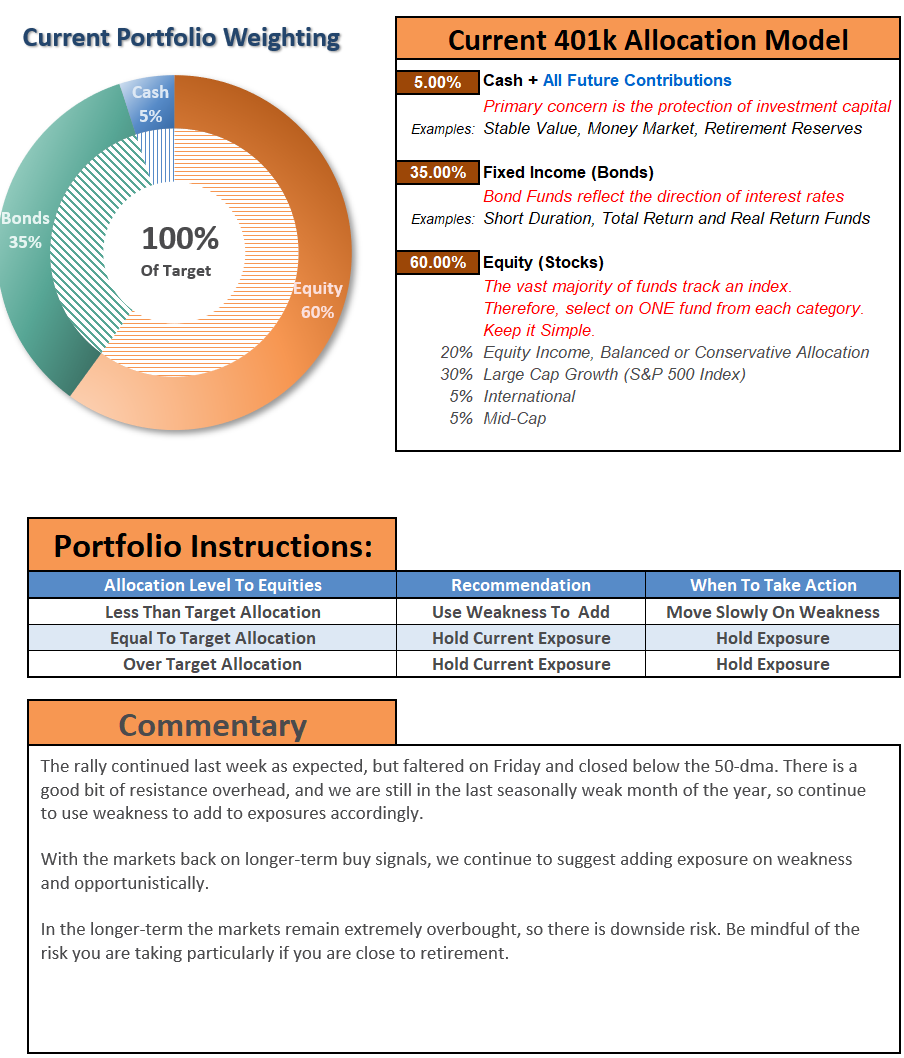
The rally continued this past week and was doing as we expected until the President announced his contraction of COVID.
What does this mean for the election? What happens if the President is incapacitated? Ballots are already out and votes cast, so do those get recast? Does the election get postponed? Or does nothing happen?
These are all the questions we went through on Friday morning and is why we added a small market hedge to our portfolios for the next few days. There are just too many unknowns to run portfolios without some downside protection, at least for a few days.
Once things begin to clear, we can quickly remove the hedge if needed. It may drag on performance near term, but it helps us maintain some control over the portfolio for now.
As noted last week, we used the current oversold condition to “average” into some of our stronger positions. We also picked added back to our exposure gold exposures after taking profits previously.
Portfolio Changes
This past week we rebalanced portfolio risks by adding stronger names and removing some of the “weaker” players for now. Such is also part of our ongoing process to consolidate the portfolio into fewer overall holdings.
Equity Portfolio:
- Sold 100% of VIAC on the break of its stop-loss.
- +1.0% JNJ & UNH
- +1.5% GOOG
- +.5% AAPL, MSFT, ADBE, NFLX, CMCSA, T, VZ
- +1.0% GDX & IAU
- +2.0% SDS (Short-Hedge)
ETF Portfolio:
- +2% XLK
- +2% XLY
- +1.0% XLV & XLC
- +1.0% GDX & IAU
- +2.0% SDS (Short-Hedge)
We continue to look for opportunities to abate risk, add return either in appreciation or income, and protect capital.
Please don’t hesitate to contact us if you have any questions or concerns.
Lance Roberts
CIO
THE REAL 401k PLAN MANAGER
A Conservative Strategy For Long-Term Investors
If you need help after reading the alert, do not hesitate to contact me.
Model performance is a two-asset model of stocks and bonds relative to the weighting changes made each week in the newsletter. Such is strictly for informational and educational purposes only, and one should not rely on it for any reason. Past performance is not a guarantee of future results. Use at your own risk and peril.

401k Plan Manager Live Model
As an RIA PRO subscriber (You get your first 30-days free), you have access to our live 401k plan manager.
Compare your current 401k allocation to our recommendation for your company-specific plan and our on 401k model allocation.
You can also track performance, estimate future values based on your savings and expected returns, and dig down into your sector and market allocations.
If you would like to offer our service to your employees at a deeply discounted corporate rate, please contact me.


