
Inside This Week’s Bull Bear Report
- Conflict Or Earnings? The Market’s Next Driver?
- How We Are Trading It
- Research Report – Crisis Events Are A Hallmark Of The Fed
- Youtube – Before The Bell
- Market Statistics
- Stock Screens
- Portfolio Trades This Week
Market Update & Review
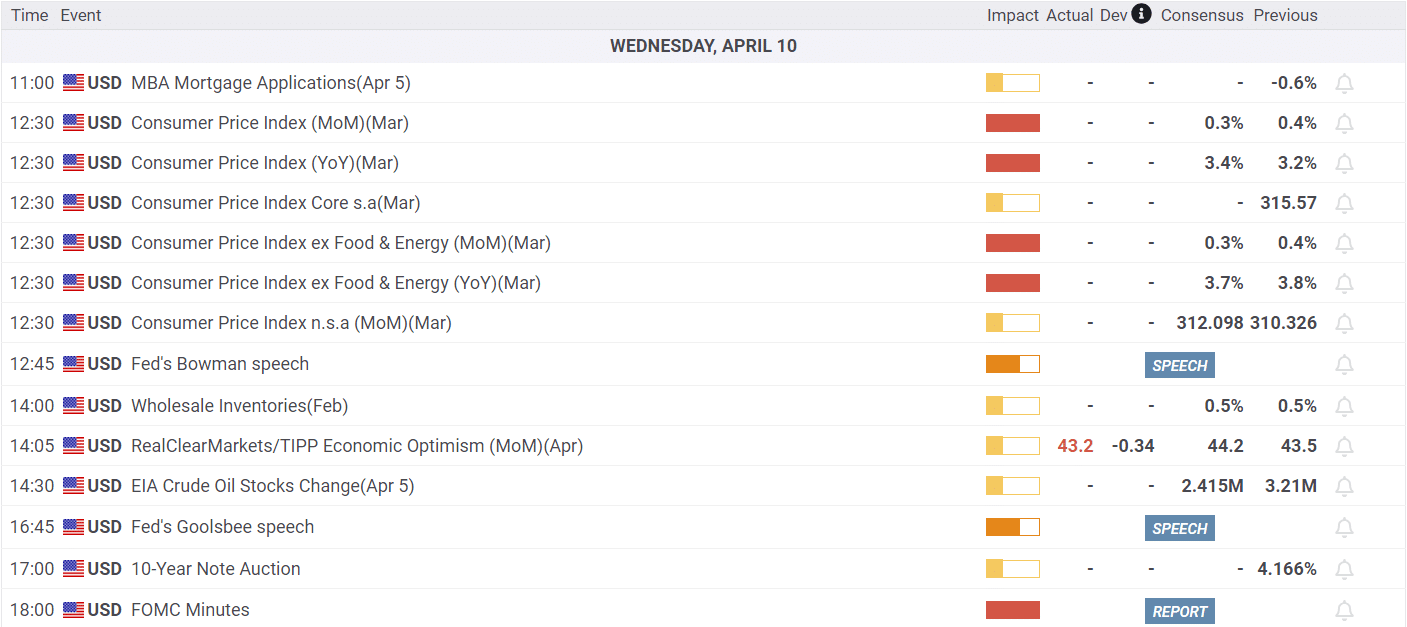
As we will discuss, the conflict with Israel took center stage this past week. However, the markets also had to deal with PPI, CPI, and the official kick-off of earnings season. From a market trading update perspective, let’s start with a review from last week. To wit:
“The market failed to hold that initial support level and quickly tested the 200-DMA as expected. The good news is the market bounced sharply off support levels on Friday, reducing the MACD ‘sell signal.’ If the market can follow through on this rally early next week, we could see a ‘buy signal’ triggered.”
As shown, that happened as stocks pushed higher, triggering the MACD “buy signal.” As we will discuss below, that trigger also signals the start of the “seasonally strong” period of the year. The market did run into resistance at the 50- and 100-DMA but continues to hold above short-term support at the 20-DMA. With the market not yet overbought, we could see some consolidation at these levels into next week before another attempt at resistance.
The attempt at resistance will mostly depend on earnings reports as they get underway in earnest next week. As discussed below, the bar has been lowered substantially from last year, so we should expect a high “beat rate” of earnings. The key, however, will be forward guidance that leads to concerns about a slower economy next year.
We will be watching those reports closely.
While many concerns relate to this latest conflict in the Middle East, the market continues to act bullishly for now. The summer correction remained within the confines of seasonal weakness, and the rally off of support, as noted, keeps the market’s bullish trend intact for now.
Use short-term declines to add to equity exposure as needed, but continue to manage risk as we head into year-end.
Need Help With Your Investing Strategy?
Are you looking for complete financial, insurance, and estate planning? Need a risk-managed portfolio management strategy to grow and protect your savings? Whatever your needs are, we are here to help.

Conflict Or Earnings?
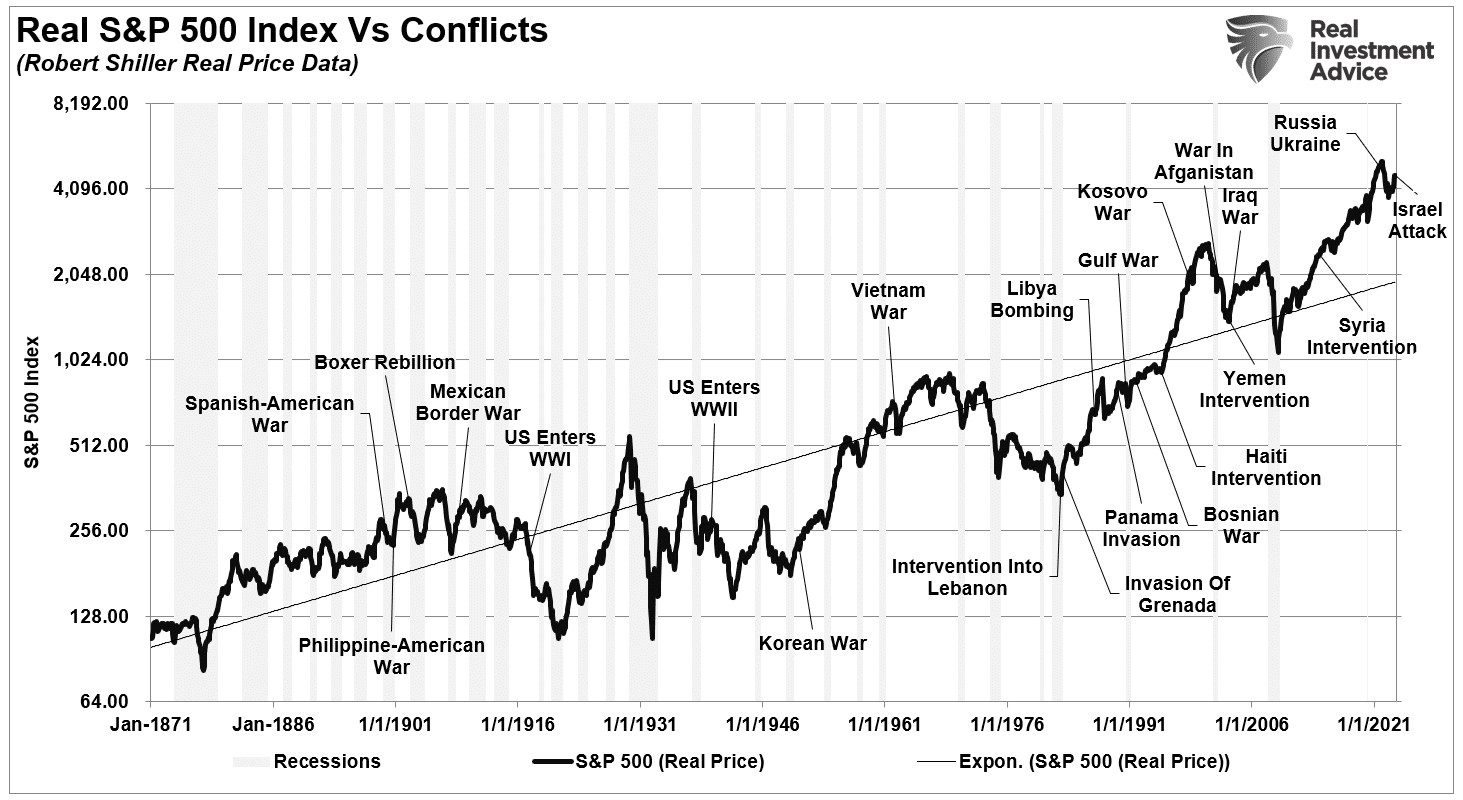
Last weekend, the world was rocked by the terrorist attack on Israel, which led to a brutal response. While this is a horrible human tragedy, the market response was as expected, with a surge in oil prices and a flight to safety in bonds. However, the question now becomes what drives the market next as we enter the year’s seasonally strong period. Conflicts are often a negative for financial markets immediately, but not over the longer term.
More importantly, the impact of uncertainty, such as war or military conflicts, drives money out of risk and into safety. Therefore, it is unsurprising that we saw a corresponding jump in bond prices over the past week as interest rates fell.
However, while conflicts are problematic, markets tend to discount that risk quickly. Also, conflicts are a boon to companies and sectors that supply the materials, products, and services to our troops or allies. As such, the market moves capital to take advantage of that boost in activity.
As noted above, the market rallied from the deeply oversold condition despite the news of the conflict in Israel. While the initial reaction was a flow of capital in defense and energy stocks, as well as bonds, the market returned its focus to the start of the upcoming earnings season and began chasing the “Mega-7” capitalization companies late i
With the markets deeply oversold from the summer sell-off, the question is whether earnings season will provide the support needed to overcome the fear of “conflict” in the short term.
Earnings Season Underway
As discussed in “October Weakness Before Year-End Run,” earnings season is always a game of “beat the estimate.”
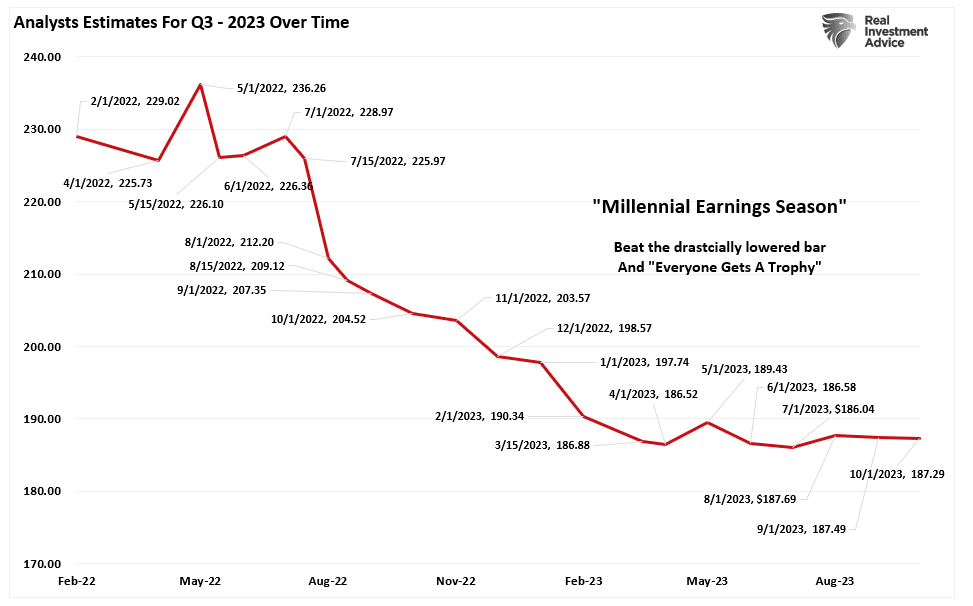
“As is always the case, analysts have significantly lowered the “earnings bar” heading into reporting season. As noted in “Trojan Horses,” analysts are always wrong, and by a large degree. This is why we call it ‘Millennial Earnings Season.’ Wall Street continuously lowers estimates as the reporting period approaches so ‘everyone gets a trophy.’”
The chart below shows the changes in Q3 earnings estimates from February 2022, when analysts provided their first estimates. Given that estimates for Q3 have fallen from a peak of $236 to $187, a 20% decline, such should generate a high “beat rate” by companies. In turn, those “beats” will boost investor confidence, which will help fuel stock prices in the short term.
With markets heading into earnings season with oversold conditions, more negative short-term sentiment, and reduced equity allocations by professional managers, such should add further support to the rally. As noted last week,
“Professional money managers tend to ‘Sell Bottoms.’ Last week, the equity exposure index fell below 40%, which is normally close to or at market bottoms.“
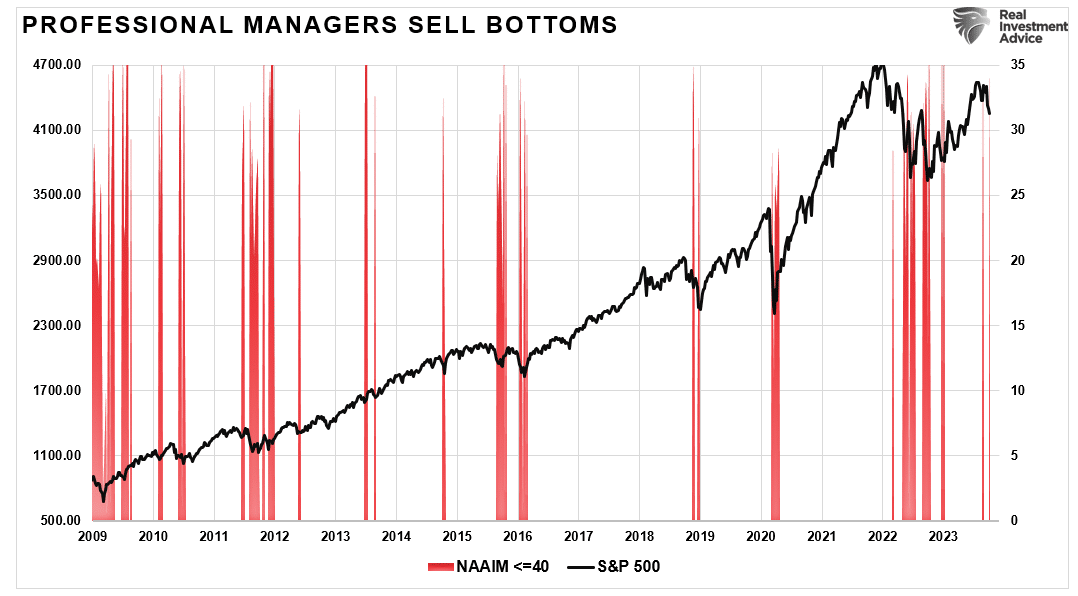
Since professional managers have lagged in performance this year due to the narrowness of the S&P rally, they potentially suffered “career risk” when end-of-the-year reporting comes. Therefore, we will likely see a reversal of positioning by these managers to chase stocks higher.
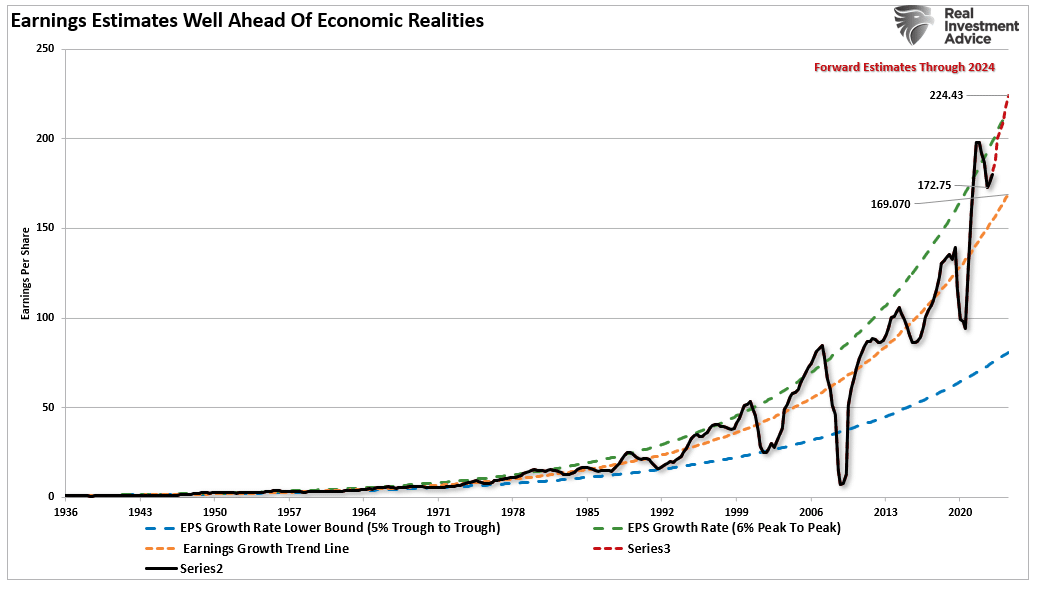
As earnings season gets underway, we will want to pay attention to clues as to the impact of inflation, conflicts, slowing spending, or weaker economic outlooks on future revenue growth and profitability. Such is particularly important given that forward estimates remain well above long-term growth trends and economic realities.
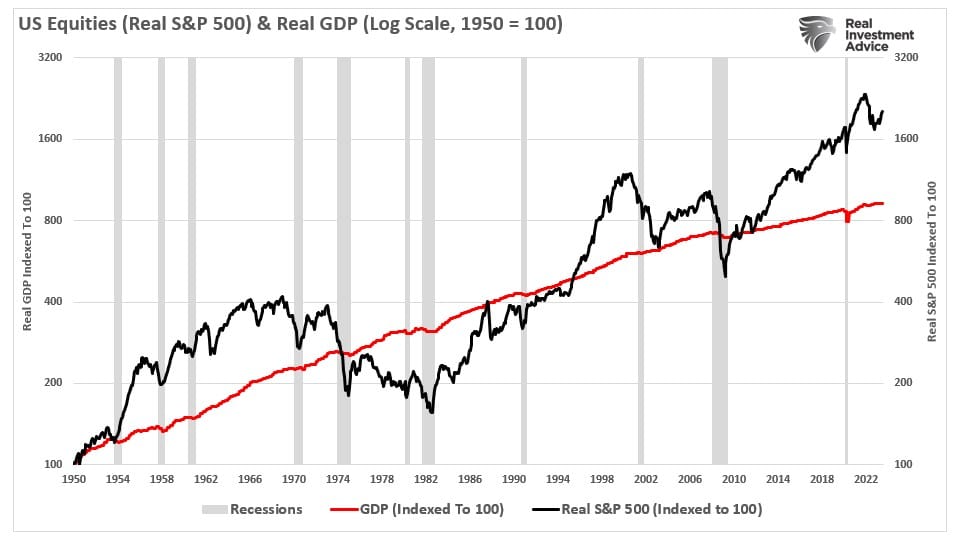
In “Market Detached From Real Economy,” we discussed the problem in more detail, given that earnings are a function of economic activity. To wit;
“While it is common for the market to become detached from the underlying economic activity for long periods as speculative excess detaches the market from underlying fundamental realities. Such is clearly shown in the chart below, which compares the stock market to GDP on an inflation-adjusted basis. In all cases, market excesses eventually ‘mean revert.’ The only issue is the catalyst that causes it.”
It is hard to fathom how forward return rates will not be disappointing compared to the last decade. However, we must remember those excess returns resulted from a monetary illusion. The consequence of dispelling that illusion will be challenging for investors. As we concluded:
“Will this mean investors make NO money over the decade? No. It means that returns will likely be substantially lower than investors have witnessed over the last decade. But then again, getting average returns may ‘feel’ disappointing to many.”
Seasonal Buy Signal Is In
In the article hyperlinked above discussing October’s weakness, the market continues to follow its seasonal tendencies.
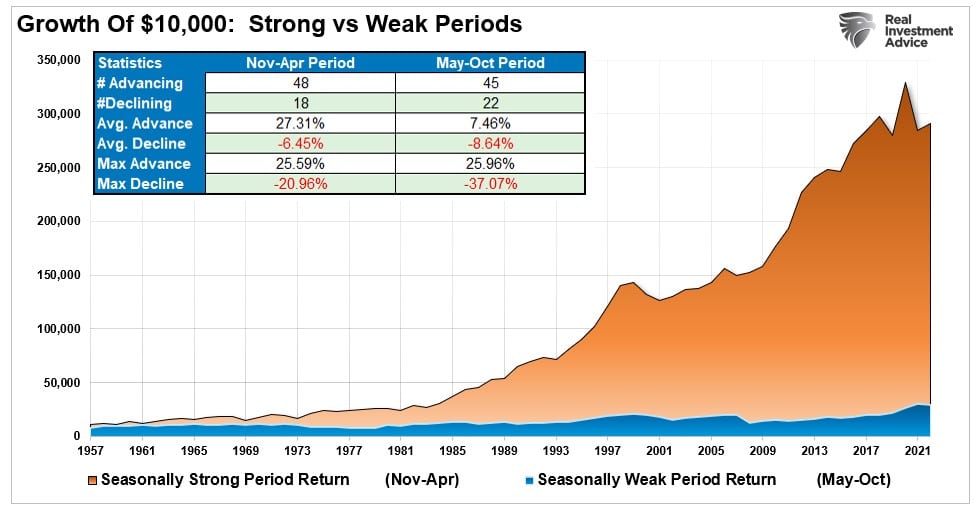
“Just as a reminder, the historical analysis suggests that the summer months of the market tend to be the weakest of the year. The mathematical statistics prove this as $10,000 invested in the market from November to April vastly outperformed the same amount invested from May through October. Interestingly, the max drawdowns are significantly larger during the ‘Sell In May’ periods. Previous important dates of major market declines occurred in October 1929, 1987, and 2008.”
Notably, the bullish price action this past week triggered our “seasonal MACD buy signal,” as shown. While such does NOT mean the market will go to new all-time highs, it suggests we are moving back into “buying dips” rather than “selling rallies.”
With the “buy signal” in deeper oversold territory, such provides the fuel needed for a rally into November as stock buybacks begin at the end of October. Notably, with the rather large short position in equities built up over the last few months, a reversal of the summer weakness will lead to short-covering by portfolio managers, adding further impetus to the advance.

While nothing is guaranteed, the odds of a rally from current levels are decently higher unless “something unexpected” happens.
Now, let’s talk about bonds.
Busting A Myth
Recently, there has been a lot of commentary about bonds, given the rise in rates. While bonds have certainly faced a historically significant drawdown over the past 3-years, much of the recent analysis suggests that yields can only go higher. The reason, they claim, is the surging debts and deficits, which are causing a lapse of buyers for the U.S. debt. To wit:
“The exact cause of the latest run-up in Treasury rates is hard to pinpoint. Many economists say a combination of drivers is probably helping to drive the pop — including strong growth, fewer foreign buyers of America’s debt, and concerns about debt sustainability in and of itself.” – NYT
Let’s break those arguments down.
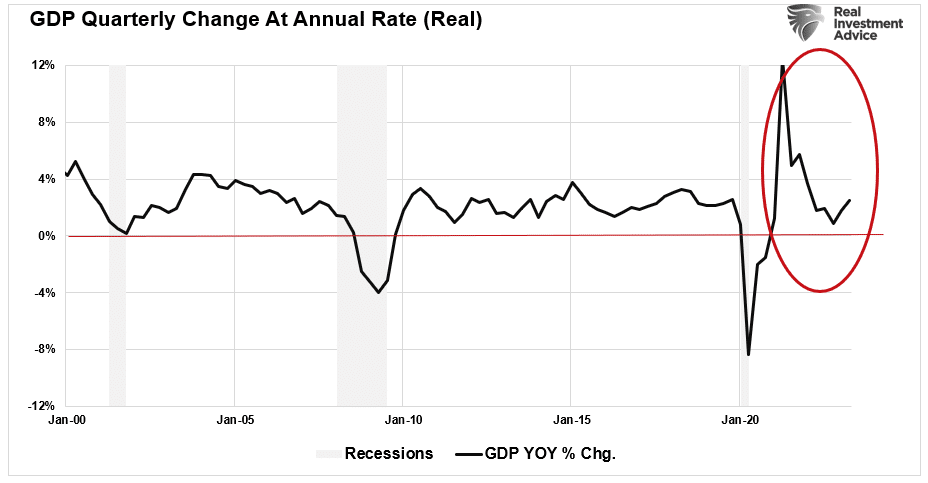
First, economic growth isn’t strong and is rapidly returning to its long-term growth trend below 2%.
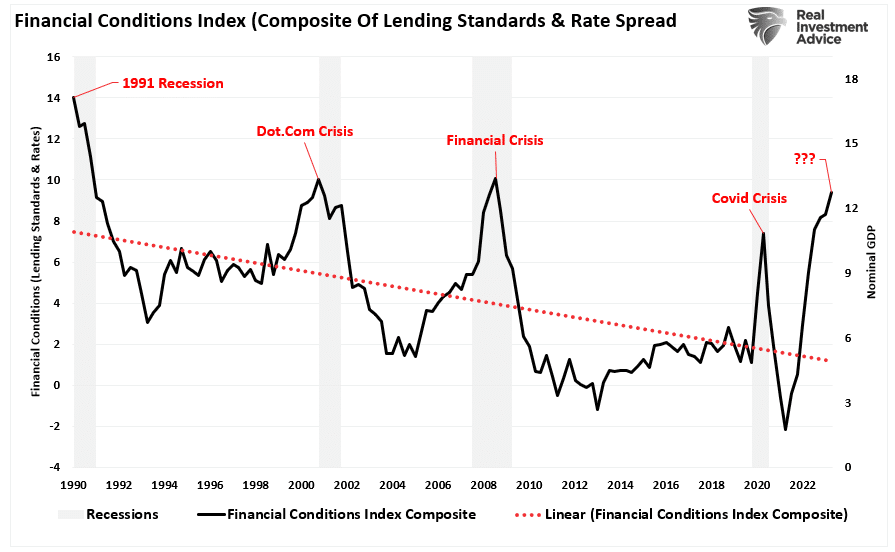
Furthermore, with interest rates elevated and financial conditions tight, the economy will likely approach a recession next year.
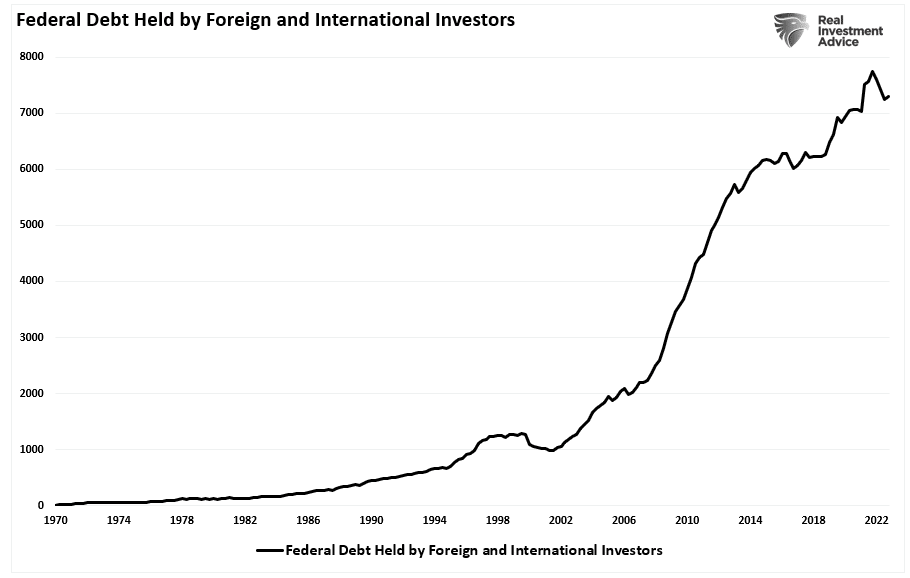
The second myth is that there are fewer foreign buyers of our debt. As we noted in the Daily Market Commentary this week:
“There is also a false narrative about foreign Governments selling U.S. Treasuries as ‘they don’t want our debt.’ As shown, such is clearly not the case. We would be remiss if we didn’t discuss how much they own. Japan and China hold about $1.1 trillion and $800 billion of U.S. Treasuries. While that may seem significant, they pale compared to the largest holder of Treasuries, the Federal Reserve. The Fed owns about $8 trillion. Even if China or Japan were to sell aggressively, the Fed could easily step in and absorb their selling pressure.
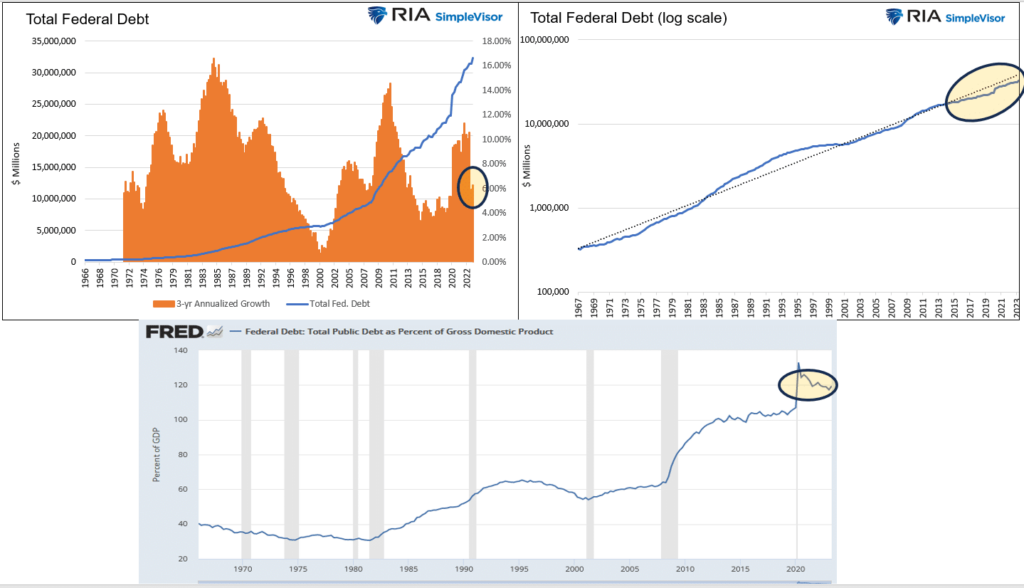
Lastly, the concerns over debt issuance are also falsely misplaced. Consider the following comments we found on Twitter:
- This politician (Yellen) knows yields are ripping because of the debt she’s issuing. Yields are no longer moving up because of the FED. And they’re moving up because of debt issuance & foreign countries are selling.
- Soaring yields, partially driven by insatiable debt issuance by the US Treasury, are tightening conditions so fast.
“Such stories are far from the truth when looked at from the right perspective. Consider the graphs below. The top left graph shows federal debt is growing slightly faster than the pre-pandemic years but well below prior surges. The right chart puts debt growth on a log scale to show the current growth rate is actually slightly below the trend of the last fifty years. A high debt-to-GDP ratio, as we have, is very problematic. But false narratives claiming recent issuance is well above average are flat-out wrong.” – Michael Lebowitz
As we saw with the conflict this past week, bonds remain a place of “safety” in times of turmoil. While the U.S. is imperfect, the U.S. Treasury remains the asset of choice when storing reserves and needing a “risk-free” investment.
When investing, it is always critical to separate fact from fiction.
How We Are Trading It
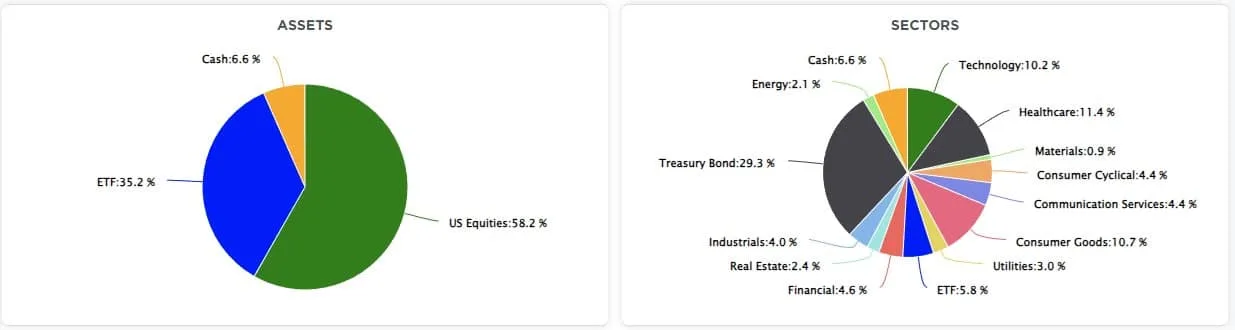
Over the last two months, we discussed using the typical summer weakness to add to our equity exposures. We are positioned comfortably with portfolios now almost fully allocated to target weightings. However, we are still managing risk as needed and making “tweaks” to holdings to move our sector weightings closer to our benchmark index.
Therefore, we must continue to follow the investment rules practiced by the greatest investors in history.
- Cut Losers Short And Let Winners Run.
- Investing Without Specific End Goals Is A Big Mistake.
- Emotional And Cognitive Biases Are Not Part Of The Process.
- Follow The Trend.
- Don’t Turn A Profit Into A Loss.
- Odds Of Success Improve Greatly When Technical Analysis Supports Fundamental Analysis.
- Try To Avoid Adding To Losing Positions.
- In Bull Markets, You Should Be “Long.” In Bear Markets – “Neutral” Or “Short.”
- Invest First with Risk in Mind, Not Returns.
- The Goal Of Portfolio Management Is A 70% Success Rate.
There are plenty of reasons to be very concerned about the market over the next few months, particularly with a conflict brewing. However, markets can often defy logic in the short term despite the apparent weight of evidence to the contrary.
Continue to follow these rules and adjust as needed relative to the direction and trend of the market. While this week’s conflict was cause for concern, adhering to the investment rules can keep you grounded during increased volatility. Periods like this are never fun, but the market never goes straight up or down. Use reflexive rallies to rebalance your risk as needed.
See you next week.
Research Report

Subscribe To “Before The Bell” For Daily Trading Updates
We have set up a separate channel JUST for our short daily market updates. Please subscribe to THIS CHANNEL to receive daily notifications before the market opens.
Click Here And Then Click The SUBSCRIBE Button
Subscribe To Our YouTube Channel To Get Notified Of All Our Videos
Bull Bear Report Market Statistics & Screens

SimpleVisor Top & Bottom Performers By Sector

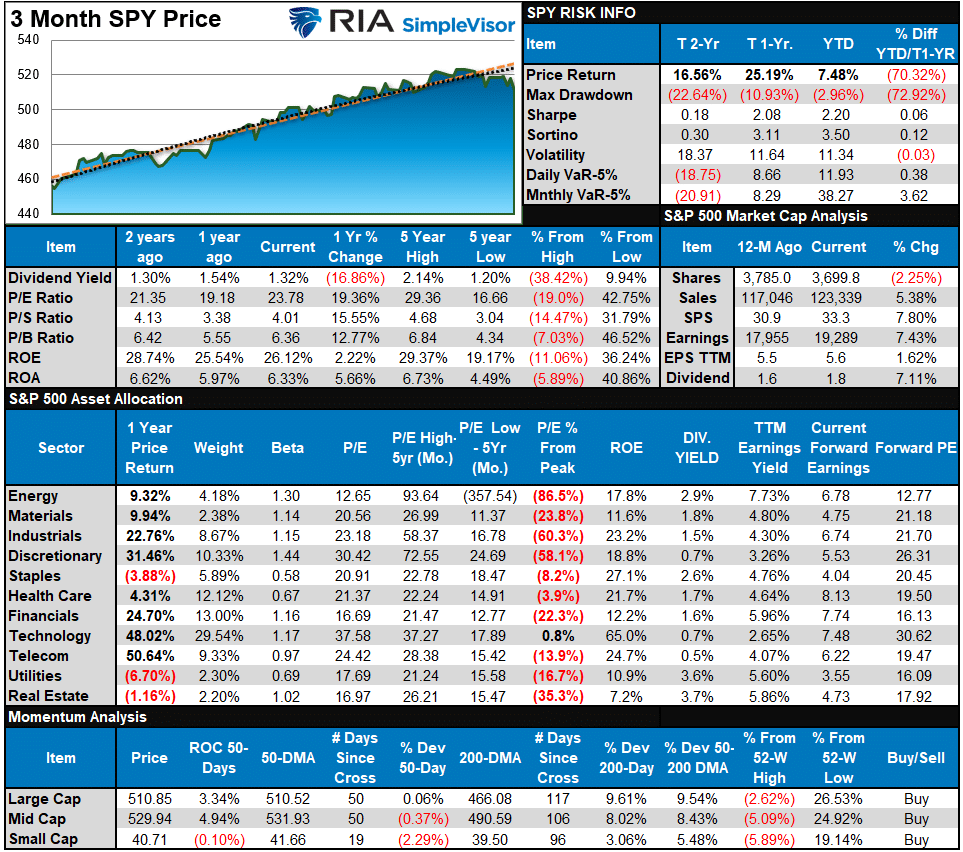
S&P 500 Weekly Tear Sheet
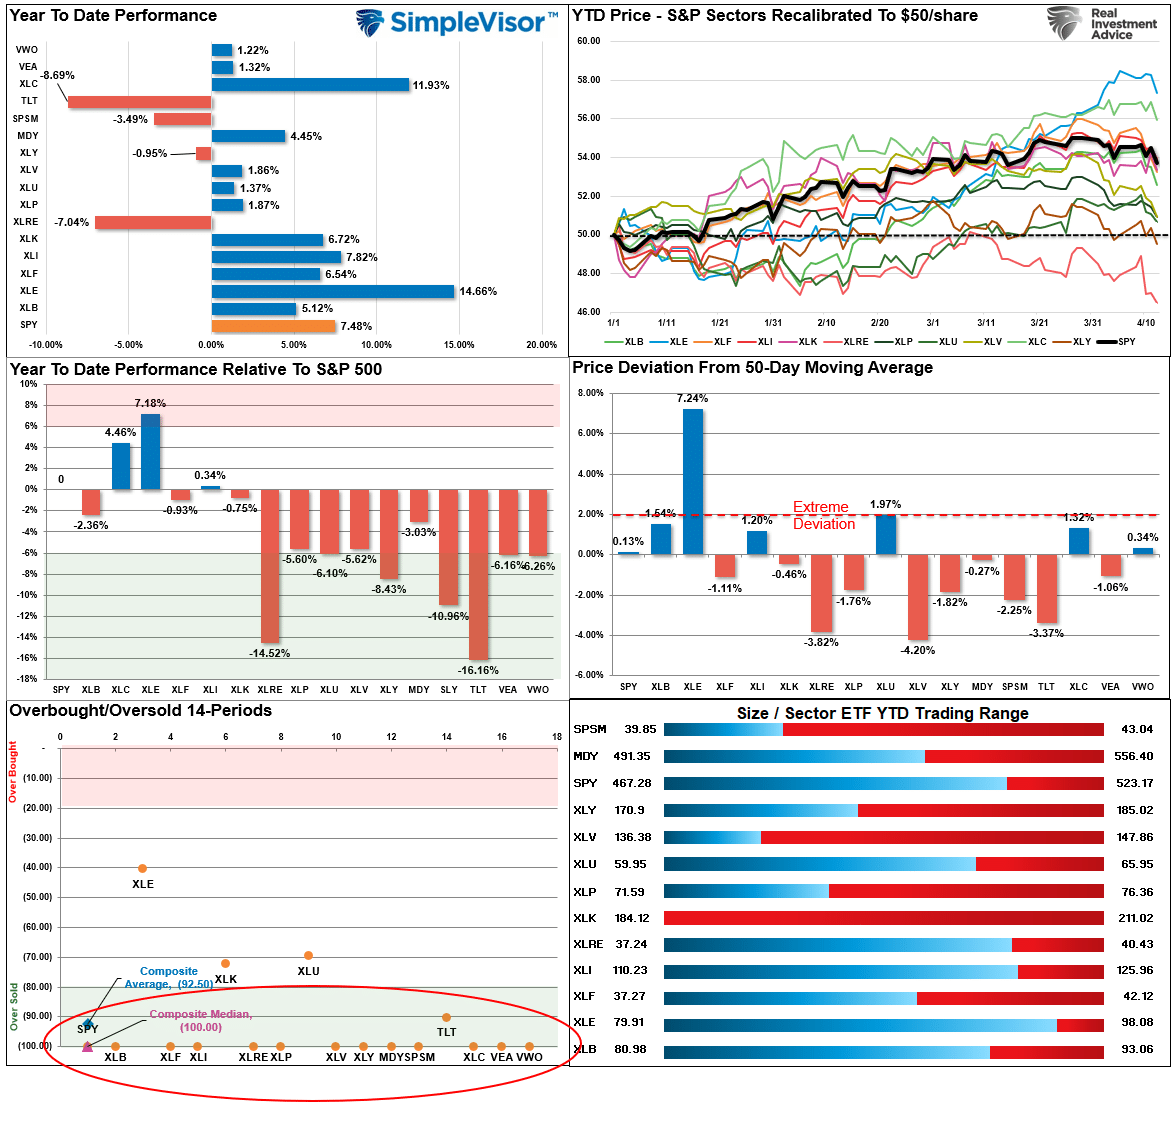
Relative Performance Analysis
Last week, we noted;
“On Friday, it looked like the bounce started to manifest itself after tough price action early in the week. Technology is leading the rebound and is moving into more overbought territory, with Bonds remaining deeply oversold along with Staples. Most other sectors and markets remain oversold, so that we could see additional moves higher this coming week.”
The rally in stocks and bonds did come in strong early last week and took markets to initial resistance. The fade on Thursday and Friday pulled markets back to support at the 20-DMA. With most markets and sectors not overbought yet and earnings season starting in earnest this week, we could see another attempt at overhead resistance.
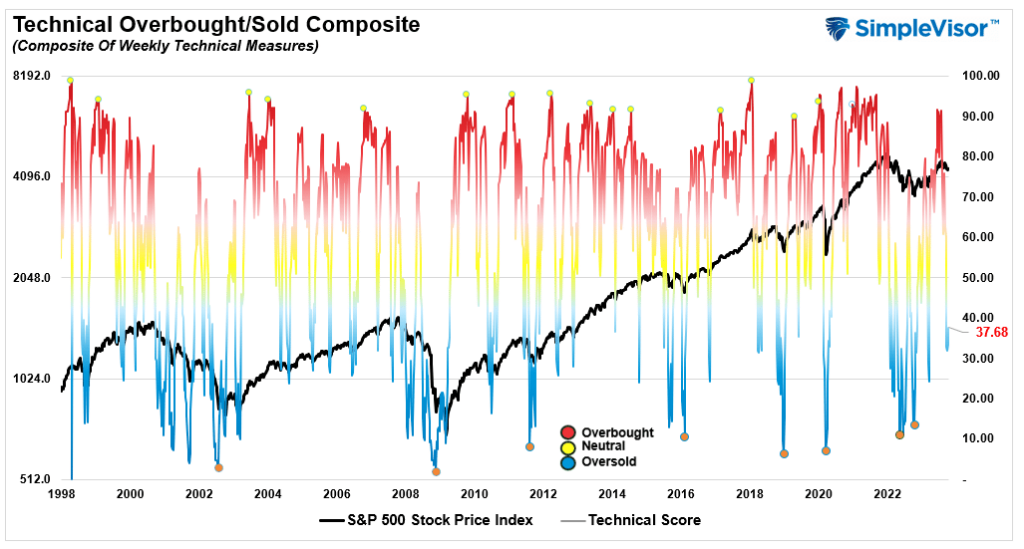
Technical Composite
The technical overbought/sold gauge comprises several price indicators (R.S.I., Williams %R, etc.), measured using “weekly” closing price data. Readings above “80” are considered overbought, and below “20” are oversold. The market peaks when those readings are 80 or above, suggesting prudent profit-taking and risk management. The best buying opportunities exist when those readings are 20 or below.
The current reading is 37.68 out of a possible 100.
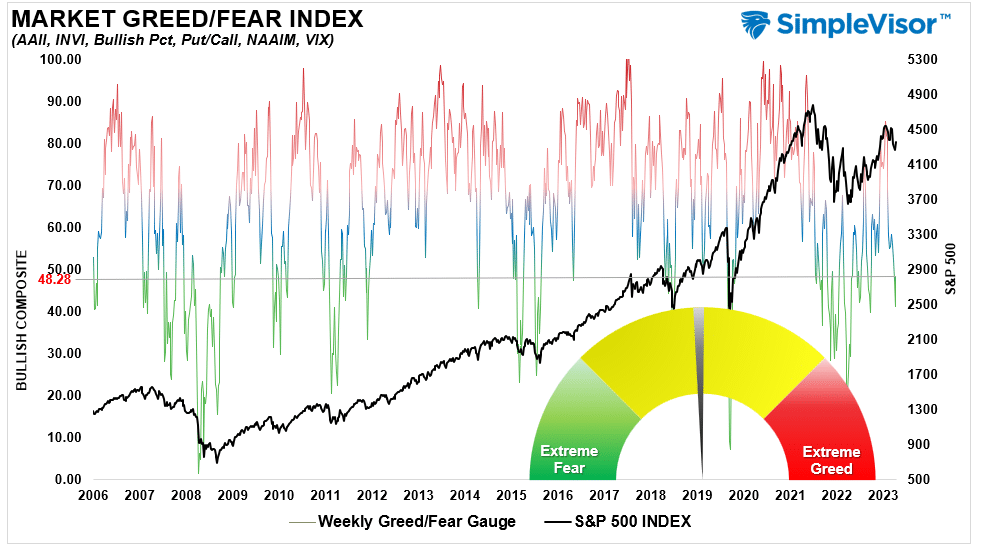
Portfolio Positioning “Fear / Greed” Gauge
The “Fear/Greed” gauge is how individual and professional investors are “positioning” themselves in the market based on their equity exposure. From a contrarian position, the higher the allocation to equities, the more likely the market is closer to a correction than not. The gauge uses weekly closing data.
NOTE: The Fear/Greed Index measures risk from 0 to 100. It is a rarity that it reaches levels above 90. The current reading is 48.28 out of a possible 100.
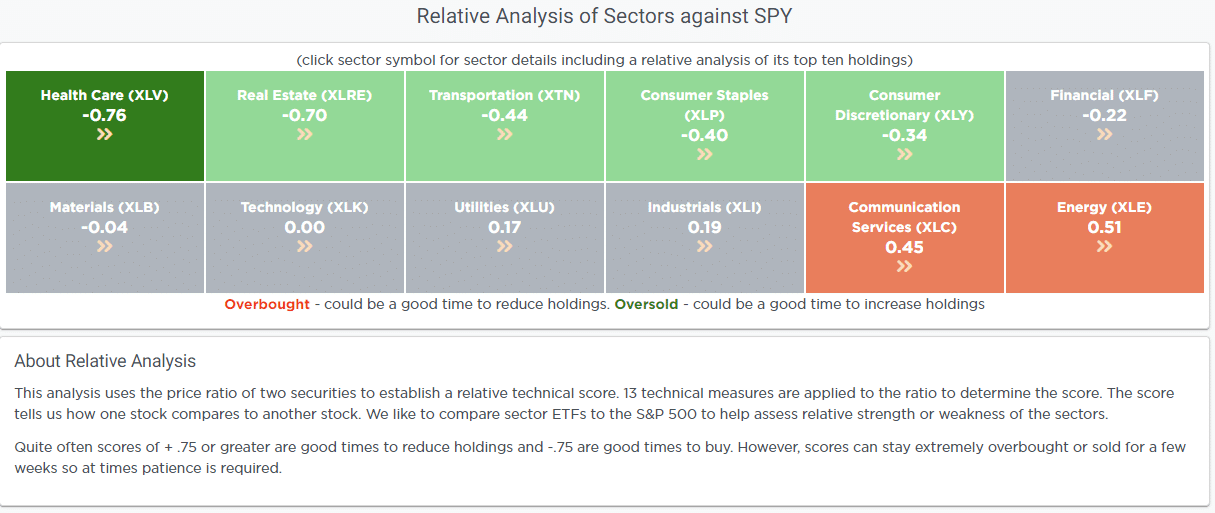
Relative Sector Analysis
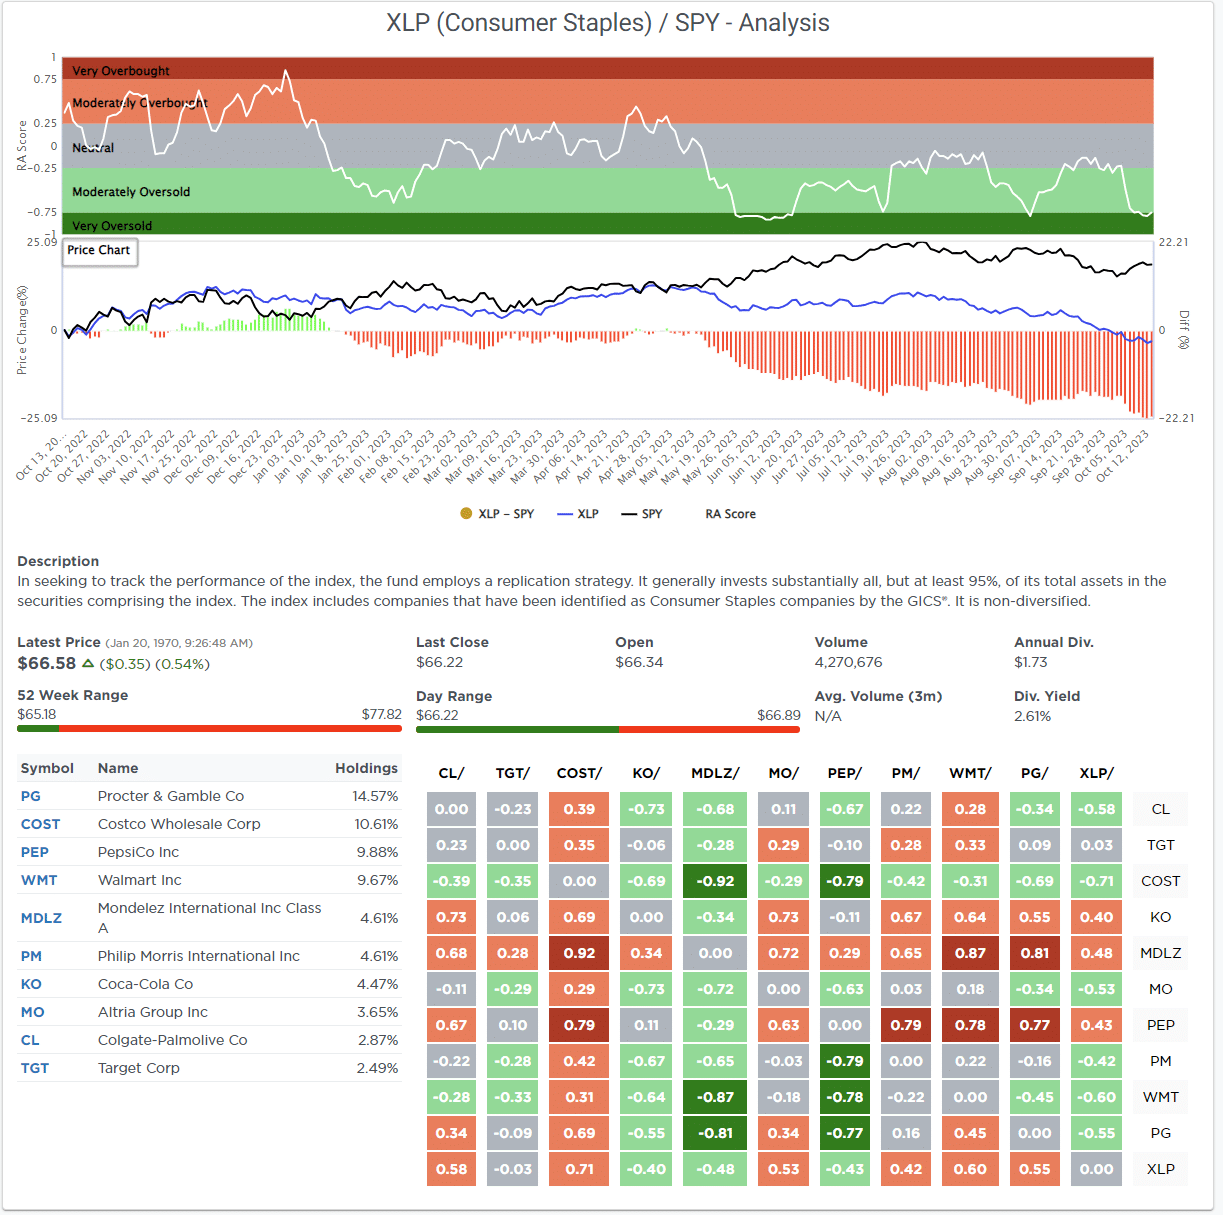
Most Oversold Sector Analysis
Sector Model Analysis & Risk Ranges
How To Read This Table
- The table compares the relative performance of each sector and market to the S&P 500 index.
- “MA XVER” (Moving Average Crossover) is determined by the short-term weekly moving average crossing positively or negatively with the long-term weekly moving average.
- The risk range is a function of the month-end closing price and the “beta” of the sector or market. (Ranges reset on the 1st of each month)
- The table shows the price deviation above and below the weekly moving averages.
The rally early last week relieved the deeply oversold conditions on a risk/reward basis. Only Gold and Gold Miners remain oversold on their monthly ranges. Everything remains within normal monthly tolerances for now, so some additional upside in the markets next week is likely.

Weekly SimpleVisor Stock Screens
We provide three stock screens each week from SimpleVisor.
This week, we are searching for the Top 20:
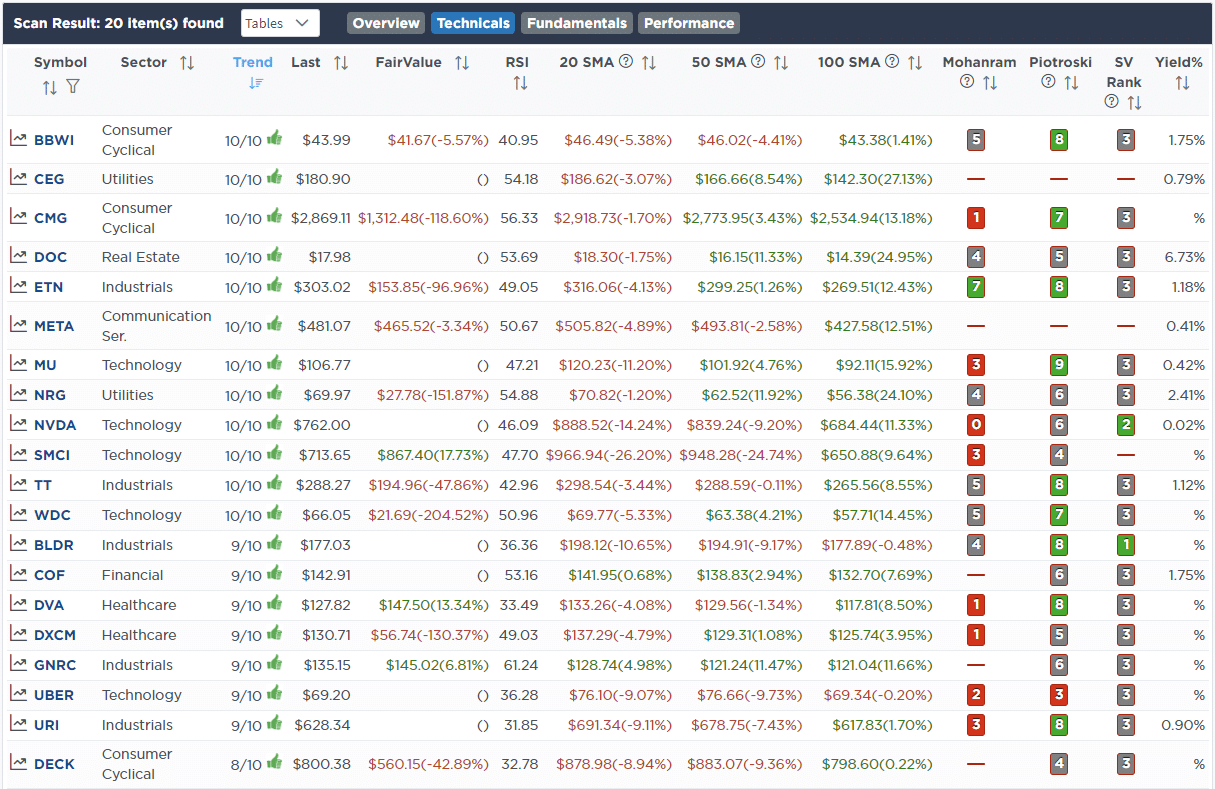
- Relative Strength Stocks
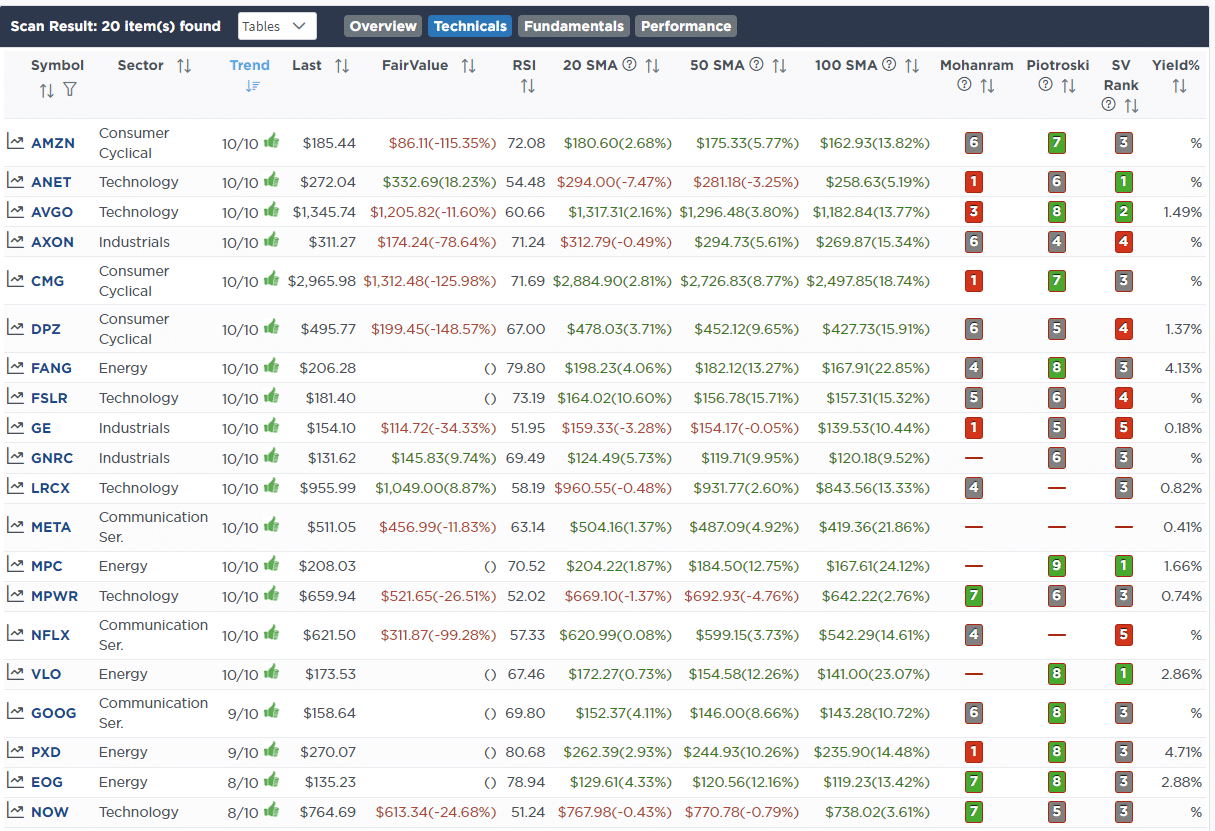
- Momentum Stocks
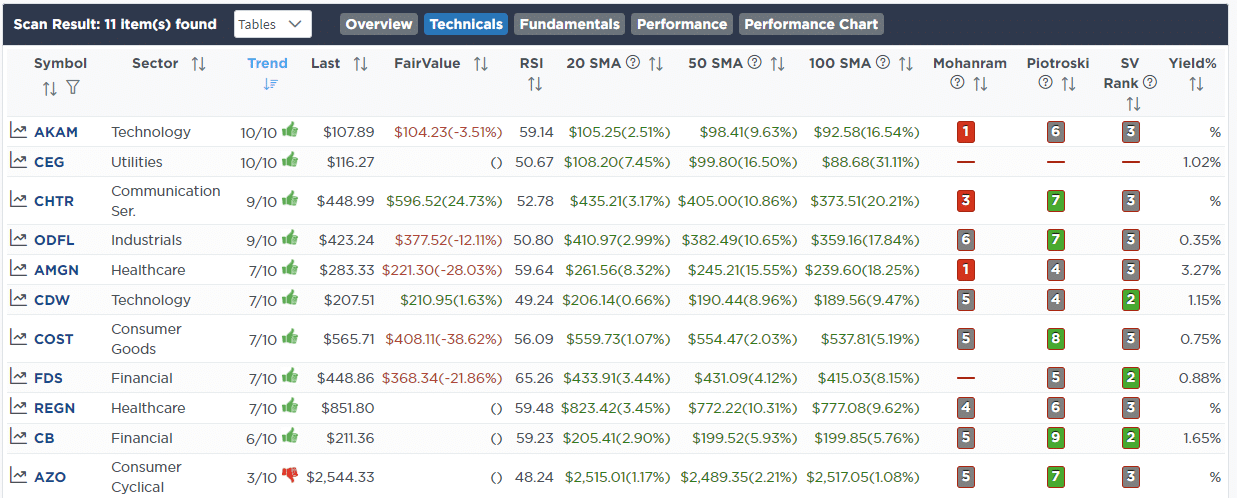
- Fundamental & Technical Strength
(Click Images To Enlarge)
R.S.I. Screen
Momentum Screen
Fundamental & Technical Strength
SimpleVisor Portfolio Changes
We post all of our portfolio changes as they occur at SimpleVisor:
October 9th
This morning, we reduced Costco (COST) by 1% and the iShares Staples ETF (XLP) by 2%. This morning’s Commentary started with a piece on the new obesity drug Ozempic. As we wrote: “Unfortunately for Coke, Pepsi, Mcdonald’s, and other companies, users claim they eat less food. Walmart confirmed initial reactions, saying its customers taking Ozempic and other appetite-suppressing drugs are purchasing less food.“
COST shares have started slipping with other food purveyors as investors worry about the effect of the obesity drugs on their sales. Whether the drugs will meaningfully affect sales or not, the market seems bent on pricing with negative consequences. We have owned COST shares for a long time, and this reduction in weighting is temporary until the market figures out the implications of these drugs. We are already looking to increase our weighting in COST in the future.
Equity Model
- Reduce COST to 2% of the Portfolio.
ETF Model
- Reduce XLP from 9% to 7% of the Portfolio.
October 12th
This morning, we added 1% to XOM, bringing it back up to 3%. We also added 1% to XLE in the sector model. We had sold both a few weeks ago as they were significantly overbought. Both have fallen decently since then, along with oil prices. The purchase of Pioneer pushed Exxon down almost 5% yesterday. The deal is dilutive to Exxon shareholders but is expected to provide significant synergies and provide Exxon with dominance in the Permian Basin. The Permian Basin has some of America’s cheapest oil to drill.
Equity Model
- Increase Exxon Mobil (XOM) to 3% of the Portfolio.
ETF Model
- Increase the iShares Energy ETF (XLE) to 3% of the Portfolio.

Lance Roberts, C.I.O.
Have a great week!

