
Inside This Week’s Bull Bear Report
- The Correction Continues
- Forward Earnings Remain At Risk
- How We Are Trading It
- Research Report – Bullish Investors Continue To Fight The Fed
- Youtube – Before The Bell
- Stock Of The Week
- Daily Commentary Bits
- Market Statistics
- Stock Screens
- Portfolio Trades This Week
The Correction Begins
We discussed in last week’s message that the recession countdown started, and if that is the case, forward earnings remain at risk. Such has implications for investors as valuations remain elevated.
Last week, we worried about a break of support.
“Critical support at the rising trend line from the October lows and the 200-DMA is now getting tested. A failure of those levels next week will put the bears back in charge of the market near term.”
Fortunately, the bulls stepped in to rally the markets off that 200-DMA support, keeping the rising trend intact. However, the rally is now challenging existing resistance at the 20-DMA, but the previous highs around 4200 are the most logical target currently. Importantly the MACD “sell signal,” which warned of the recent correction, is beginning to reverse. However, that reversal occurs midway through regular oscillation, suggesting that the upside is somewhat limited.
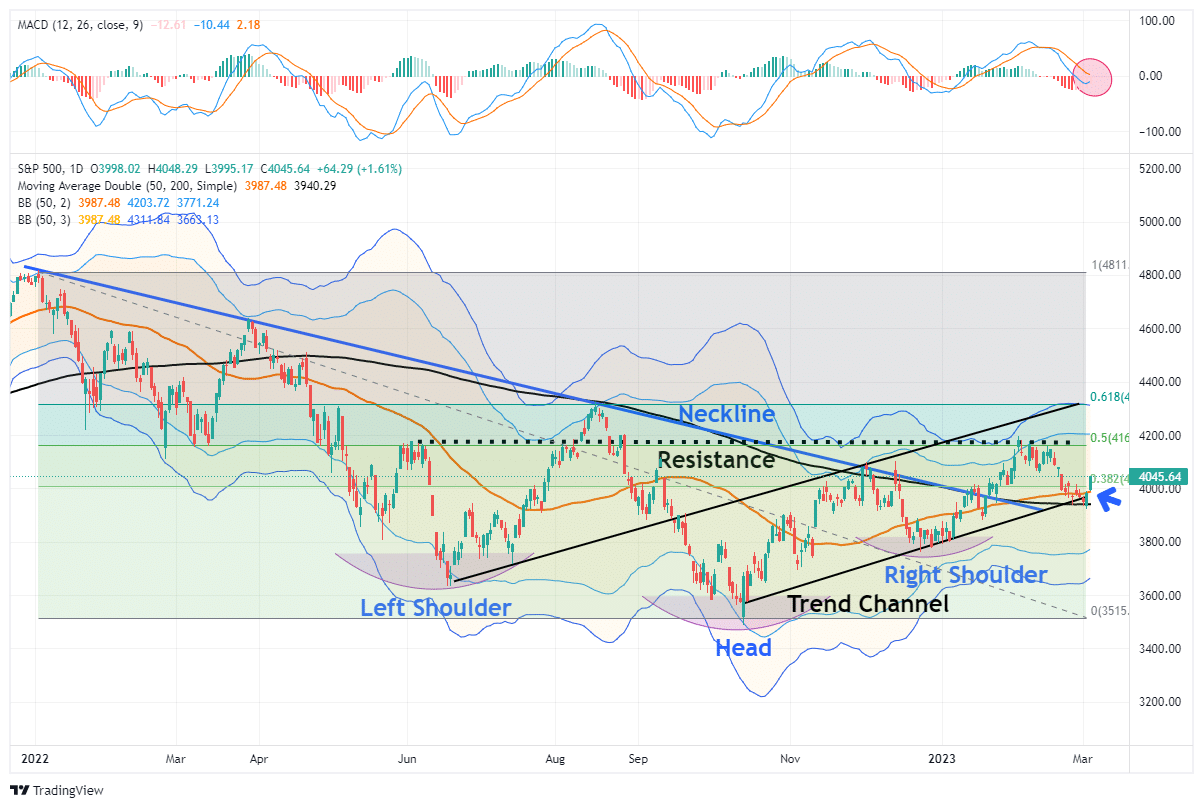
While the MACD signal starts to turn, it can fail when our MoneyFlow indicator does not confirm the turn. Such is the case currently, but next week’s action will provide a more definitive outlook. The MoneyFlow indicator is near its cycle lows, similar to what we saw when the MACD turned positive at the December lows.

As such, we recommend selling any rally next week approaching the 4200, which is now essential resistance.
Notably, the market remains confined to a rising trend channel, so we must respect that price action until it changes. That channel suggests the markets could rally as high as 4350 over the coming months, which remains in line with the seasonally strong period. However, if that channel is broken, there is roughly an equal amount of downside. In other words, the reward versus the risk from current levels is not great.
While the actions and commentary by the Federal Reserve have remained a primary driver for the ebb and flow of the market over the last year, companies’ underlying fundamentals and profitability will ultimately matter most.
That is the subject of this week’s message.
Need Help With Your Investing Strategy?
Are you looking for complete financial, insurance, and estate planning? Need a risk-managed portfolio management strategy to grow and protect your savings? Whatever your needs are, we are here to help.

Forward Earnings Remain At Risk
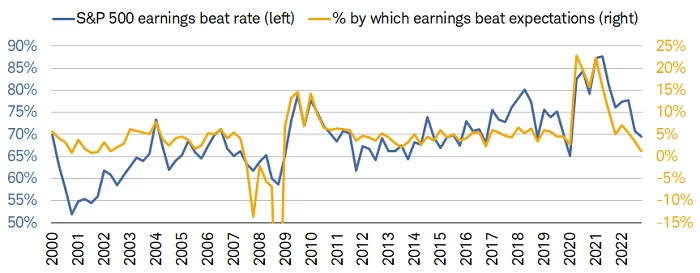
With the fourth quarter earnings season mostly complete, we are getting a better look at trailing and forward earnings estimates. According to FactSet, 94% of S&P 500 companies have reported numbers, with 68% beating estimates. That “beat rate” was primarily a function of the rapid cuts to estimates since June of last year. If analysts were held to their original estimates, roughly 100% of companies would have disappointed expectations.
This is why we call it “Millennial Earnings Season.” Wall Street continuously lowers estimates as the reporting period approaches so “everyone gets a trophy.” An easy way to see this is the number of companies beating estimates each quarter, regardless of economic and financial conditions. Since 2000, roughly 70% of companies regularly beat estimates by 5%. Again, that number would be lower if analysts were held to their original estimates.
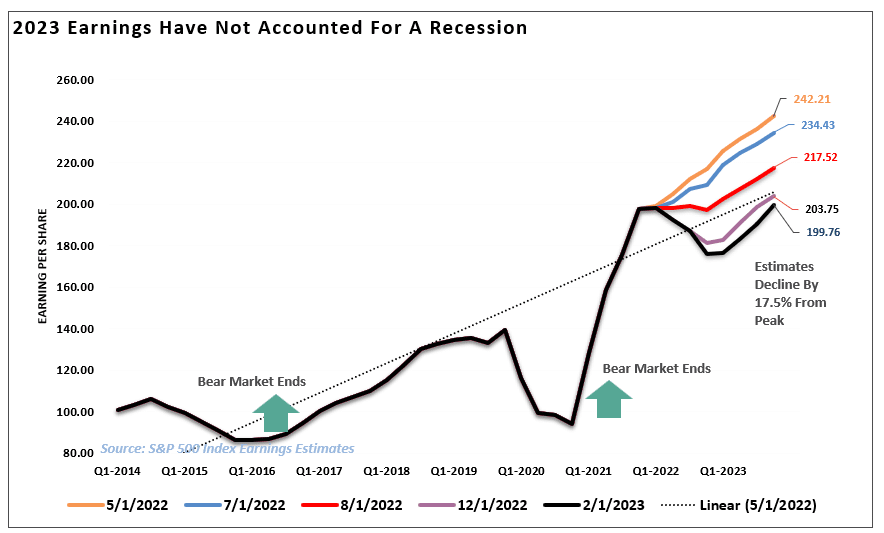
Analysts remain optimistic about earnings even with economic growth weakening as inflation increases, reduced liquidity, and declining profit margins. As shown above, analysts expect the first quarter of 2023 will mark the bottom for the earnings decline, and growth will accelerate into year-end. Again, this is despite the Fed continuing to hike interest rates specifically to slow economic growth.
The problem with these expectations is the detachment of earnings estimates above the long-term growth trend.
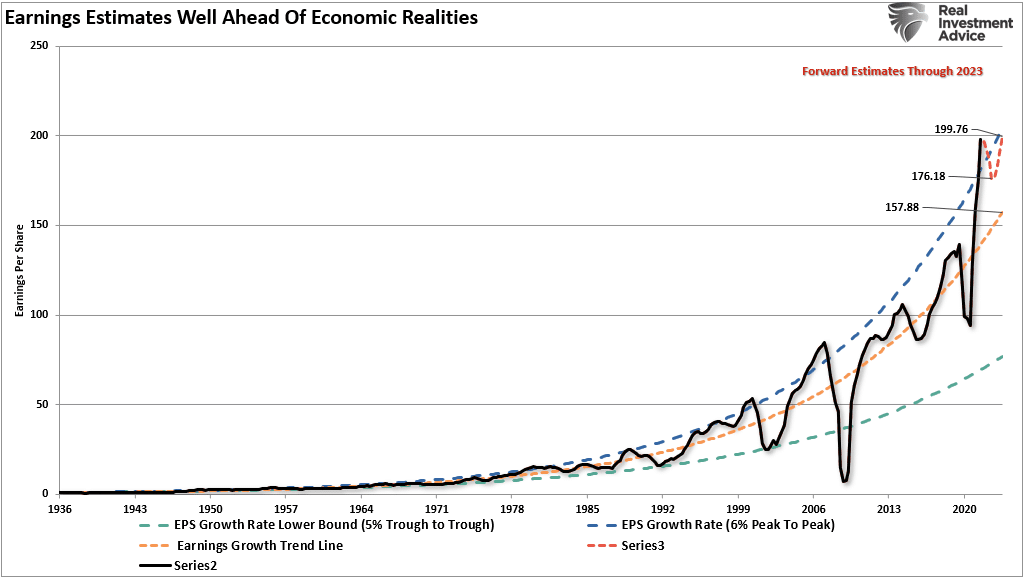
That deviation from the long-term growth trend is shown more clearly in the following chart. The only two previous periods with similar deviations are the “Financial Crisis” and the “Dot.com” bubble.
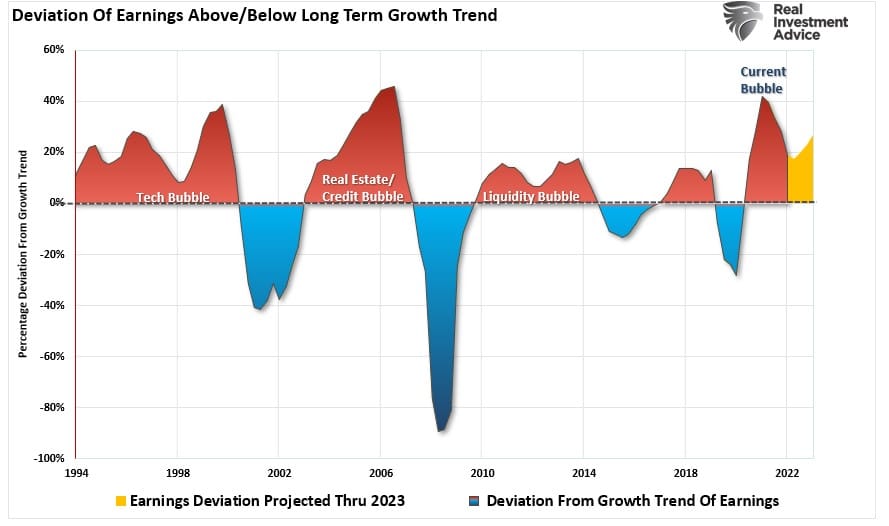
Given that earnings are the byproduct of economic growth, the sustainability of record-high earnings and corporate profit margins is problematic. As we discussed in “Capitalism Is Broken:”
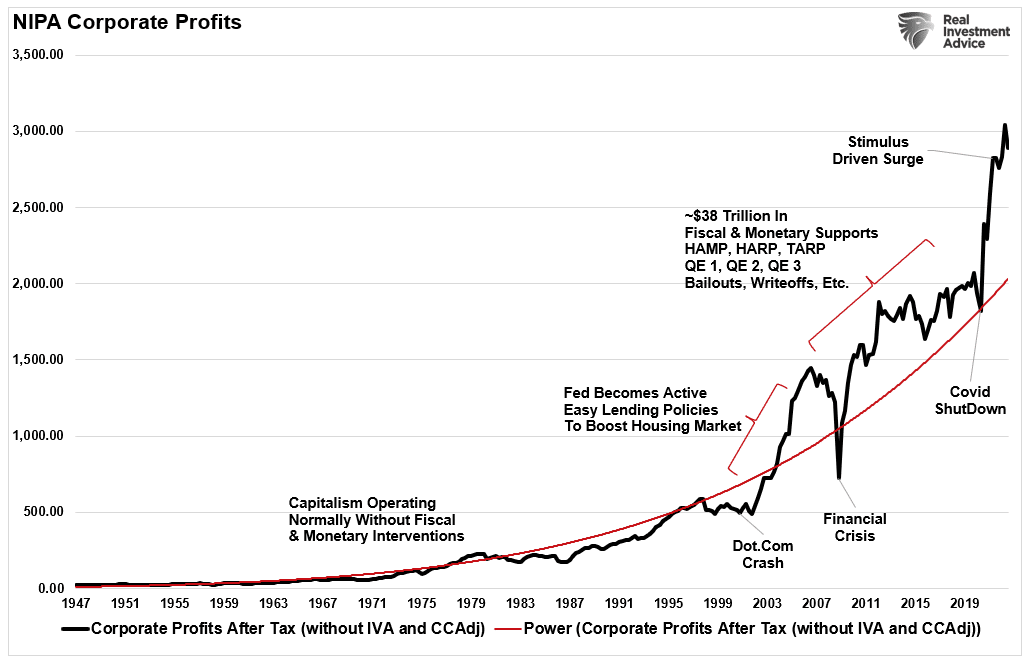
“With the economy shut down and an inorganic surge in demand due to “free money,” the selling prices of a restricted supply of goods rose. The basic economic function of supply and demand proves capitalism is functioning properly. Furthermore, as shown, corporate profits surged with labor costs greatly reduced due to the shutdown and higher prices due to artificially stimulated demand.”
The Reversion To The Mean
So, what happens next, assuming the combination of a shuttered economy, no supply, and massive rounds of fiscal stimulus fostered the surge in corporate earnings and profits?
Over the next few years, the environment will look different than in the past.
- The economy is returning to a slow growth environment with a risk of recession.
- Inflation is falling, meaning less pricing power for corporations.
- No artificial stimulus to support demand.
- Over the last two years, the pull forward of consumption will now drag on future demand.
- Interest rates are substantially higher, impacting consumption.
- Consumers have sharply reduced savings and higher debt.
- Previous inventory droughts are now surpluses.
Notably, this reversion of activity will become exacerbated by the “void” created by pulling forward consumption from future years.
“We have previously noted an inherent problem with ongoing monetary interventions. Notably, the fiscal policies implemented post the pandemic-driven economic shutdown created a surge in demand and unprecedented corporate earnings.”
As shown below, the surge in the M2 money supply is now over. Without further stimulus, earnings will revert to economically sustainable levels.
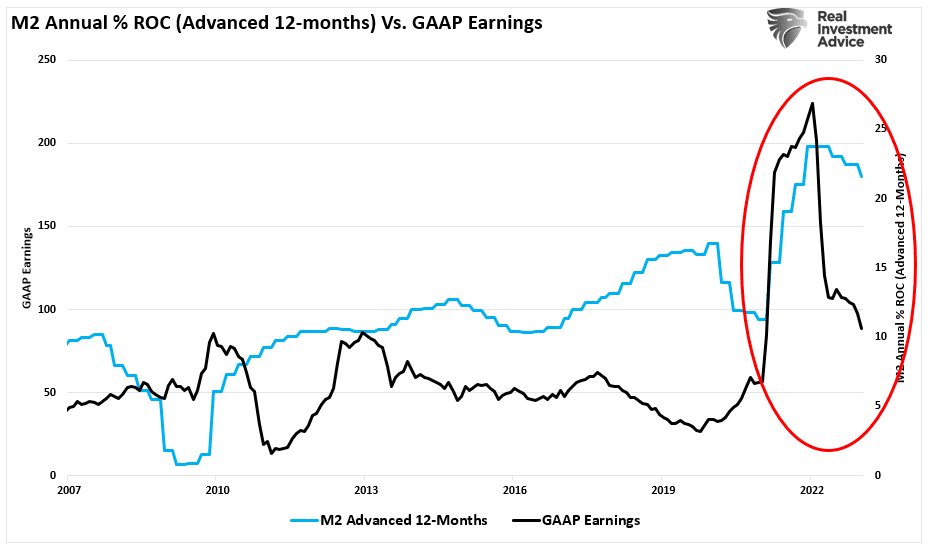
While the media often states that “stocks are not the economy,” economic activity creates corporate revenues and earnings. As such, stocks can not grow faster than the economy over long periods.
The Growth Factor
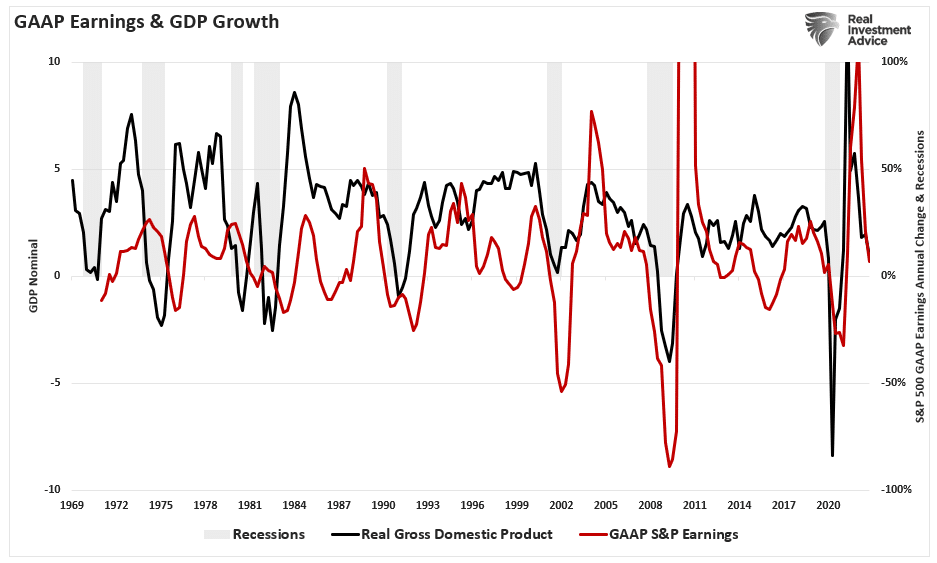
When stocks deviate from the underlying economy, the resolution is lower stock prices. Over time, there is a close relationship between the economy, earnings, and asset prices. The chart below compares the three from 1947 through 2021.

Since 1947, earnings per share have grown at 7.72%, while the economy has expanded by 6.35% annually. That close relationship in growth rates is logical, given the significant role that consumer spending has in the GDP equation.
The slight differentials are due to periods where earnings can grow faster than the economy. Such periods occur when the economy is emerging from a recession. However, while nominal stock prices averaged 9.35% (including dividends), reversions to underlying economic growth will eventually occur. Such is because corporate earnings are a function of consumptive spending, corporate investments, imports, and exports.
This is important to investors due to the coming impact on “valuations.”
Valuations Remain A Risk
The problem with forward earnings should be obvious. Given that forward earnings estimates are almost always wrong, such means that investors overpay for investments. As should be obvious, overpaying for an investment today leads to lower future returns.
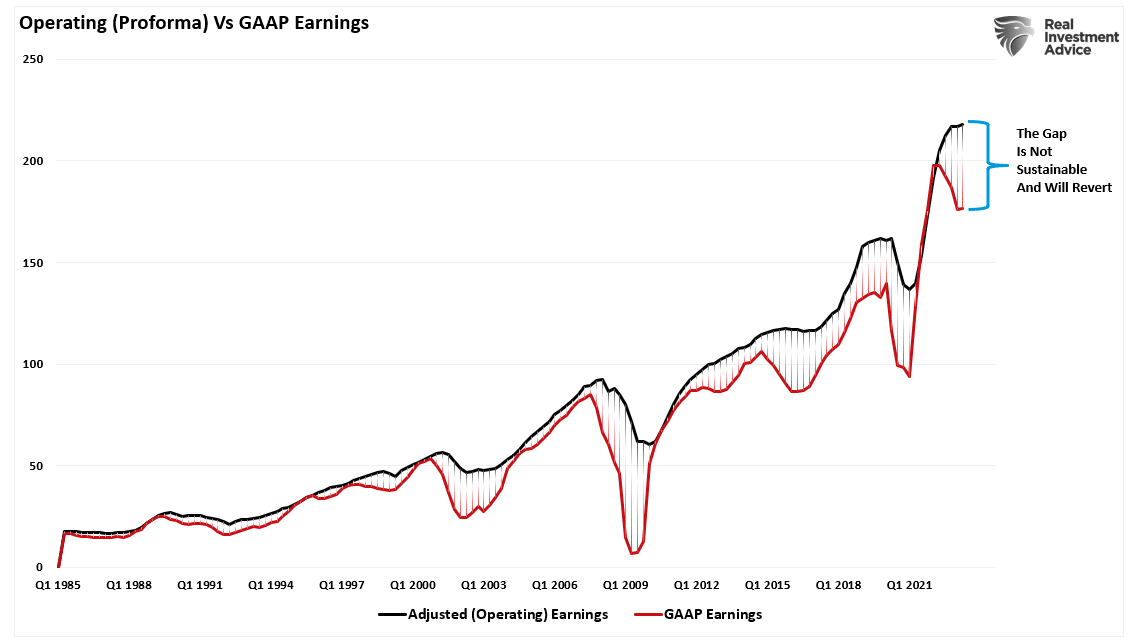
Even with the decline in earnings from the peak, valuations remain historically expensive on both a trailing and forward basis. (Notice the significant divergences in valuations during recessionary periods as adjusted earnings do NOT reflect what is occurring with actual earnings.)
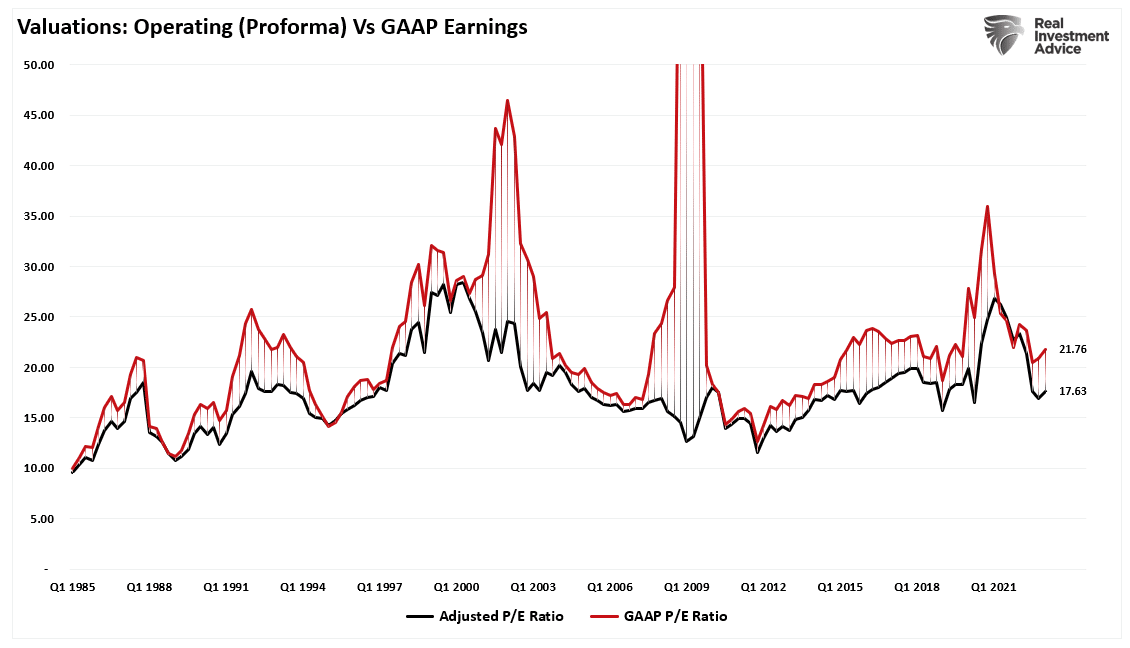
Most companies report “operating” earnings which obfuscate profitability by excluding all the “bad stuff.” A significant divergence exists between operating (or adjusted) and GAAP earnings. When a variation of that magnitude occurs, you must question the “quality” of earnings.
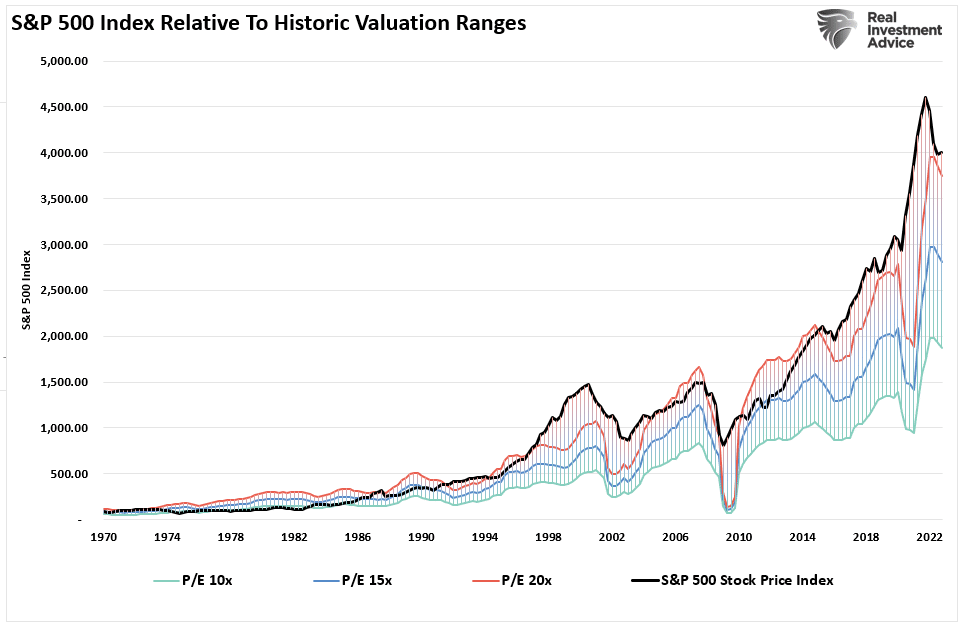
The chart below uses GAAP earnings. If we assume current earnings are correct, then such leaves the market trading above 21x earnings. (That valuation level remains near previous bull market peak valuations.)
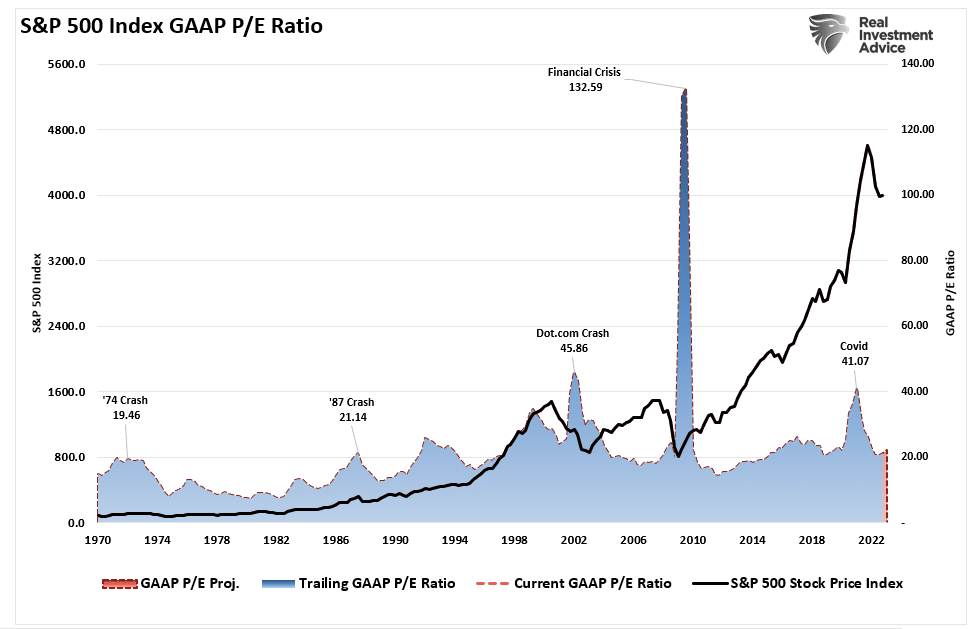
Since markets are already trading well above historical valuation ranges, such suggests that outcomes will likely not be as “bullish” as many currently expect.
Trojan Horses
The hope, as always, is that earnings will rise to justify the market’s overvaluation. However, when earnings are rising, so are the markets.
Most importantly, analysts have a long and sordid history of being overly bullish on expectations of growth which fall well short. Such is particularly the case today. Much of the economic and earnings growth was not organic. Instead, it was from the flood of stimulus into the economy, which is now evaporating.
Overpaying for assets has never worked out well for investors.
With the Federal Reserve intent on slowing economic growth to quell inflation, it is only logical earnings will decline. Prices must accommodate lower earnings by reducing current valuation multiples if such is the case.
When it comes to analysts’ estimates, always remain wary of “Greeks bearing gifts.”
How We Are Trading It
The market correction we warned about at the beginning of February continued this past week. As noted above, the market is very oversold and due for a reflexive bounce. We remain underweight in stocks and bonds and overweight cash and short-term Treasuries. (The ETF allocation comprises short-duration Treasury bonds and floating rate Treasuries, with a lesser allocation to long-dated Treasuries. You can view our models in real-time at SimpleVisor.com)
There is little reason to chase risk, particularly ahead of the upcoming FOMC meeting later this month. We expect the Fed to hike interest rates by another 0.25%, but their language regarding further rate hikes will remain hawkish. The inflation data remains “sticky,” and the employment data, although lagging, remains too strong for the Fed to stop hiking rates.
That data has pushed market-based expectations to 5.5% for the terminal rate, and rate cuts are now getting pushed off into the latter part of this year. Such does not bode well for risk assets or economic growth.
We suggest using any rally over the next week to reduce equity risk, raise cash levels, and rebalance bond portfolios. The opportunity to increase equity risk will come, which could be much later this year.
While being cautious will likely underperform near term, reducing capital destruction allows for a quicker return to profitability.
Have a great week.
Research Report

Subscribe To “Before The Bell” For Daily Trading Updates (Formerly 3-Minutes)
We have set up a separate channel JUST for our short daily market updates. Be sure and subscribe to THIS CHANNEL to receive daily notifications before the market opens.
Click Here And Then Click The SUBSCRIBE Button
Subscribe To Our Youtube Channel To Get Notified Of All Our Videos
Stock Of The Week In Review
Typically, we screen for individual equities based on technical analysis or fundamental metrics. This week we switch things up by introducing a new aspect of our factor analysis process. We previously highlighted our factor performance monitoring tool in Factors for Success.
Our analysis today builds on that concept by first comparing excess returns of various factors to find pairs with strong negative correlations.
Let’s use our High Dividend Yield (VYM) and Mega-Cap Growth (MGK) factors as examples. Our analysis tells us there is a 252-day correlation in excess daily returns versus the S&P 500 of -94.7%. This relationship is illustrated by comparing the price ratios of the two factors to SPY over time, as shown below. The ratios are almost mirror images of each other- exemplifying the negative correlation in excess returns.
Here is a link to the full SimpleVisor Article For Step-By-Step Screening Instructions.
Login to Simplevisor.com to read the full 5-For-Friday report.
Daily Commentary Tidbits
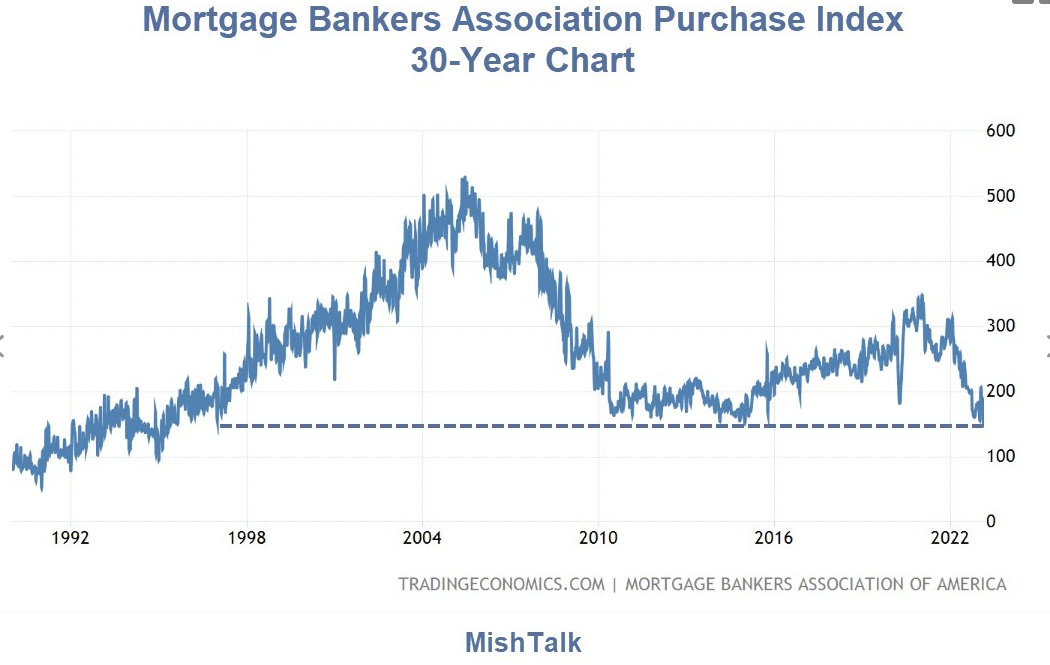
Home Purchase Index Drops To 25-Year Low
Wednesday’s Home Purchase Index fell sharply to the lowest level since 1995. The index compiled by the Mortgage Bankers Association (MBA) computes the number of home purchases based on a sample of approximately 75% activity. The combination of elevated home prices and mortgage rates approaching 7% keeps individuals from buying houses or even seeking out mortgage applications. The MBA mortgage application index is also near 28-year lows.
The most recent Case-Shiller Home Price Index has fallen but still stands almost 20% above trend. In addition to high prices, mortgage rates keep the affordability of homes out of range for many potential buyers. While the demand side of the housing market is troubling, owners aren’t selling. The supply of existing homes is under three months. Compare that to the relatively hot housing market in the five years pre-pandemic when the supply was never below three months! The chart below of the MBA home purchase index is courtesy of Mish Shedlock.
Click Here To Read The Latest Daily Market Commentary (Subscribe For Pre-Market Email)
Bull Bear Report Market Statistics & Screens

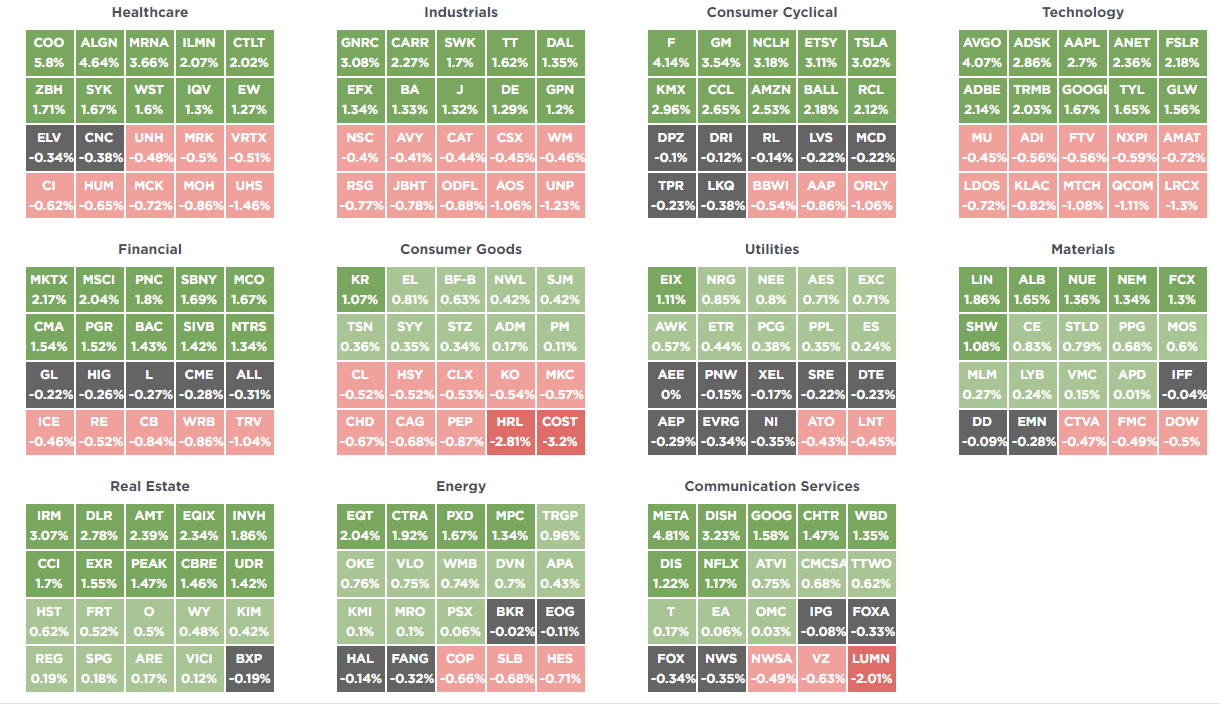
SimpleVisor Top & Bottom Performers By Sector
S&P 500 Weekly Tear Sheet
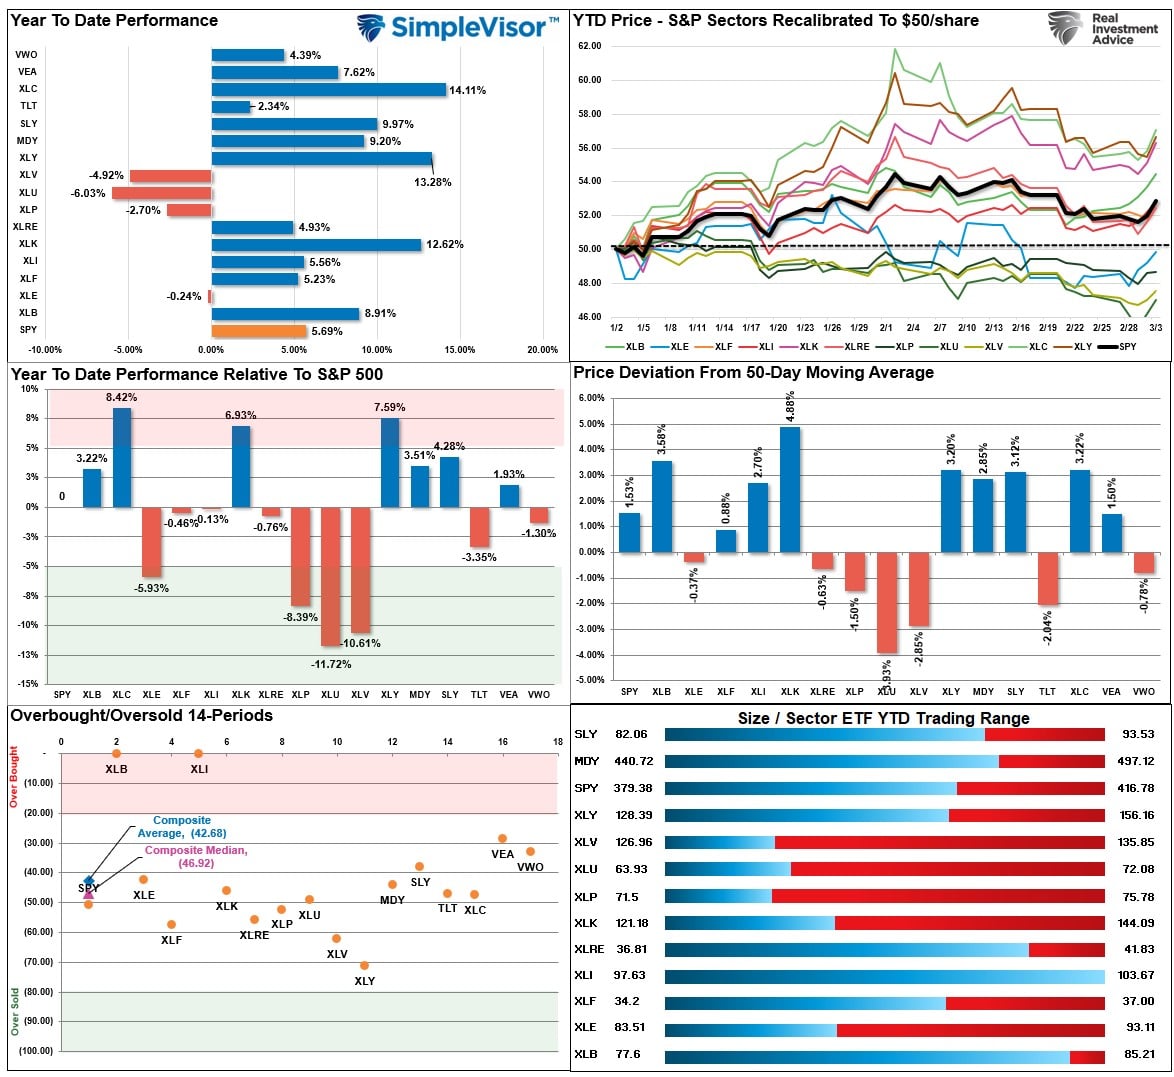
Relative Performance Analysis
Last week we said:
“We expect a reflexive rally in the market to begin next week. Such will be a tradeable rally to sell into as the market remains on a stronger sell signal. As such upside will likely be limited and short-lived. Remain cautious for now, but opportunities are beginning to present themselves.“
Such is what happened, and the current rally has room to run a bit more as most markets and sectors are not back to being overbought yet, with the exceptions of Basic Materials and Industrials. Look for the rally to continue this week, but use that rally to reduce risk as needed and rebalance portfolios accordingly.
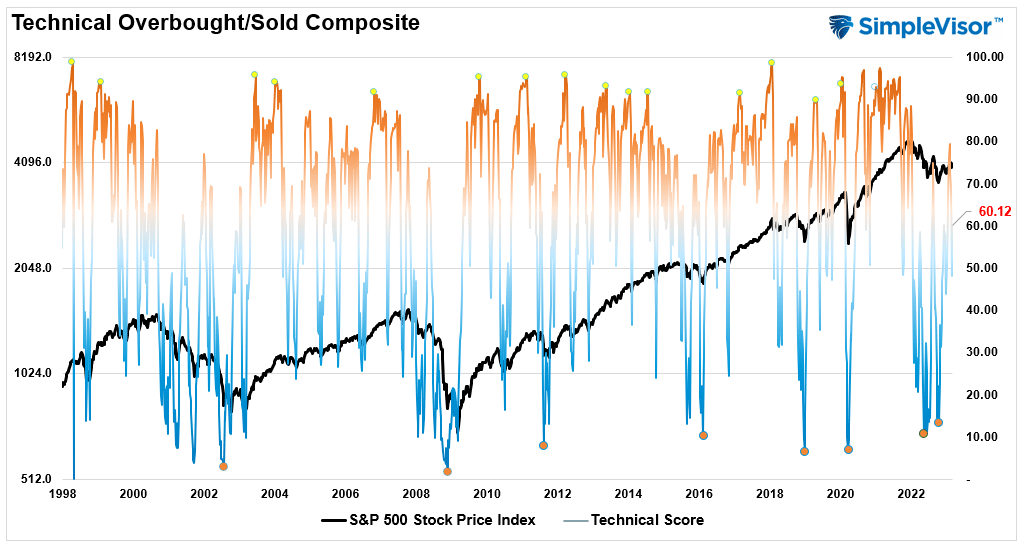
Technical Composite
The technical overbought/sold gauge comprises several price indicators (RSI, Williams %R, etc.), measured using “weekly” closing price data. Readings above “80” are considered overbought, and below “20” are oversold. Markets peak when those readings are 80 or above, suggesting prudent profit-taking and risk management. The best buying opportunities exist when those readings are 20 or below.
The current reading is 60.12 out of a possible 100.
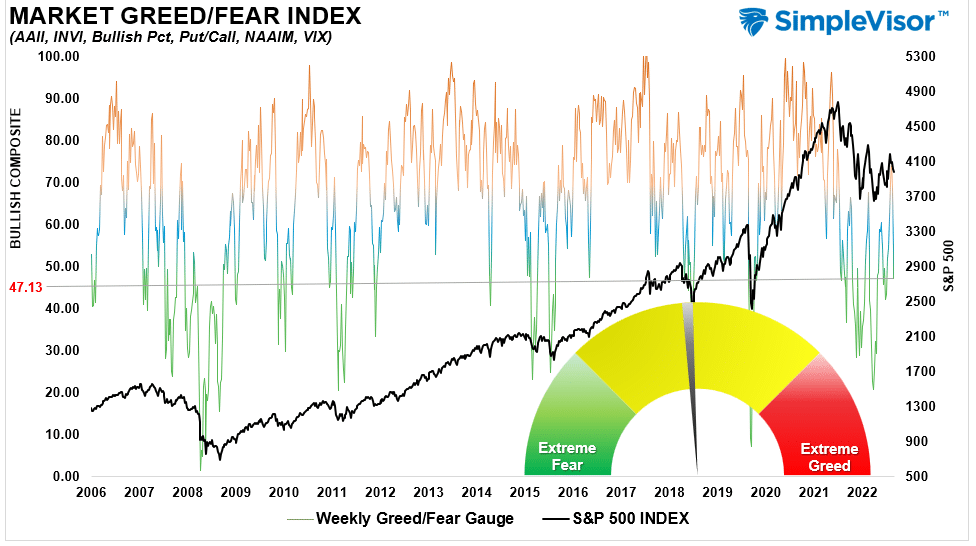
Portfolio Positioning “Fear / Greed” Gauge
The “Fear/Greed” Gauge is how individual and professional investors are “positioning” themselves in the market based on their equity exposure. From a contrarian position, the higher the allocation to equities, the more likely the market is closer to a correction than not. The gauge uses weekly closing data.
NOTE: The Fear/Greed Index measures risk from 0 to 100. It is a rarity that it reaches levels above 90. The current reading is 47.13 out of a possible 100.
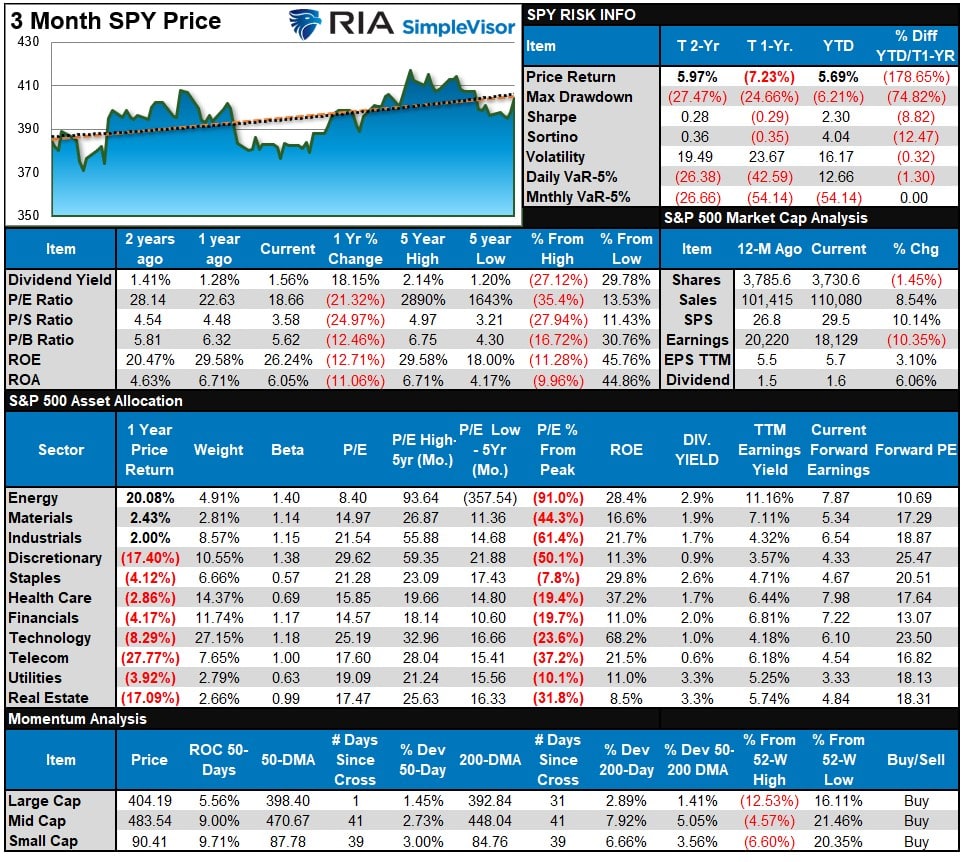
Sector Model Analysis & Risk Ranges
How To Read This Table
- The table compares the relative performance of each sector and market to the S&P 500 index.
- “M” XVER” “Moving Average Cross Over) is determined by the short-term weekly moving average crossing positively or negatively with the long-term weekly moving average.
- The risk range is a function of the month-end closing price and the “beta” of the sector or market. (Ranges reset on the 1st of each month)
- The table shows the price deviation above and below the weekly moving averages.
As noted last week, “The market is oversold enough for a bounce, and those sectors highlighted in green will likely be the beneficiaries of that bounce.”
Such was the case as the markets rallied into the week’s end. The market is not grossly overbought, but profit-taking in Energy, Emerging Markets, and Gold Miners is advised. This table resets to zero on the first of the month, and those sectors are already trading well above their historical ranges. Most sectors are on weekly bullish buy signals, which suggests the “bear market” is over for now.

Weekly SimpleVisor Stock Screens
We provide three stock screens each week from SimpleVisor.
This week we are searching for the Top 20:
- Relative Strength Stocks
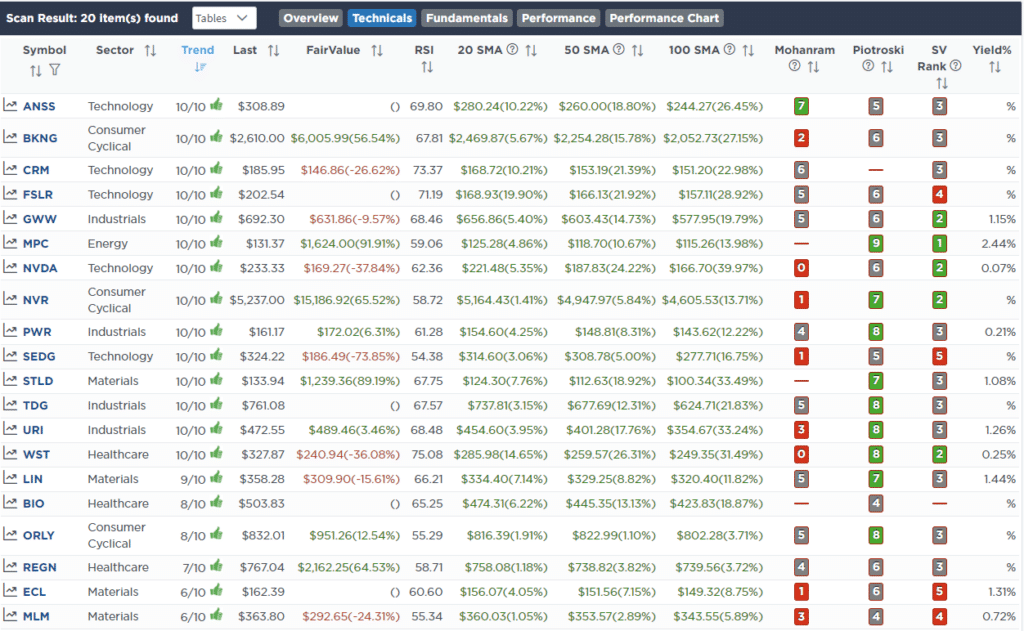
- Momentum Stocks
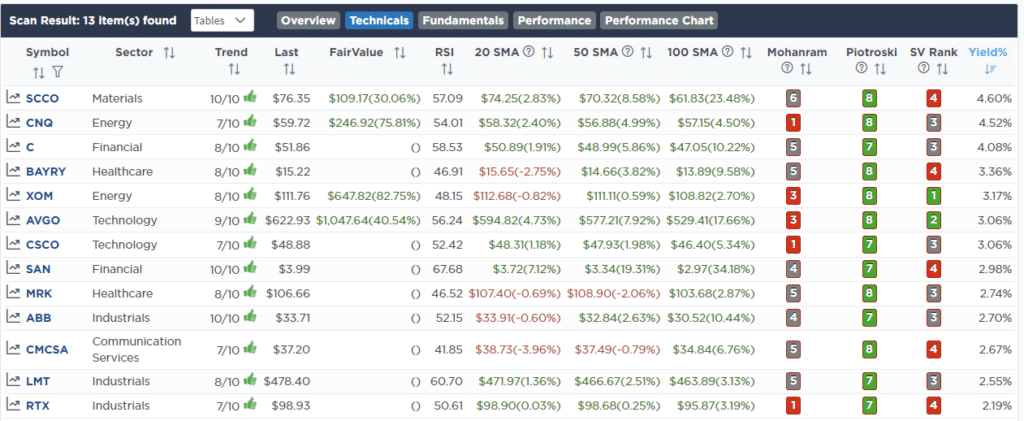
- Highest Rated Stocks With Dividends
(Click Images To Enlarge)
RSI Screen
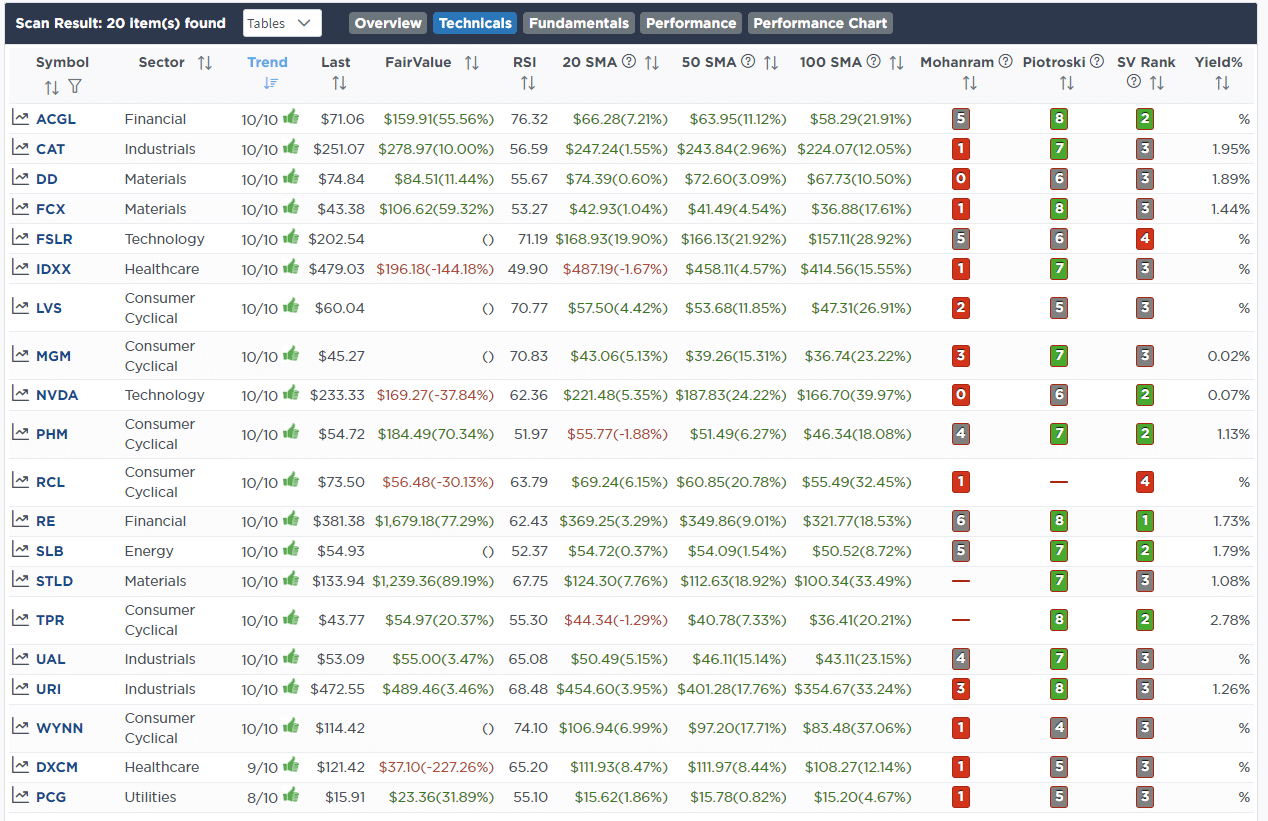
Momentum Screen
Highest Rated Stocks With Dividends
SimpleVisor Portfolio Changes
We post all of our portfolio changes as they occur at SimpleVisor:
February 27th
This morning we added 2% to our iShares 1-3 Year Treasury Bond ETF (SHY) position in both models.
With the market now beginning to price in “higher for longer” by the Fed, the upside risk is limited regarding yields (lower bond prices). We are approaching the point where a Fed reversion to cutting interest rates is likely coming later this year, so we want to lock in higher yields and capture the capital appreciation as rates decline. We will continue to shift from our 1-3 month Treasury Bill ETF (BIL) to SHY as the technicals and fundamentals warrant.
Both Models
- Sell 2% of the portfolio in the iShares 1-3 month T-Bill ETF (BIL)
- Buy 2% of the portfolio in the iShares 1-3 year T-Bill ETF (SHY)
February 28th
This morning we sold our .50% position in Advanced Micro Devices (AMD). We originally bought stakes in both AMD and Nivida (NVDA) and previously sold half of the original position. NVDA is the clear winner in the semiconductor sector and remains well positioned for the future of gaming, cryptocurrency mining, and Artificial Intelligence. We are taking a slight profit on AMD and will double our position in NVDA on a pullback.
Equity Model
- Sell 100% of Advanced Micro Devices (AMD)
March 1st
Yesterday, we sold our position in Advanced Micro Devices (AMD), planning to add more to Nvidia (NVDA) on a pullback. However, NVDA has announced a shelf offering of new shares and is technically overbought. With more than a 50% gain in the position, we have decided to take profits and wait for a pullback to rebuild the position.
Equity Model
- Sell 100% of Nvidia (NVDA)

Lance Roberts, CIO
Have a great week!

