Recession Signs Increase As Fed Dismisses Risk


In this 06-24-22 issue of “Recession Signs Rise.”
- Market Review And Update
- Recession Signs Increase
- Portfolio Positioning
- Sector & Market Analysis
Follow Us On: Twitter, Facebook, Linked-In, Sound Cloud, Seeking Alpha
Need Help With Your Investing Strategy?
Are you looking for complete financial, insurance, and estate planning? Need a risk-managed portfolio management strategy to grow and protect your savings? Whatever your needs are, we are here to help.
Schedule your “FREE” portfolio review today.

Weekly Market Recap With Adam Taggart
Market Review & Update
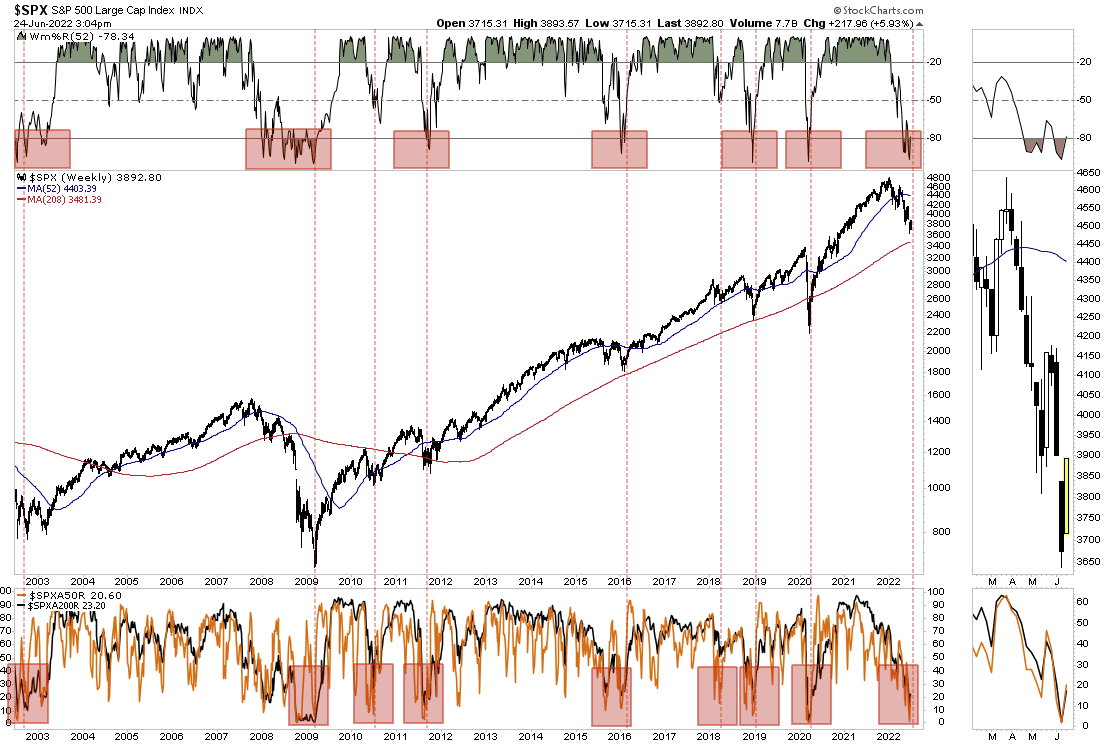
Last week, we noted that previous support levels failed to hold as markets tumbled to new lows for the year. However, we also discussed the more extreme oversold conditions present on many levels, which suggested the potential for a rally was present. Notably, the number of stocks trading below their respective 50 and 200 daily moving averages hit levels generally seen at market bottoms. Such led the market to rally nearly 6% this week.
On Friday, the University of Michigan Sentiment Consumer Sentiment index showed a decline in inflation expectations which buoyed the bulls by reducing expectations for more aggressive Fed rate hikes. Suddenly, Fed fund futures are pricing in rate cuts as early as February of next year.

Of course, with a market solely dependent on the Federal Reserve for price support, it was not surprising to see a fairly sharp rally in anticipation of a return of “zero rates” and “Q.E.”
However, before you get too excited, the markets have a tremendous amount of work ahead to repair the technical damage inflicted so far this year. While the rally was strong on Friday, the volume was light, but it did fill the gap of the previous breakdown in price. Furthermore, as shown, a series of gaps will provide stiff resistance to a rally over the next few days. However, next week is the end-of-the-quarter rebalancing which could support a continued rally with many managers underexposed to equities.
Any rally to the 3900-4000 range on the S&P index will likely move the markets back into overbought territory. With recession risk rising, and earnings estimates on the decline, we suggest using that rally to reduce risk and rebalance allocations accordingly. The odds that a bear market bottom is “in” remain low. However, if things change and the technical backdrop improves, we will add exposure accordingly.
Fed Dismisses Risk Of Recession
This past week, Federal Reserve Chairman Jerome Powell testified before senators as the central bank is under scrutiny for its efforts to combat soaring inflation with rising interest rates while not driving the economy into a recession. As Powell stated:
“We do understand the full scope of the problem, and we’re using our tools to address it pretty vigorously now. Price stability is really the bedrock of the economy. We have both the tools we need and the resolve it will take to restore price stability on behalf of American families and businesses.”
In simpler terms, by raising the cost of borrowing, the Fed can impact inflation by slowing demand.
The problem is the Fed operates in a “bubble,” believing its policy changes are the only factor impacting inflation or the economy. If that were the case, it would be possible to hike rates, reduce inflation, and avoid a recession.
However, that is hardly the case.
Since the beginning of this year, as the Fed was discussing its plans to tighten monetary policy, the stock market, interest rates, and inflation effectively tightened monetary policy in advance of the Fed. As shown, effective monetary policy is significantly tighter currently. (The index is comprised of short-term rates which impact consumption. Long-term rates which affect capital expenditures and mortgages, and inflation.)
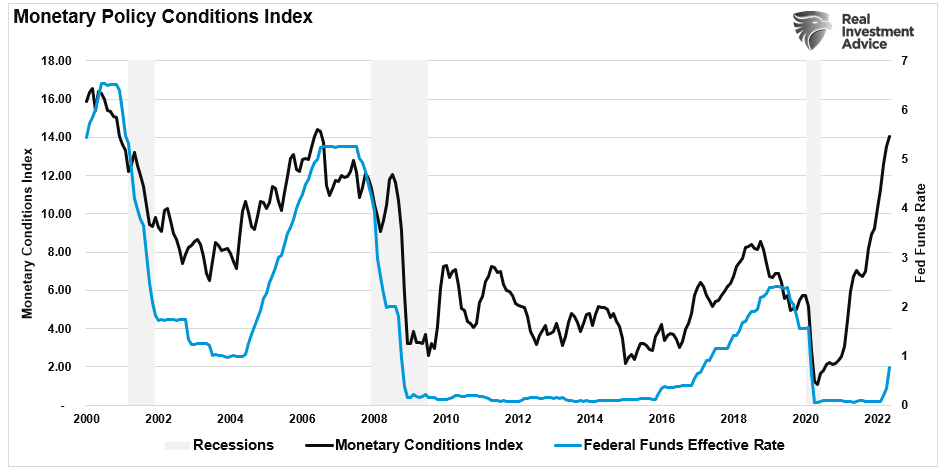
The problem for the Fed is they are well behind the curve in tightening monetary policy. As such, “over-tightening” becomes a more significant risk.
While Mr. Powell believes the economy is “very strong and well-positioned to withstand higher rates,” the latest New York Federal Reverse forecast is quite pessimistic. As shown, the model forecasts economic contractions in both 2022 and 2023.

Maybe someone missed the memo.

Recessions Signs Increase
Mr. Powell did acknowledge the risk of a recession. However, he suggested the Fed, or its policy changes, would be the cause of one. To wit:
“We’re not trying to provoke, and don’t think that we will need to provoke, a recession. But we do think it’s absolutely essential that we restore price stability, really for the benefit of the labor market as much as anything else.”
While Mr. Powell may think they can pull levers to slow inflation and economic growth, the recession signs are mounting quickly on many fronts.
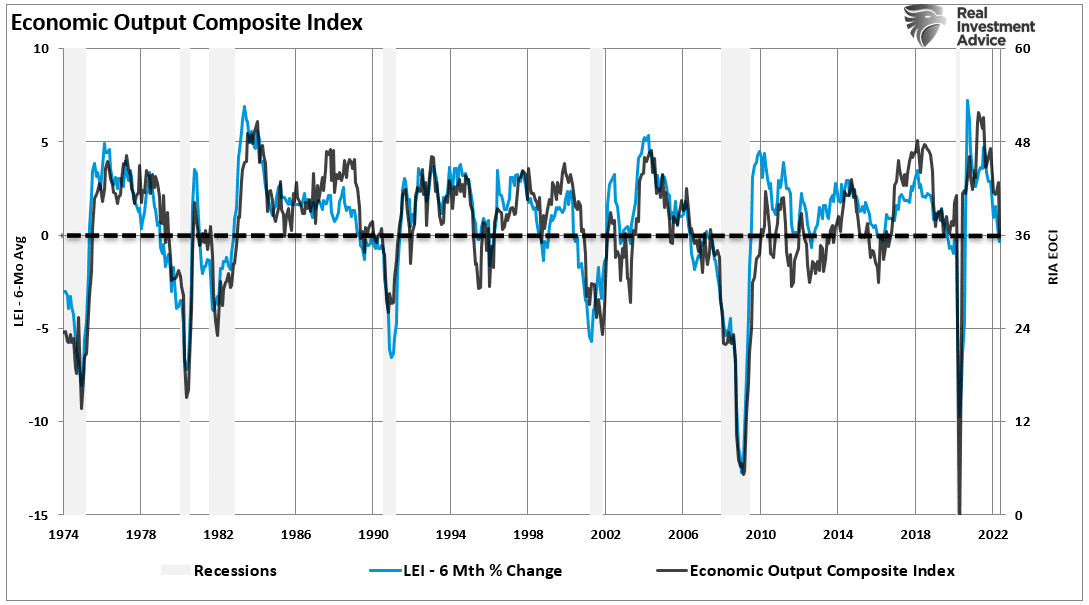
As my colleague Albert Edwards noted on Wednesday, the U.S. Leading Economic Index is already testing recessionary levels.

However, while the Leading Economic Index is one of the best recessionary indicators, other recession signs confirm the same. As noted last week, our Economic Composite Index (comprised of both leading and lagging indicators, tracks the 6-month percentage change in the LEI very closely. The EOCI index suggests the economy is very close to contraction.
Of course, for investors, these recession signs suggest the stock market has not fully accounted for the coming contraction in earnings. As Mr. Edwards concluded:
@MikaelSarwe, head of Market Strategy at Nordea, was flagging that ‘The problem with (current) lower P/E ratios is that while the P has moved, the E is on thin ice — and the cracks are starting to show.”
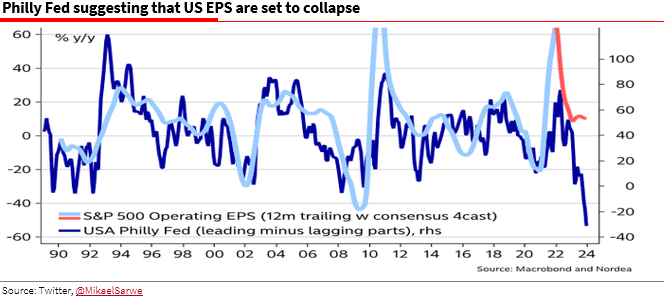
Earnings are one of, if not the best, recession signs for investors. Given that earnings estimates remain elevated, the eventual downward revisions will require a further repricing of assets to compensate.
In other words, this bear market cycle is likely not over yet.
This Week’s MacroView
Interest Rates Aren’t Pricing In Recession Risk…Yet.
While stocks have not fully accounted for the decline in earnings, the same is true for bonds and the coming economic slowdown or recession.
As noted above, the New York Federal Reserve made a shocking statement by lopping 1.5% off its GDP forecast for both 2022 and 2023. Mind you; this is significantly lower than most Wall Street estimates.
Furthermore, the N.Y. Fed predicted that a coming recession would last two full years, which is rather extraordinary and arguably one of the most bearish comments I have ever seen by a regional Federal Reserve bank. To quote:
“The odds of a hard landing are around 80%.” New York Federal Reserve
Notably, there is a relationship between interest rates, the economy, and inflation. As the economy strengthens, the demand for money increases interest rates as banks can charge more for loans. Interest rates also compensate for strong inflation as demand exceeds available supply. In a recessionary economy, the reverse also holds.
The chart below shows the relationship between the annual change in interest rates to the 6-month rate of change in the Leading Economic Index. Currently, bonds have not started to effectively “price in” slower economic growth, much less a recession.
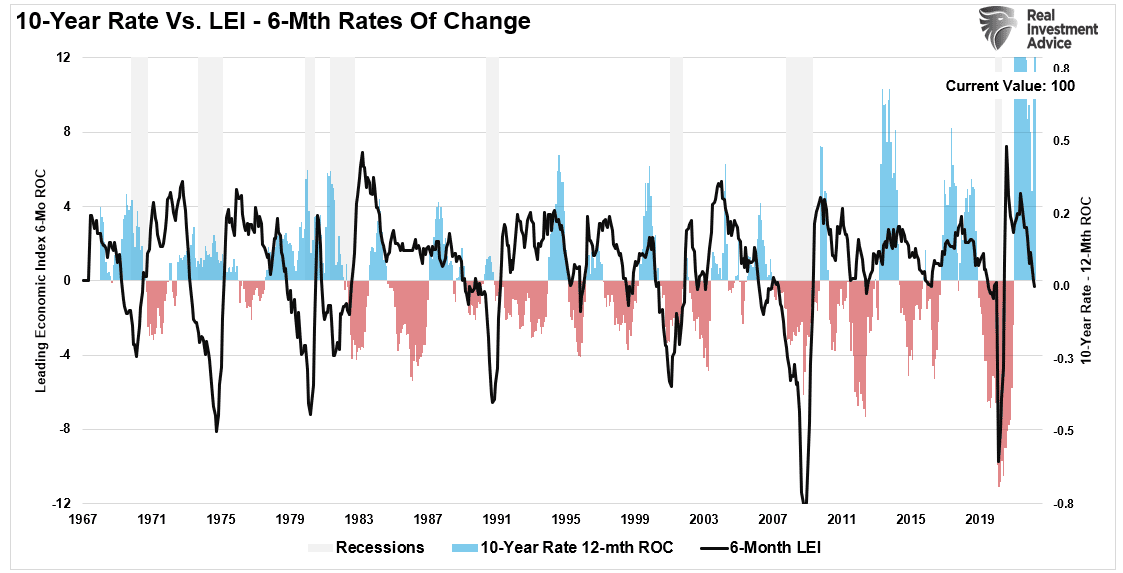
As the Fed hikes rates, economic growth and inflation will slow. Such suggests that interest rates should decline to compensate for lower loan demand. Furthermore, as noted above, as the equity markets reprice lower for earnings, the “risk-off” rotation will apply downward pressure on yields.
Such gets shown by comparing the above monetary policy conditions index to the 10-year Treasury rate. During the next recession, the 10-year rate will likely fall below 1% to compensate for the recession and drop in inflation.
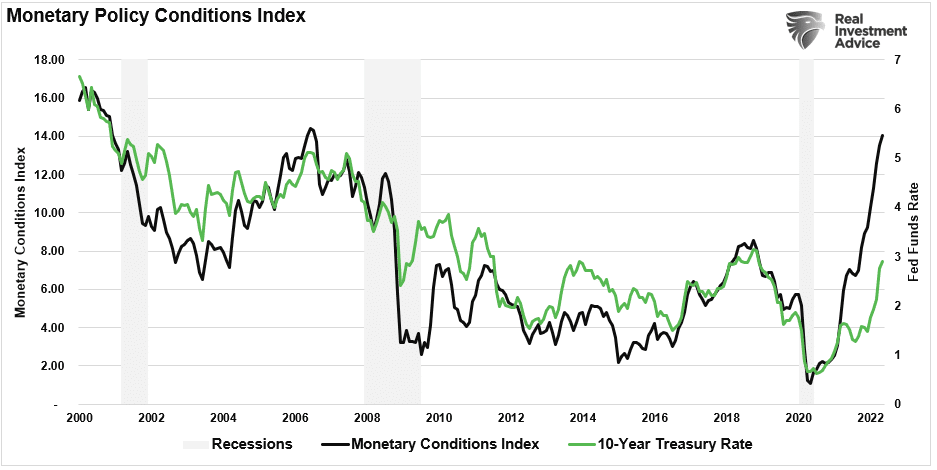
Such is why bonds will likely outperform stocks in the next cycle.

Portfolio Update
Just recently, Yahoo Finance had a great note on “bear market rallies.”
“Bear markets test investors, both on the way up and way down. When the news cycle seems like it can’t get any more horrifying, stocks seize an olive branch. Perhaps it is a reprieve from a hawkish central banker or a drop in sky-high oil prices.
But no matter the catalyst, bear market rallies can send stocks off to the races, and weary investors don’t want to miss out.
Rinse, repeat.”
That is the challenge that faces investors currently. Markets are down, but investors have repeatedly gotten bailed out by Fed interventions. However, in a real bear market, rallies continue to “beat” investors into giving up. That is when bottoms usually form.
As we stated, when it comes time to “back up the truck” to buy equities, you won’t want to.
The S&P 500 was down over 23% at its most recent lows. The rallies so far this year have been shallow and short-lived. The largest was a roughly two-week move at the end of March that produced an 11% bounce for the index.
And now we’re barely off the new lows. Again.
This bear market is likely not over yet as recession signs mount. Such is why we continue carrying higher levels of cash, reducing exposure, and rebalancing portfolio risks accordingly. There is no easy measure to navigate markets at the moment, but for those who have never been through a bear market, this is just part of the process.

We suggest using rallies to reduce risk and increase cash levels further until the market provides better clarity.
As noted last week, we remain pretty confident we are not yet at that point.
Have a great week.
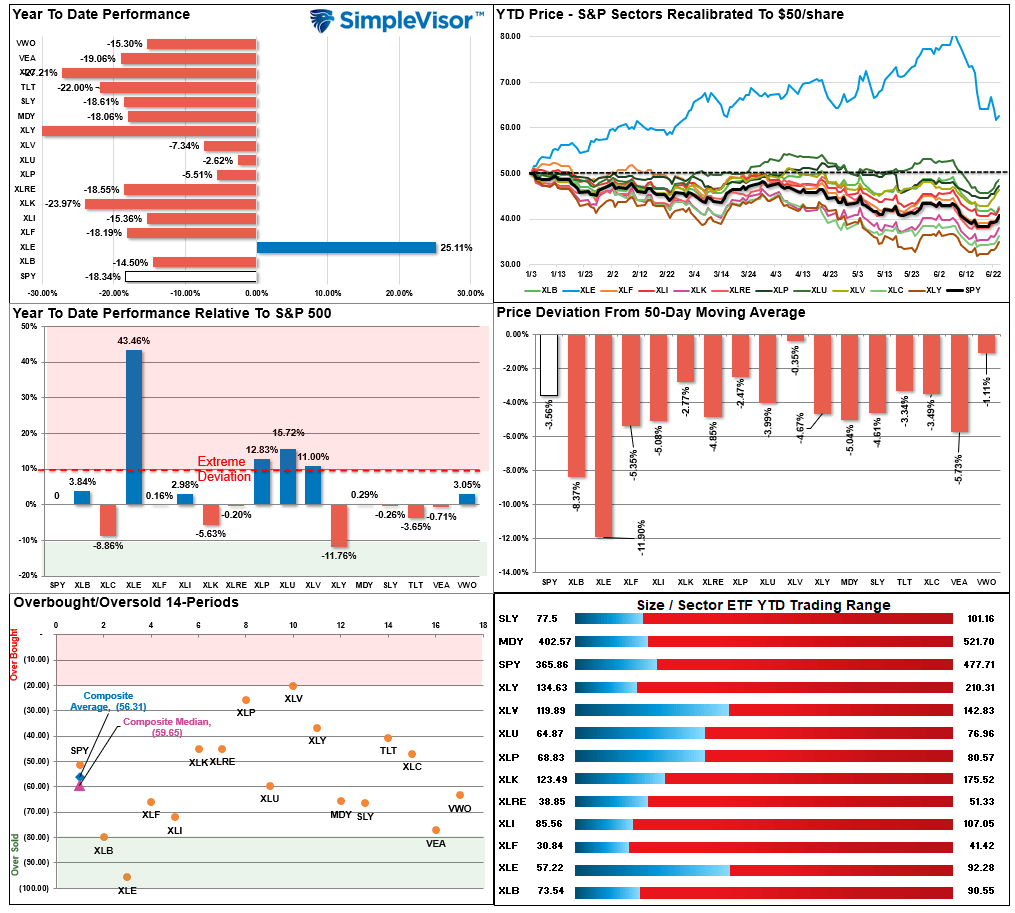
Market & Sector Analysis
S&P 500 Tear Sheet
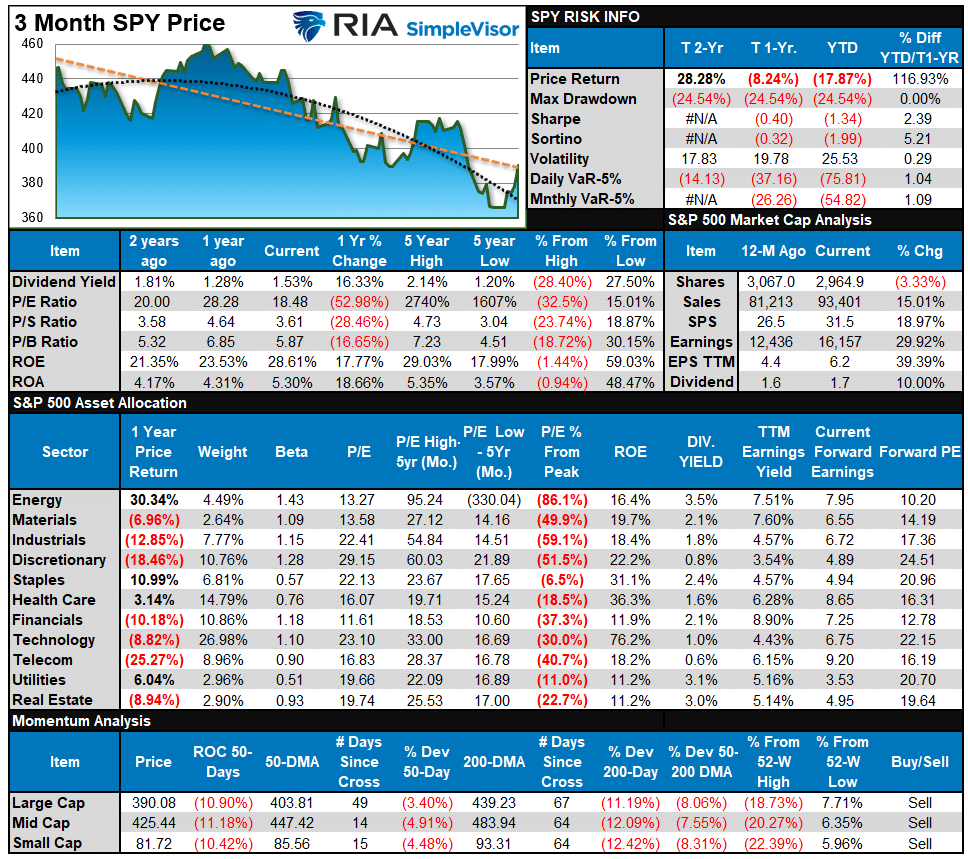
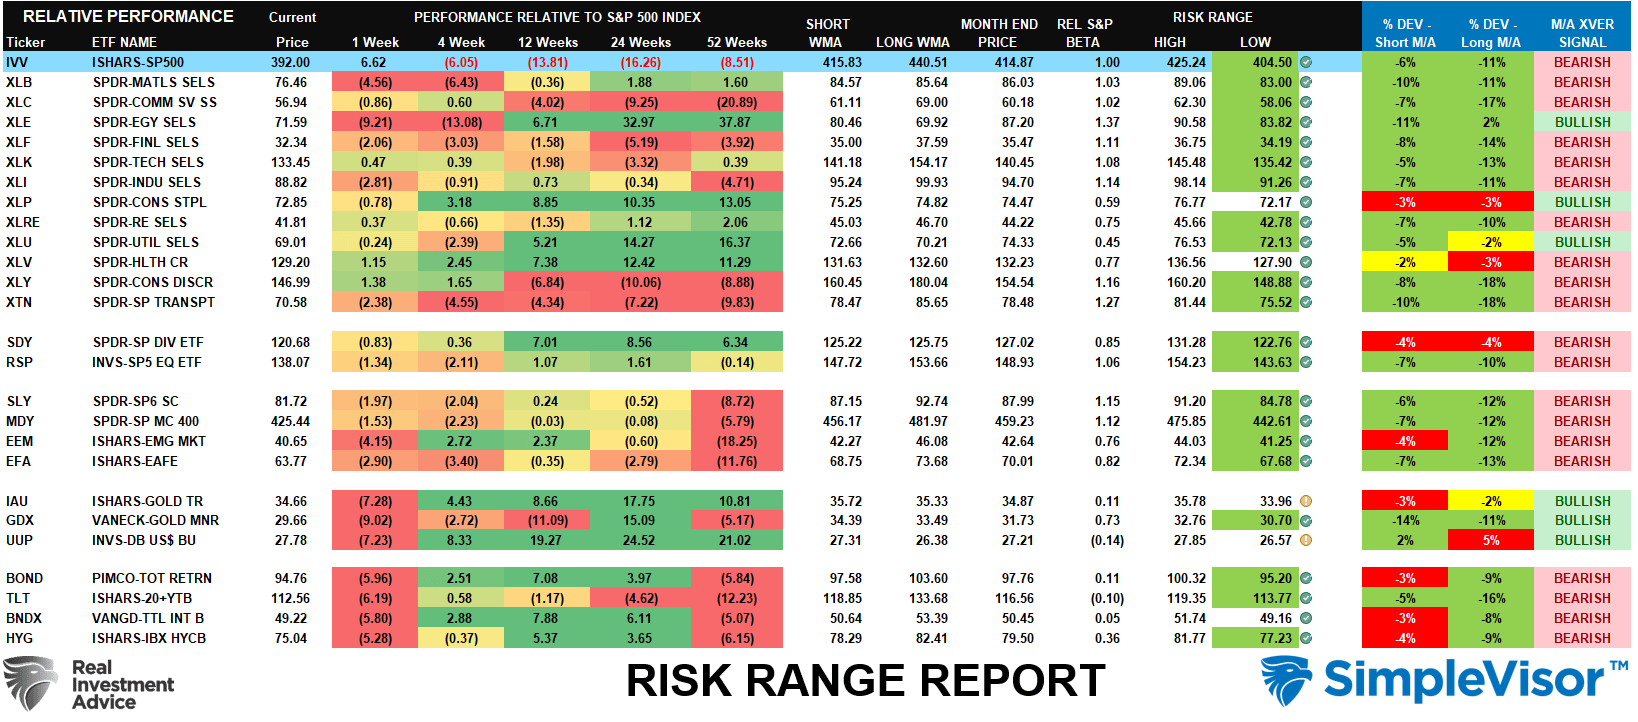
Relative Performance Analysis
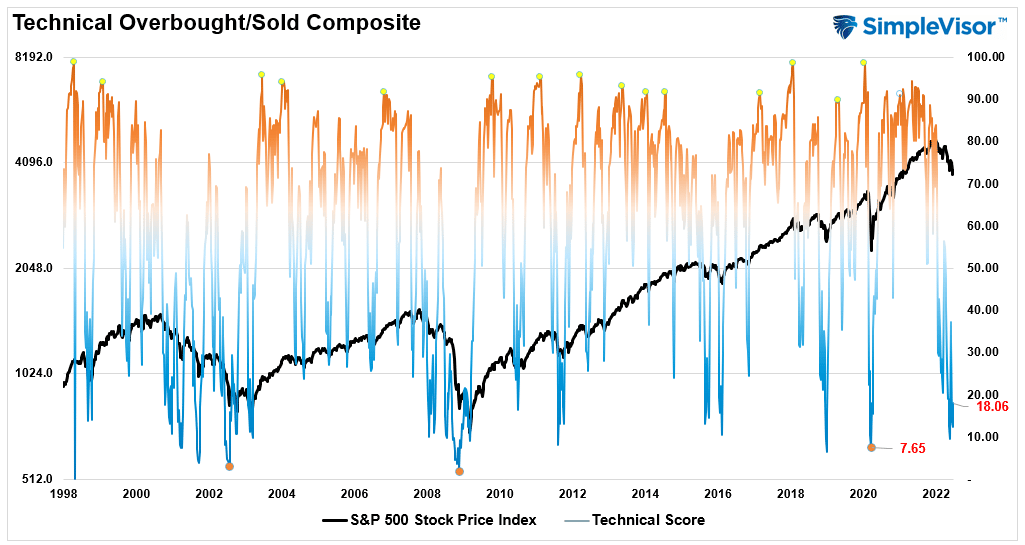
Technical Composite
The technical overbought/sold gauge comprises several price indicators (RSI, Williams %R, etc.), measured using “weekly” closing price data. Readings above “80” are considered overbought, and below “20” are oversold. The current reading is 18.06 out of a possible 100.
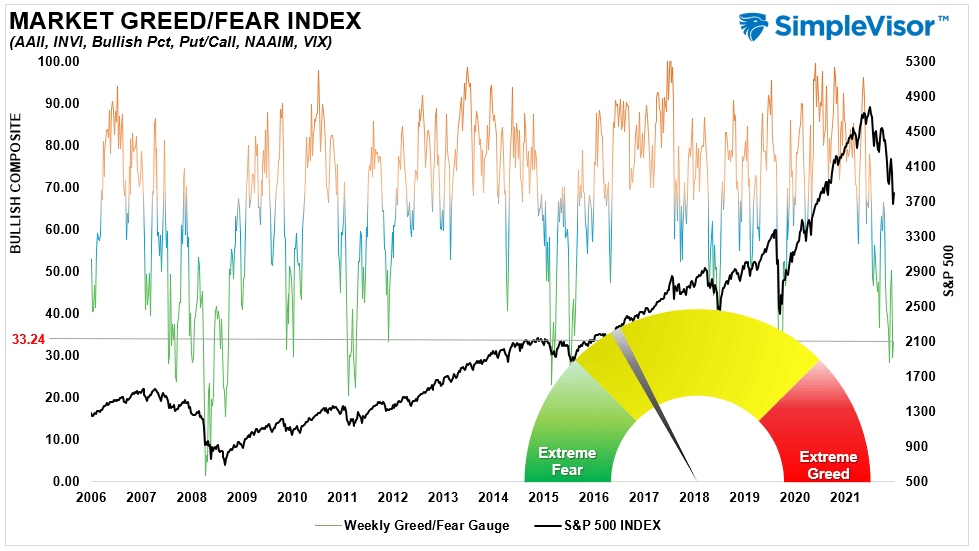
Portfolio Positioning “Fear / Greed” Gauge
The “Fear/Greed” gauge is how individual and professional investors are “positioning” themselves in the market based on their equity exposure. From a contrarian position, the higher the allocation to equities, to more likely the market is closer to a correction than not. The gauge uses weekly closing data.
NOTE: The Fear/Greed Index measures risk from 0 to 100. It is a rarity that it reaches levels above 90. The current reading is 33.24 out of a possible 100.
Sector Model Analysis & Risk Ranges
How To Read This Table
- The table compares the relative performance of each sector and market to the S&P 500 index.
- “M/A XVER” is determined by whether the short-term weekly moving average crosses positively or negatively with the long-term weekly moving average.
- The risk range is a function of the month-end closing price and the “beta” of the sector or market. (Ranges reset on the 1st of each month)
- The table shows the price deviation above and below the weekly moving averages.
- The complete history of all sentiment indicators is under the Dashboard/Sentiment tab at SimpleVisor.
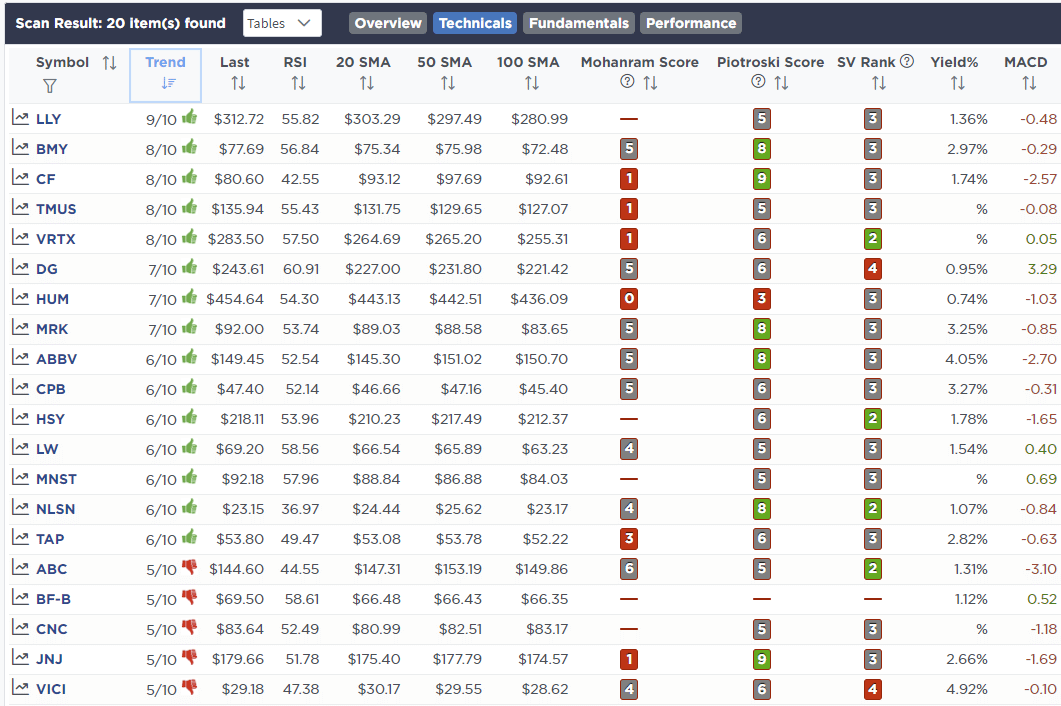
Weekly Stock Screens
Each week we will provide three different stock screens generated from SimpleVisor: (RIAPro.net subscribers use your current credentials to log in.)
This week we are scanning for the Top 20:
- Relative Strength Stocks
- Momentum Stocks
- Technically Strong With Strong Fundamentals
These screens generate portfolio ideas and serve as the starting point for further research.
(Click Images To Enlarge)
RSI Screen
Momentum Screen
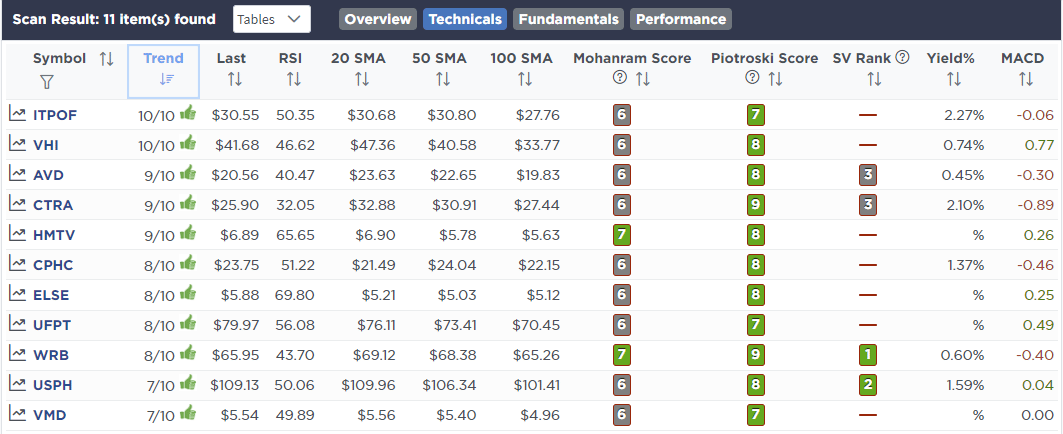
Technical & Fundamental Strength Screen
SimpleVisor Portfolio Changes
We post all of our portfolio changes as they occur at SimpleVisor:
We had no trades this week.

Lance Roberts, CIO
Have a great week!


