
Inside This Week’s Bull Bear Report
- Market Takes A Breather
- Technical Review Of The Bull Rally
- How We Are Trading It
- Research Report – Debts, Deficits & Why $32 Trillion Matters
- Youtube – Before The Bell
- Market Statistics
- Stock Screens
- Portfolio Trades This Week
Market Review & Update
The market took a breather this past week as earnings season begins to wind down. Such was expected, as discussed in last week’s commentary. To wit:
There are several vital points in the chart below.
- The negative divergence of the MACD and RSI was a warning sign of an impending correction. All that was needed was a catalyst to spook buyers: the debt downgrade.
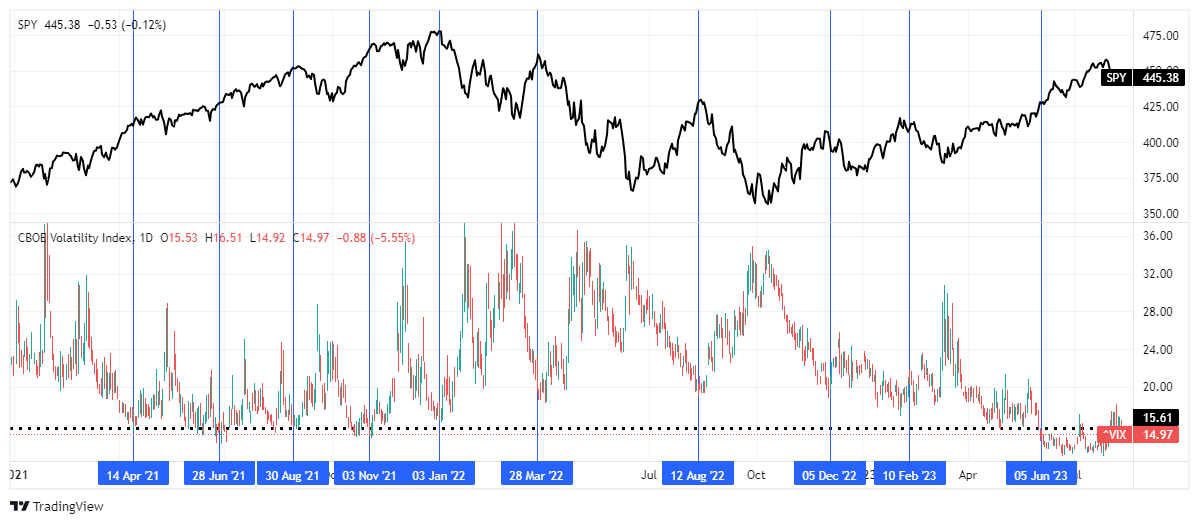
- There was a significant uptick in the volatility index for the first time since May. (As discussed in “Complacency”)
- Moving average support levels are important indicators of the potential depth of the correction.
The chart was updated through Friday’s close.
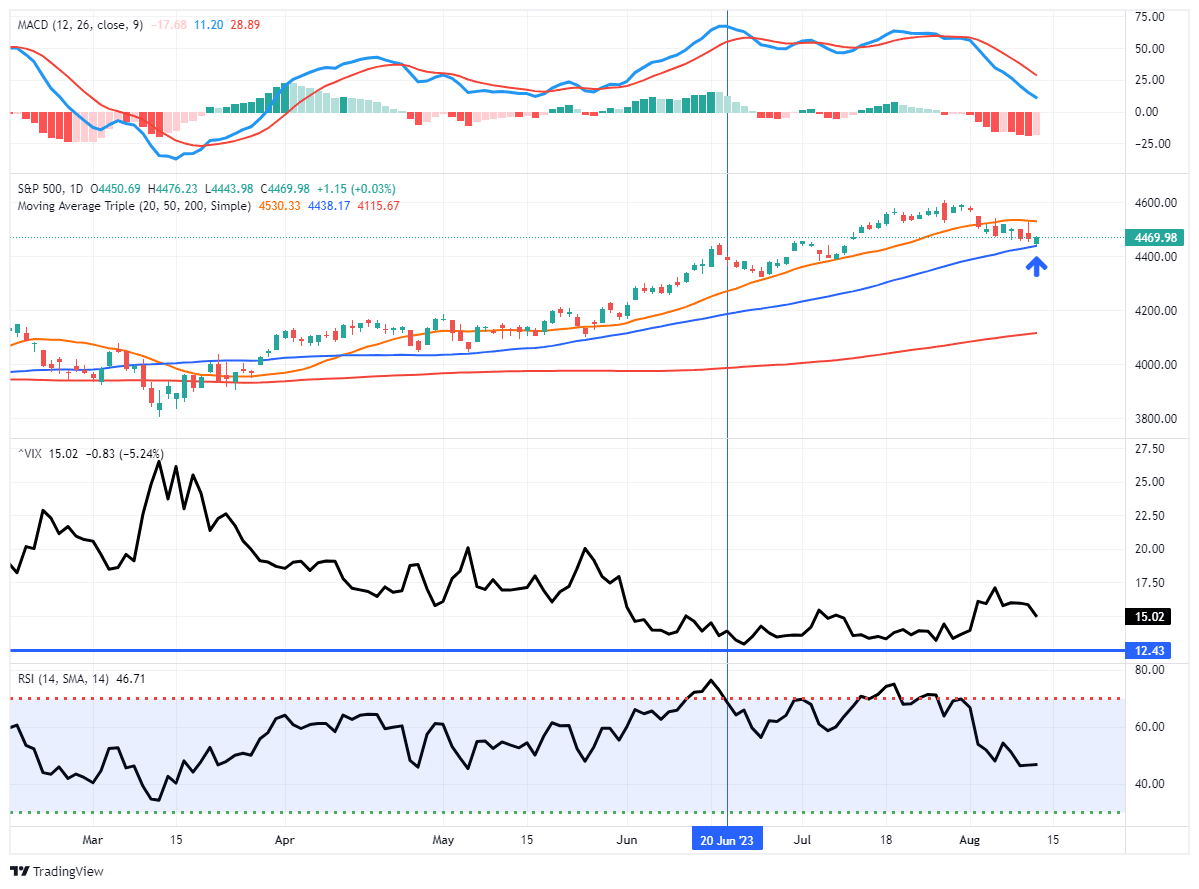
As stated, the breather from the 5-month advance was unsurprising, and this week’s inflation reports, both within expectations, did little to change the course of the Federal Reserve in the short term. The “market breather” remains within a consolidation range between the rising 20- and 50-day moving averages. On Friday, the market successfully tested and held the 50-DMA. If the market falls below the 50-DMA, which is possible, this breather becomes a correction, and the 100-DMA becomes the next level of logical support.
We will discuss the technical backdrop below, but the market has done little wrong. As such, we suggest using this correction to add exposure to portfolios when the current “sell” signals reverse. With earnings season mostly behind us, the market’s focus will turn to the upcoming Jackson Hole Summit and Jerome Powell’s speech which will be parsed for clues as to upcoming changes to Fed policy.
There is a reasonable risk that Mr. Powell could disappoint the bulls again as he did last year. We will have to wait and see.
Need Help With Your Investing Strategy?
Are you looking for complete financial, insurance, and estate planning? Need a risk-managed portfolio management strategy to grow and protect your savings? Whatever your needs are, we are here to help.

A Technical Review Of The Market
As noted above, the “market breather” this past week was unsurprising. However, such is an excellent time to review the technical backdrop of the market to confirm the bullish trend. In “Trading An Unstoppable Bull Market,” we noted that there are millions of different ways to approach the technical analysis of markets. I am only going to discuss with you how we do it. To wit:
“Notably, technical analysis does NOT predict the future. It is the study of historical price action, which is the purest representation of the psychology of market participants. From that study, we can make statistical observations about the behavior of market participants in the past. Those assumptions can help form a “guess,” assuming similar variables, about how they may act in the near term.
We use one indicator to signify if prices are overbought or sold, two moving averages to determine the trend of prices, and Bollinger bands to warn of significant deviations from those moving averages. I show the technical setup in the sample chart below from SimpleVisor.com.
Notably, technical analysis is nothing more than a “weather report.” It gives us the current sentiment of the pool of buyers and sellers that make up the stock market. That sentiment can and will change rapidly should a tropical storm turn into a hurricane. Therefore, we must analyze the market for the current weather patterns but keep our eye on the horizon for storm clouds should they develop.
Earlier this year, we noted the inverse head and shoulders formation developing in the market, suggesting a bullish rally was in progress. Since then, the market advance has been quite strong, albeit narrow, taking the market to more extreme overbought levels. The Moving Average Convergence Divergence (MACD) oscillator recently triggered a “sell signal” from a more elevated level. Such tends to suggest a market breather, which could be either a short-term correction or consolidation. That breather will end when the current “sell” signal reverses. The bottom of the trend channel is the likely maximum drawdown during this current breather unless something unexpectedly negatively surprises the market.
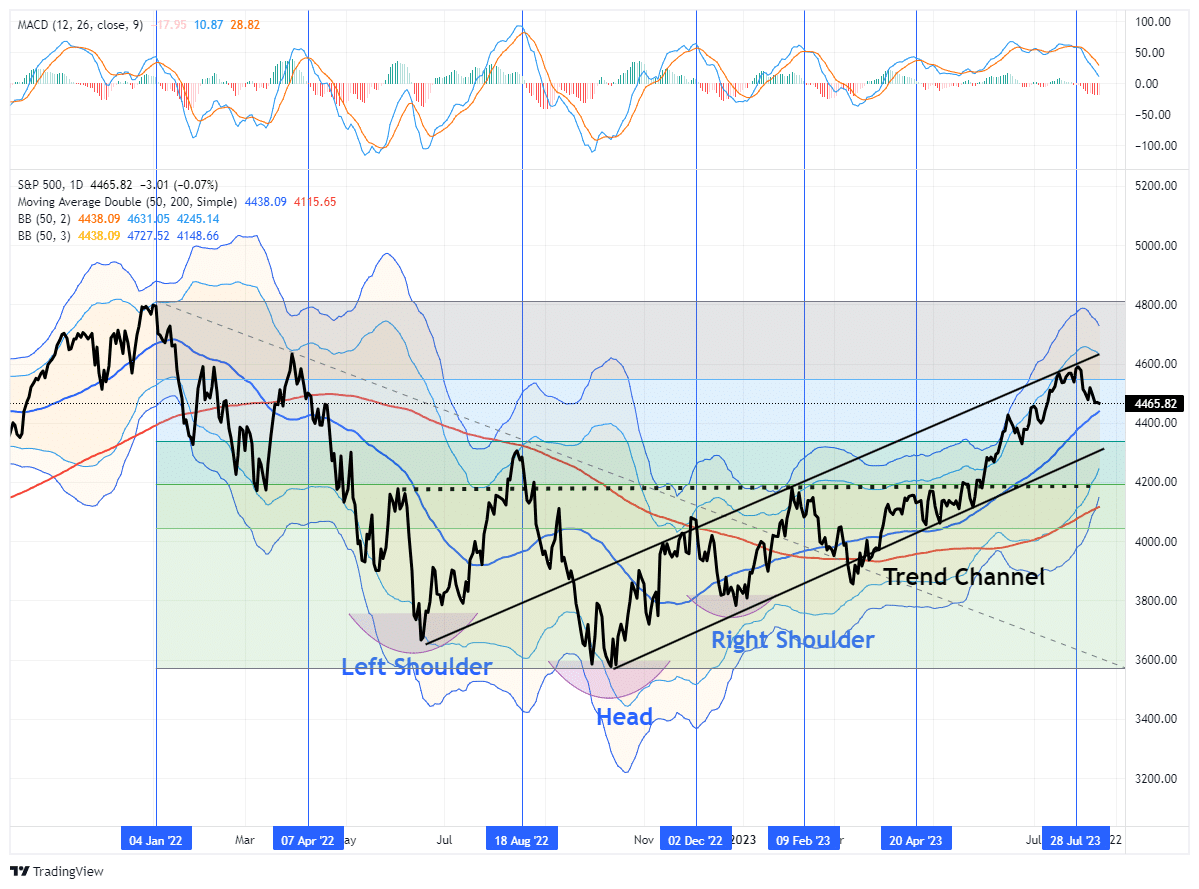
From a technical perspective, very little is “bearish” with the current market environment. Market breadth has improved from earlier this year, showing a broader participation of stocks in the rally, and the market trend remains bullish. Furthermore, the market completed a 78.6% retracement of the 2022 decline, suggesting markets are more likely to retest all-time highs than lows.
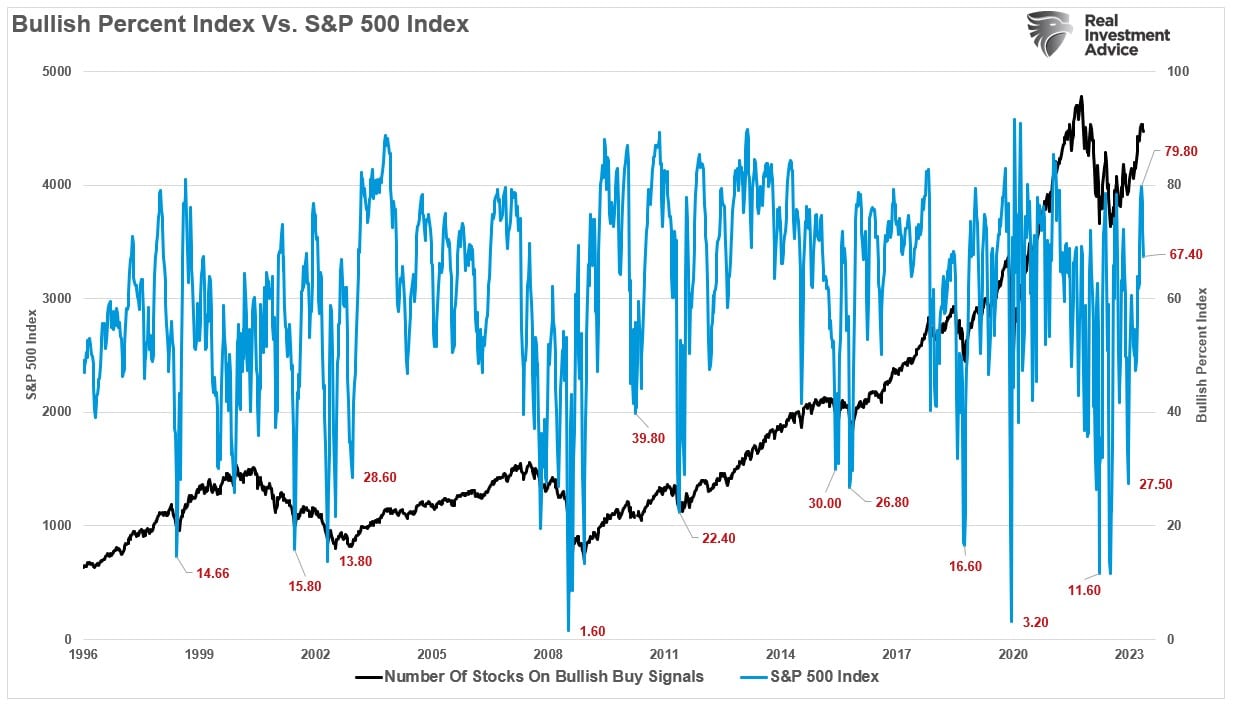
The percentage of stocks on bullish buy signals has risen markedly, indicating support for the rally. While high readings of stocks on buy signals tend to align with short-term market corrections, they also support continuations of bullish trends. Such is particularly the case when reversing from low levels.
While the market breather is most likely not complete yet, the market is oversold enough on a short-term basis for a bounce. However, any bounce to the 20-DMA remains potential resistance to any rally. Notably, while the market did come under pressure over the last week, there were no visible signs of panic selling by investors. In fact, volatility fell even as the market declined, showing no concern of a deeper correction on the horizon.
For now, there is little reason to be “bearish” on large-cap stocks from a technical perspective. As such, we will continue to use weakness to add exposure to portfolios accordingly.
However, the same can not be said for Small and Mid-Cap stocks.
Small And Mid Still Bearish
There remains a perennial hope that small and mid-capitalization companies will come storming back as large capitalization fades. However, such has not been the case over the last few years, as investors pour money into exchange-traded funds. As discussed previously, those flows disproportionally funnel money to the largest cap-weighted names.
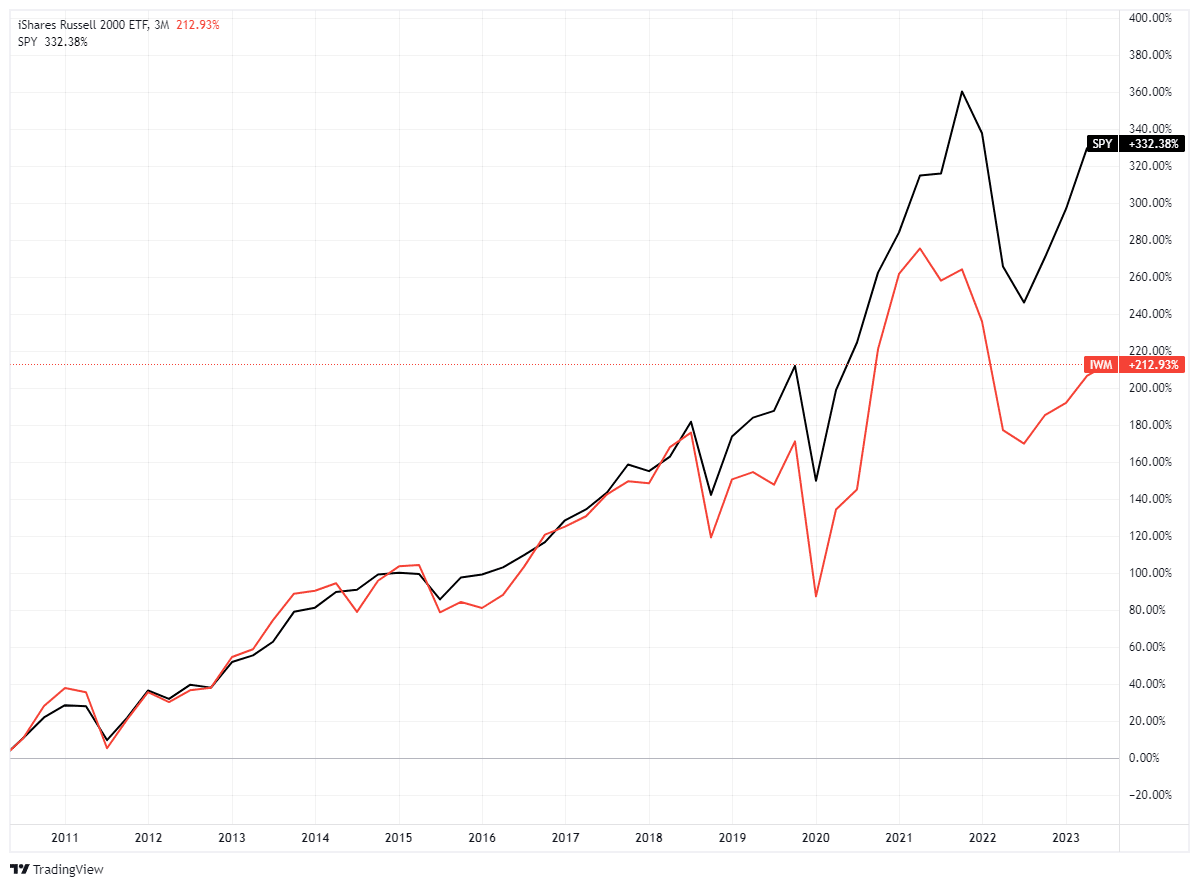
That underperformance is much more notable since the pandemic-driven shutdown, as actual economic activity remains substantially weaker than economic headlines. Not surprisingly, small and mid-capitalization companies do not have the luxury of engaging in massive share repurchases to boost operating earnings. As such, they rely on revenue streams to boost earnings, and with pandemic-era stimulus fading, those sales and subsequent sentiment remain weak.
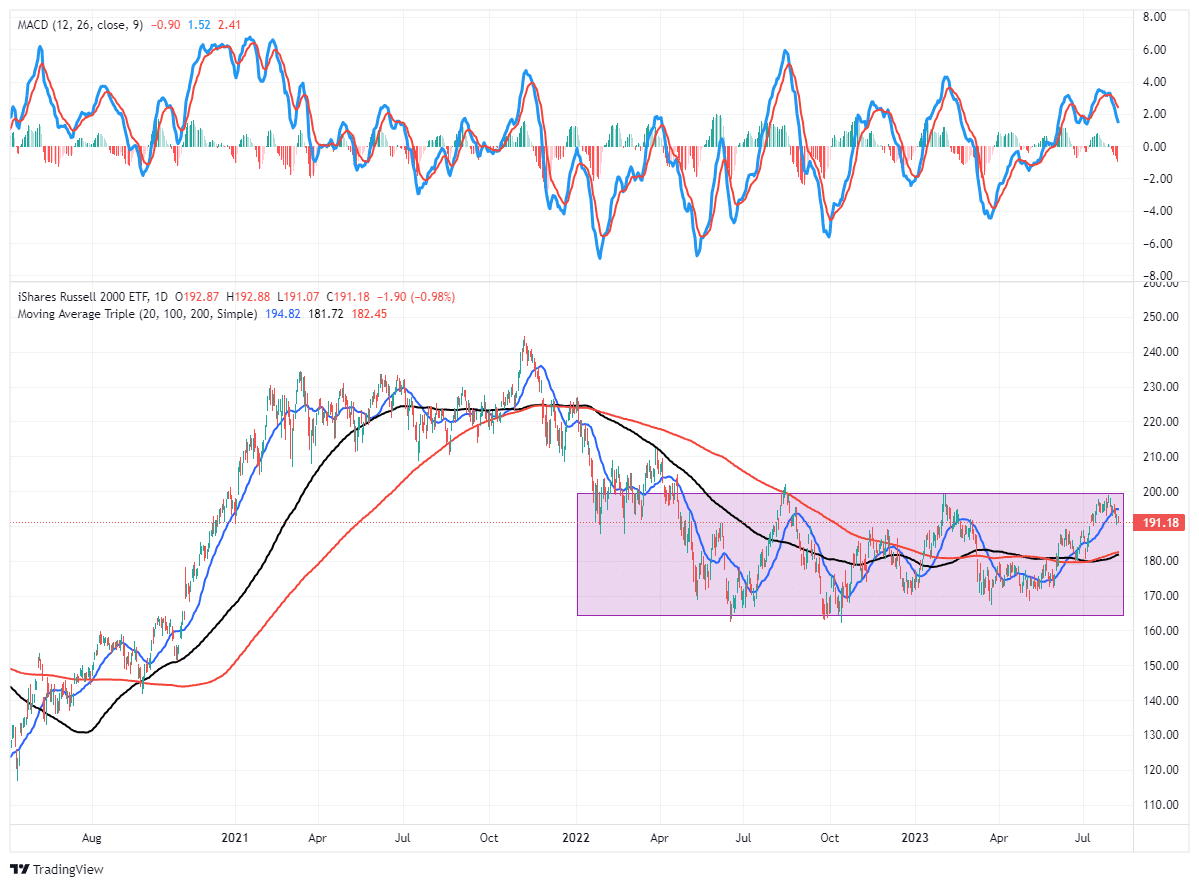
While the S&P 500 and Nasdaq are currently bullish, the Russell 2000 index remains well entrenched in a sideways trend within a “bearish” decline. With the MACD “sell signal” triggering from a higher level, the risk of a retest of support at the previous lows is undoubtedly possible.
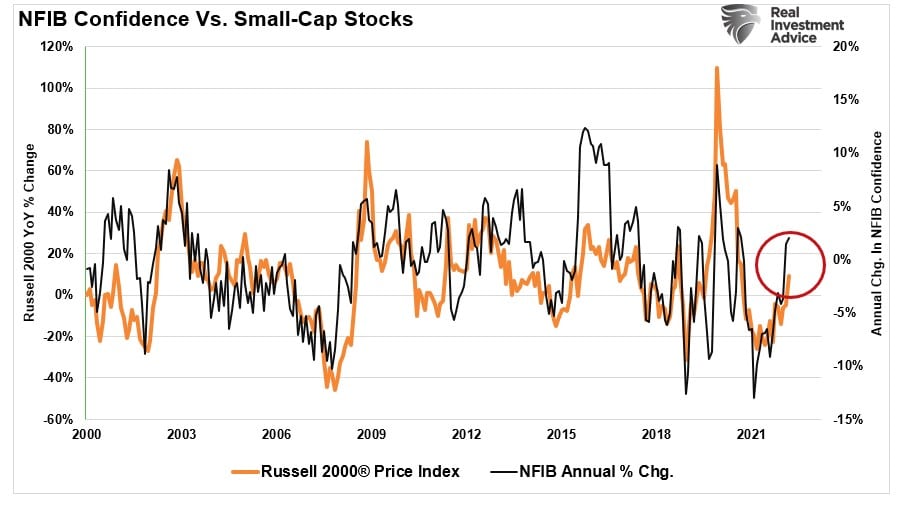
We remain underweight small and mid-capitalization companies until we see a marked improvement in small-business sentiment. As shown, the annual rate of change in the NFIB Small Business Survey is a good proxy for the Russell 2000 Index. While sentiment has improved recently, it will need to continue if small and mid-capitalization companies are going to gain ground on the large-cap indices.
However, long-dated Treasury bonds remain the best trade over the next 18-24 months.
Stocks Versus Bonds
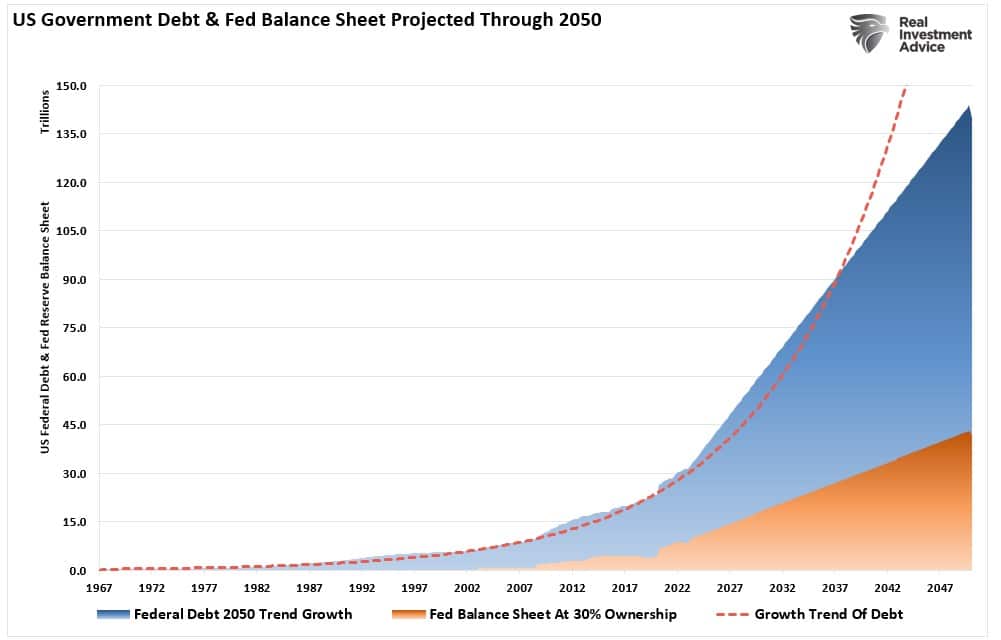
One of the best longer-term trade setups currently remains long-dated Treasuries. As we have discussed recently, interest rates are a function of inflation, economic growth, and debt. As debt levels continue to increase, interest rates will be forced lower to keep debt service contained. Otherwise, the economic and financial consequences of massive debt defaults will create the next “Great Depression.” Such is why over the next 30 years, the Federal Reserve must absorb roughly 30% of all debt issuance to keep rates low.
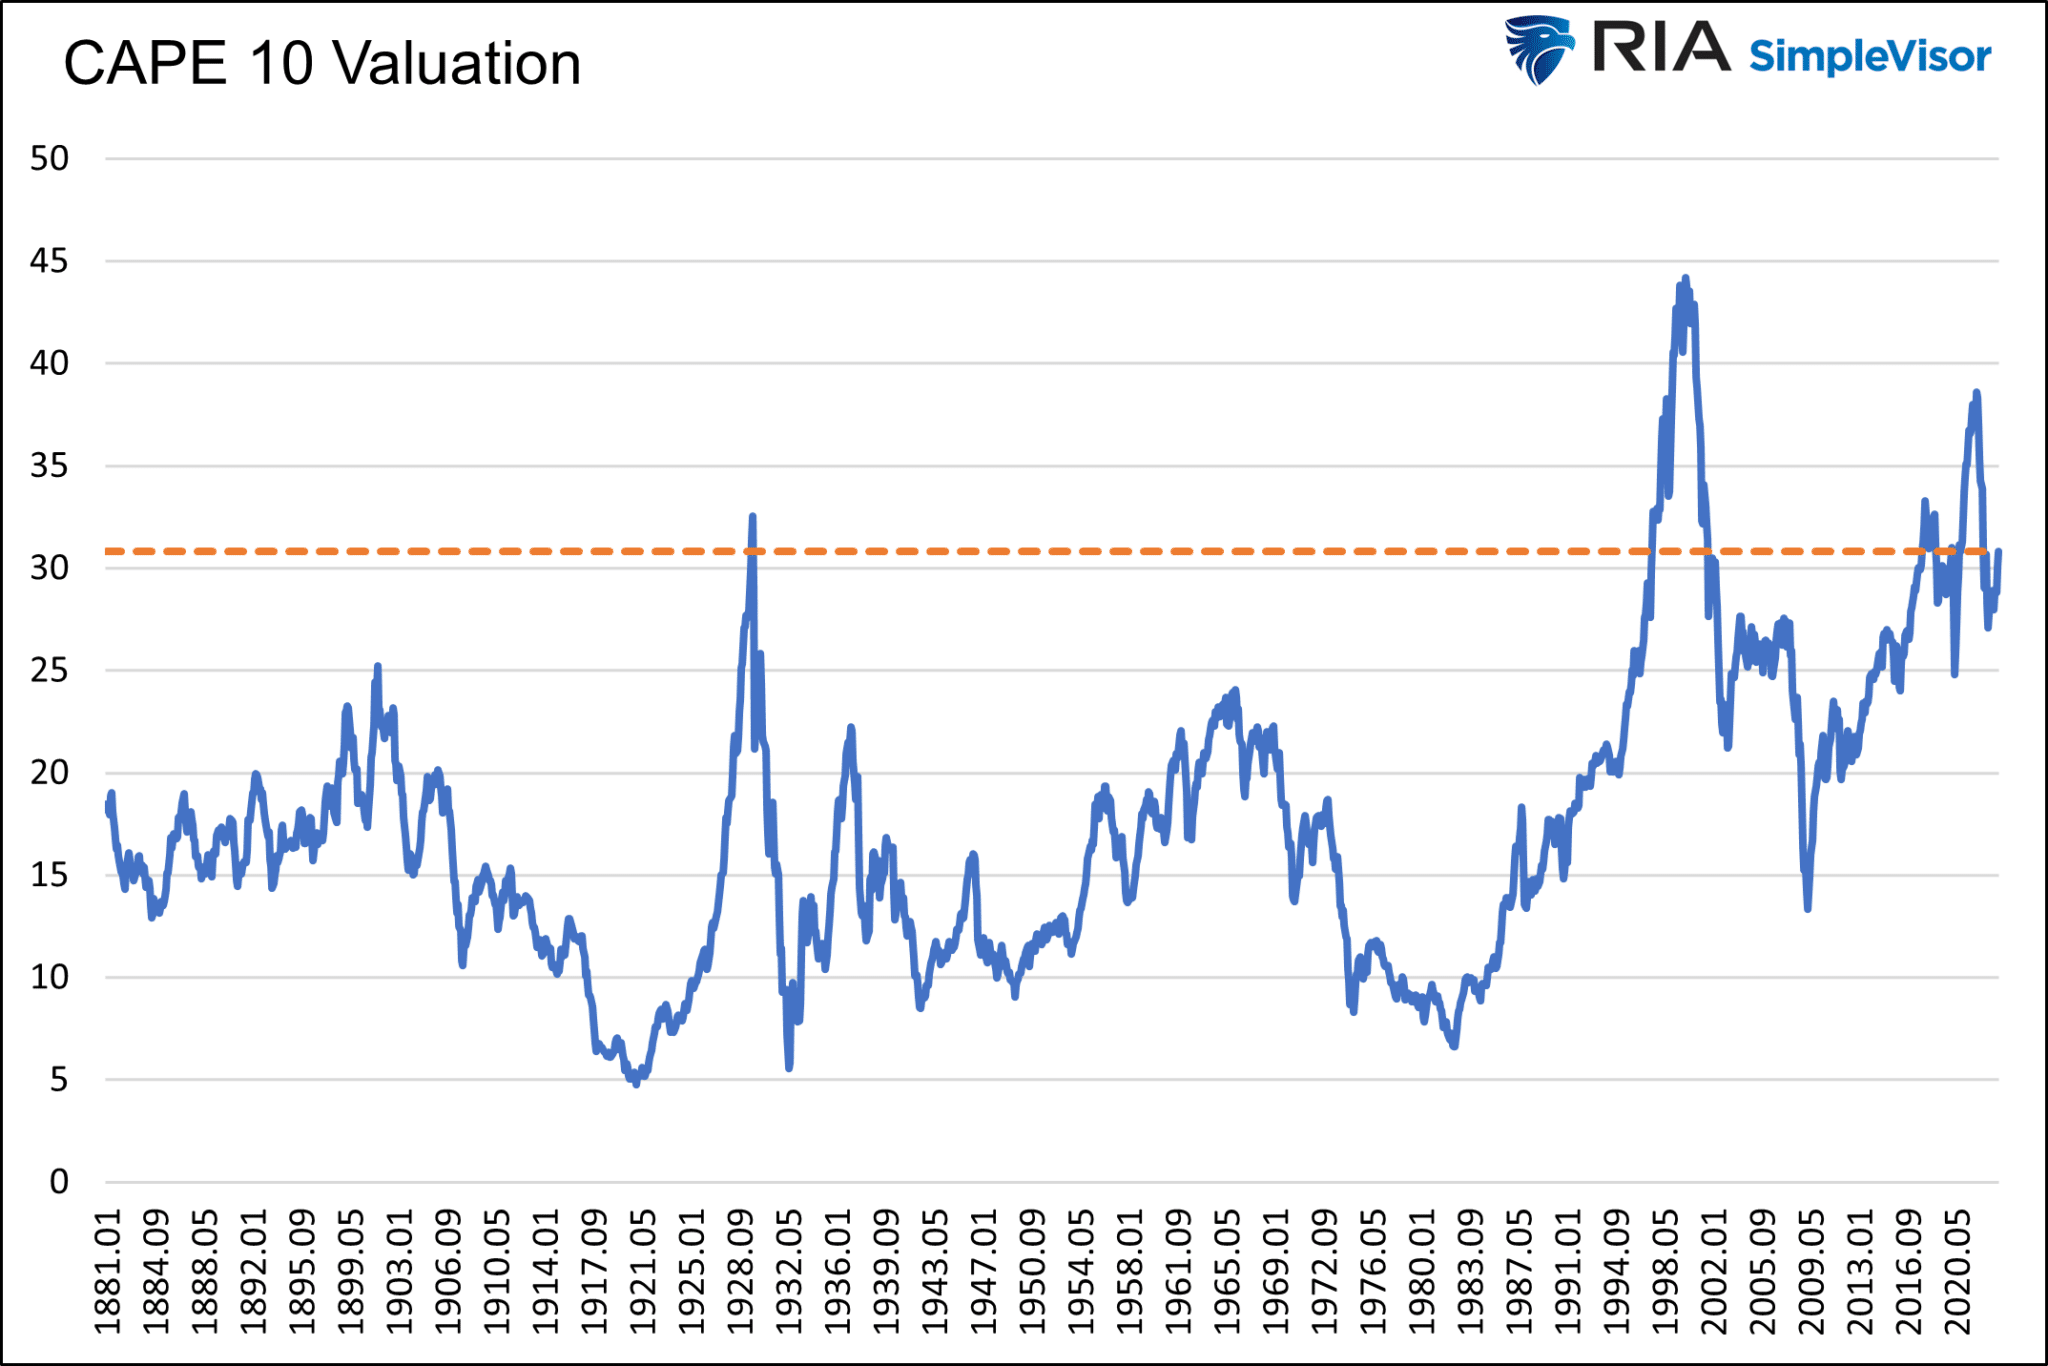
The problem for stock market investors is ultimately current valuations. As Michael Lebowitz recently penned:
“Currently, CAPE 10, a longer-term measure of price to earnings, of the S&P 500 is 30.82. Going back to 1871, today’s valuation has only been exceeded by a brief period leading to the Great Depression, another before the dot com bubble crash, and varying occasions between 2017 and today.”
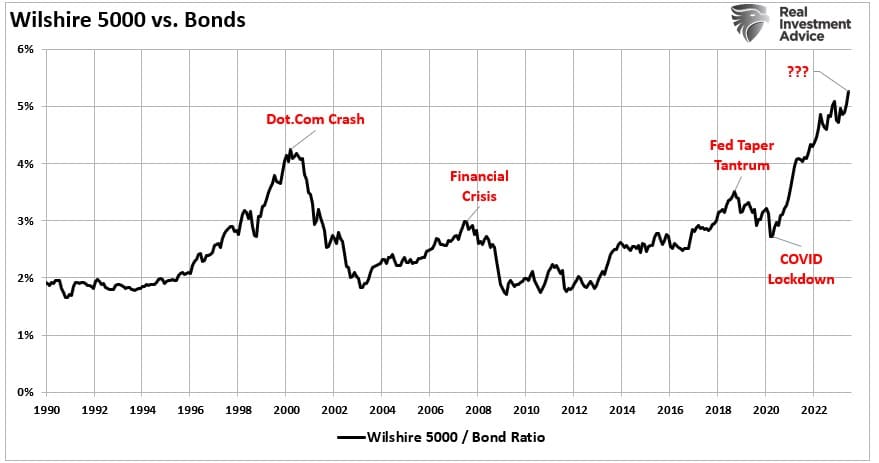
That valuation excess is also seen in the long-term relationship between stocks and bonds. The ratio of stocks to bonds has far exceeded that of the “Dot.com” bubble with a similar sharp slope higher.
“Over the last 150 years, investors faced with CAPE valuations over 30, as they are, were almost always better off buying the ten-year U.S. Treasury.” – Lebowitz
As the analysis shows, bonds are currently very undervalued relative to stocks. As such, the performance pickup over the next 18-24 months will likely be rather significant. Such is particularly the case if the U.S. does slip into a recession or even if economic growth slows below 2%. Both outcomes remain likely possibilities, given the deep inversion of yield curves.
This analysis is also why I doubled my Treasury Bond ETF (TLT) position in my personal investment account this past week. Given that global Central Banks, and Government politicians, can not afford high inflation or a defaulting economic cycle, the pressure to suppress rates will continue to increase. The math provides a clear roadmap for the future. As Michael concluded:
“History, analytical rigor, and logic argue that long-term buy-and-hold investors should shift their allocations from stocks toward bonds. For all other investors, pay close attention to your technical, fundamental, and macroeconomic forecasts, as the outlook for stocks versus bonds over the next ten years is troubling.”
How We Are Trading It
The market can defy economic and fundamental realities longer than logic would suggest. In the short term, the market is a “voting machine.” Therefore, we must rely on our technical measures and indicators to respond to the “votes” of the market herd. However, the market will “weigh’ the fundamental measures and price accordingly over the longer term.
While the awaited breather in the market has begun, the large-cap market remains in control of the bulls for now. The bullish signals suggest an increase in equity risk. However, we need a set of rules to navigate whatever happens next.
- Cut losers short and let winners run.
- Set goals and be actionable. (Without specific goals, trades become arbitrary and increase overall portfolio risk.)
- Emotionally driven decisions void the investment process. (Buy high/sell low)
- Follow the trend. (The long-term, monthly trend determines 80% of portfolio performance.)
- Never let a “trading opportunity” turn into a long-term investment. (Refer to rule #1. All initial purchases are “trades” until your investment thesis is proved correct.)
- An investment discipline does not work if it is not followed.
- The odds of success improve significantly when the technical price action confirms the fundamental analysis.
- Markets are either “bullish” or “bearish.” During a “bull market,” be only long or neutral. During a “bear market,” be only neutral or short. (Bull and Bear markets are determined by their long-term trend)
- When markets are trading at, or near, extremes do the opposite of the “herd.”
- Do more of what works and less of what doesn’t (Traditional rebalancing takes money from winners and adds it to losers. Rebalance by reducing losers and adding to winners.)
Set aside the idea of being “bullish” or “bearish.” Once you pick a side, you lose objectivity to what is occurring within the market. Eventually, the fundamentals will re-emerge, and we will have plenty of warning to adjust accordingly.
Such is the point where we are today. The technical improvements in the market suggest investors should be buying. It’s hard, I know. However, until the technical backdrop tells us differently, we continue to “buy dips.”
Have a great weekend.
Research Report

Subscribe To “Before The Bell” For Daily Trading Updates
We have set up a separate channel JUST for our short daily market updates. Please subscribe to THIS CHANNEL to receive daily notifications before the market opens.
Click Here And Then Click The SUBSCRIBE Button
Subscribe To Our Youtube Channel To Get Notified Of All Our Videos
Bull Bear Report Market Statistics & Screens

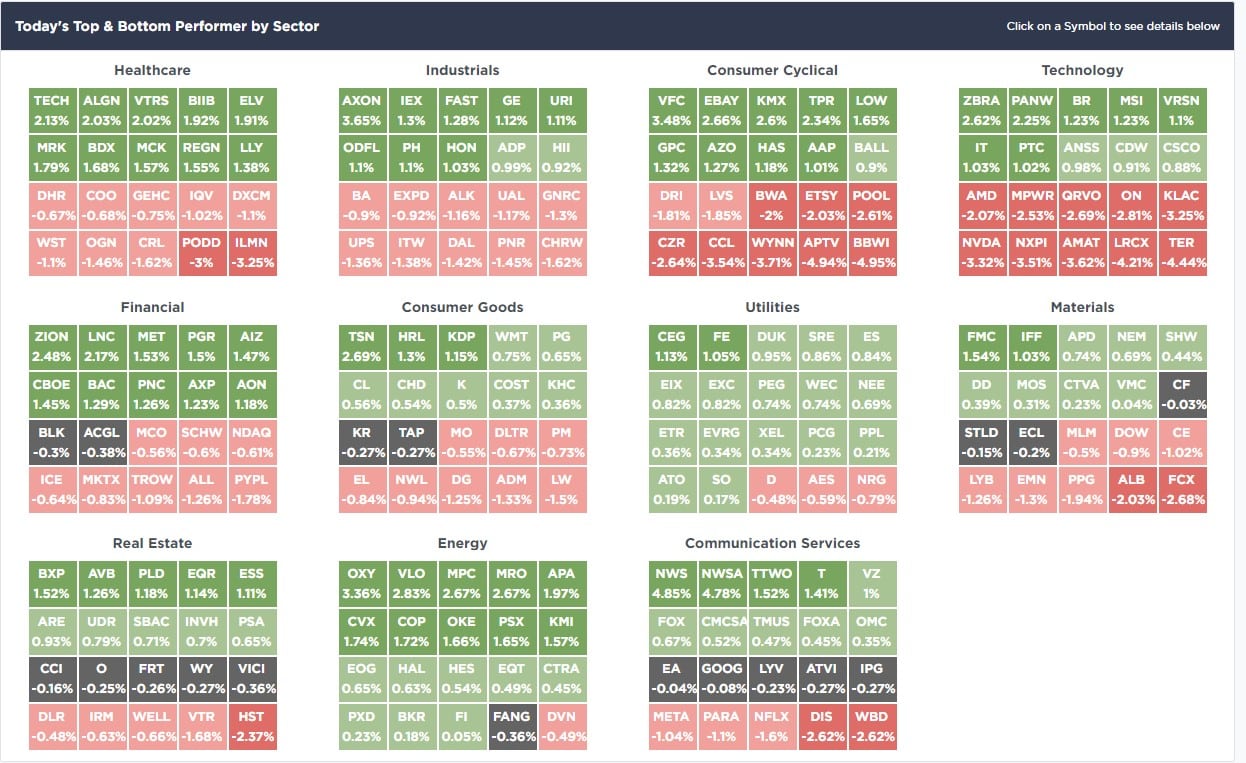
SimpleVisor Top & Bottom Performers By Sector
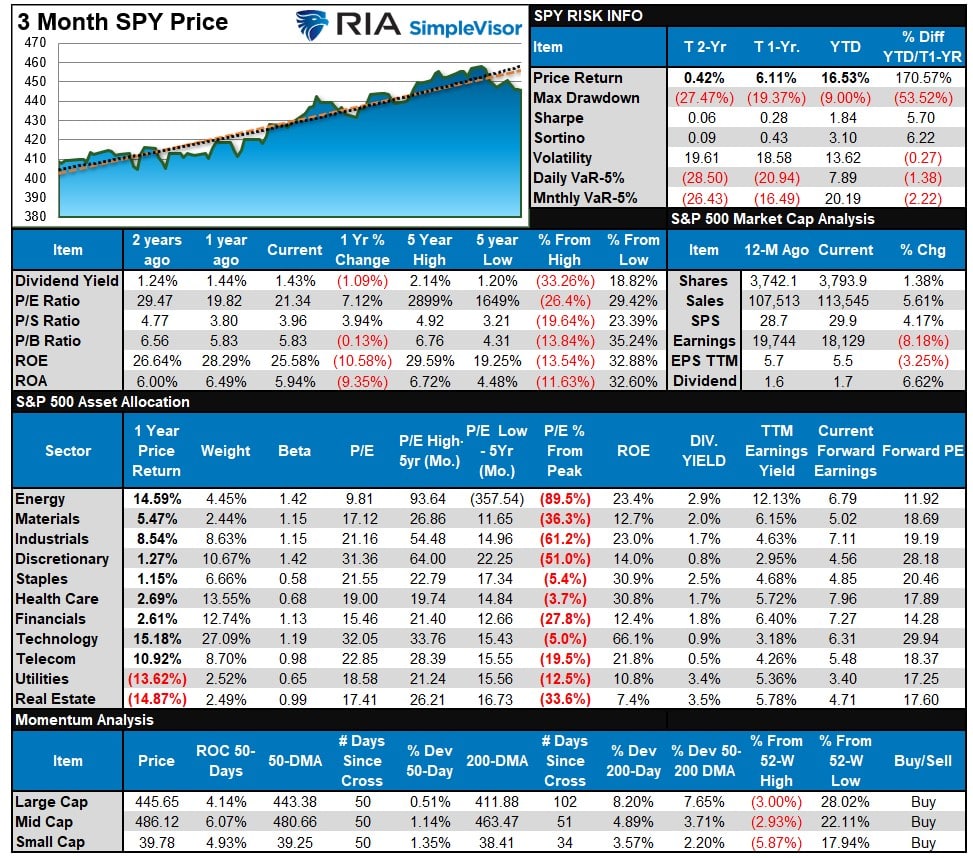
S&P 500 Weekly Tear Sheet
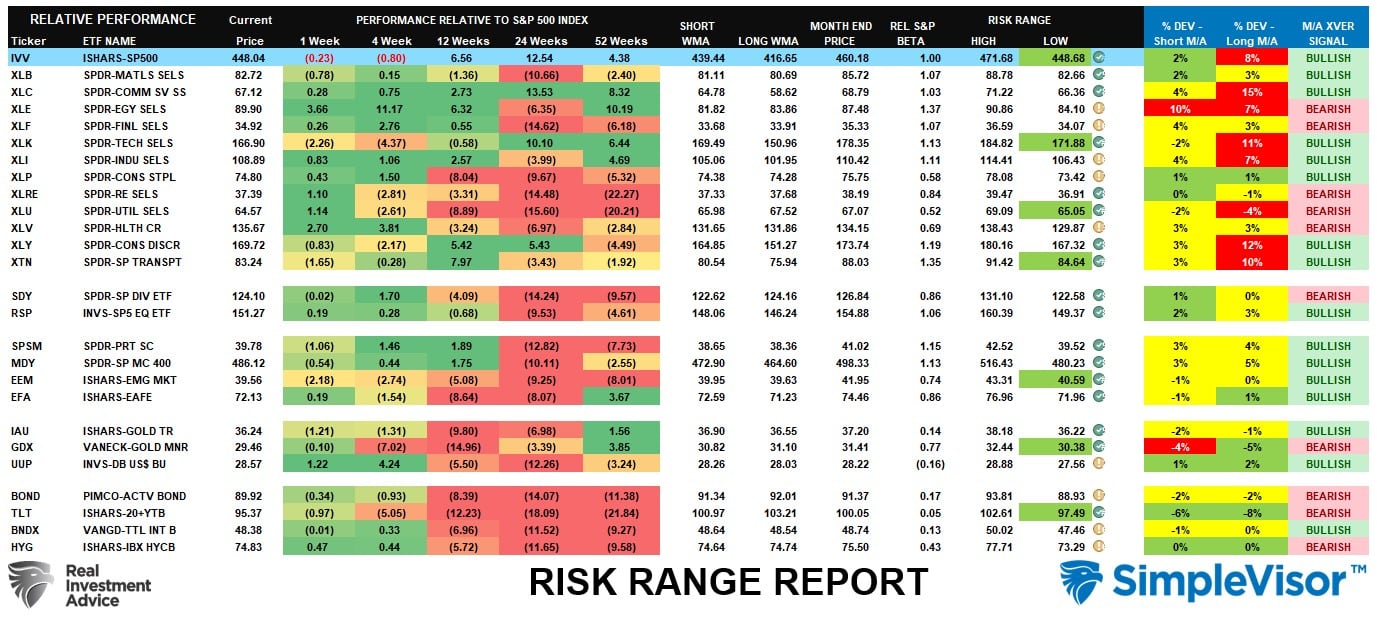
Relative Performance Analysis
As noted last week:
“That correction started this past week and is not complete yet. However, many of the previous leading sectors are short-term oversold, and a bounce to challenge short-term resistance should not be surprising. Use bounces to rebalance exposures as needed and look for a correction to the 50-DMA as the most likely support.”
As expected, the market bounced to the 20-DMA early in the week and tested the 50-DMA on Friday. Therefore, several markets and sectors are sufficiently oversold for a bounce next week. We most likely are not done with this current corrective process. Therefore, continue using rallies to rebalance risks accordingly.
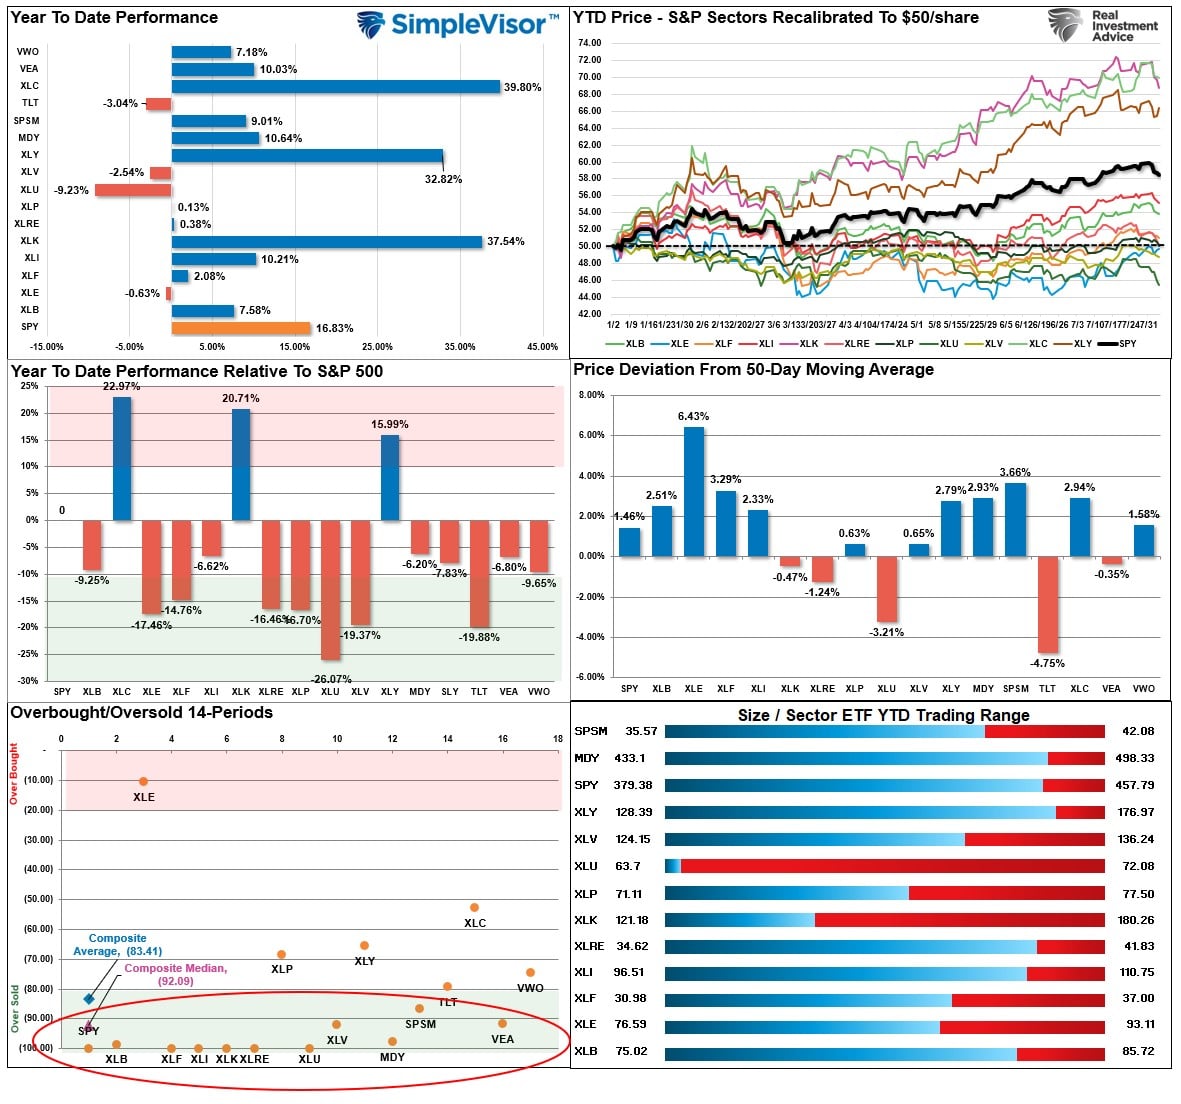
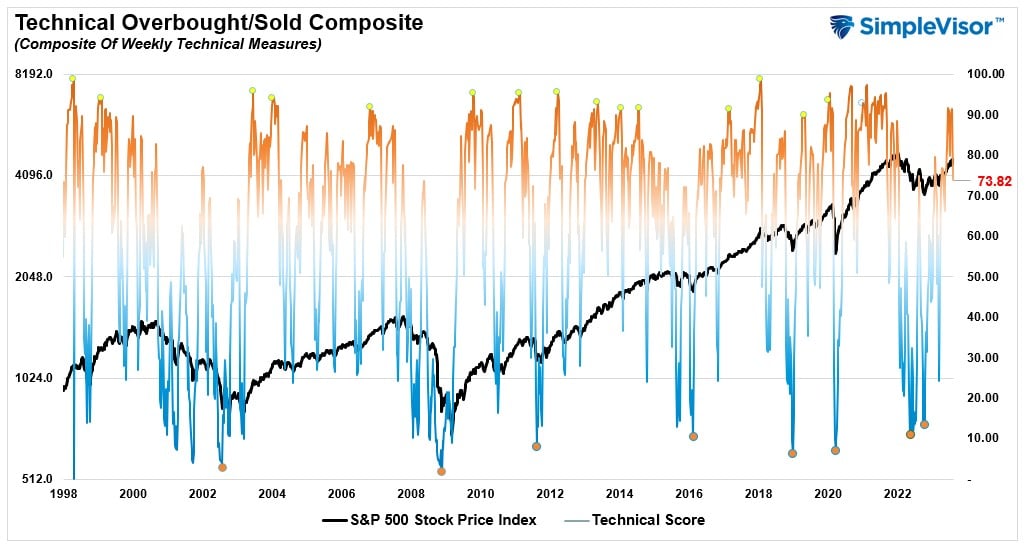
Technical Composite
The technical overbought/sold gauge comprises several price indicators (R.S.I., Williams %R, etc.), measured using “weekly” closing price data. Readings above “80” are considered overbought, and below “20” are oversold. The market peaks when those readings are 80 or above, suggesting prudent profit-taking and risk management. The best buying opportunities exist when those readings are 20 or below.
The current reading is 73.82 out of a possible 100.
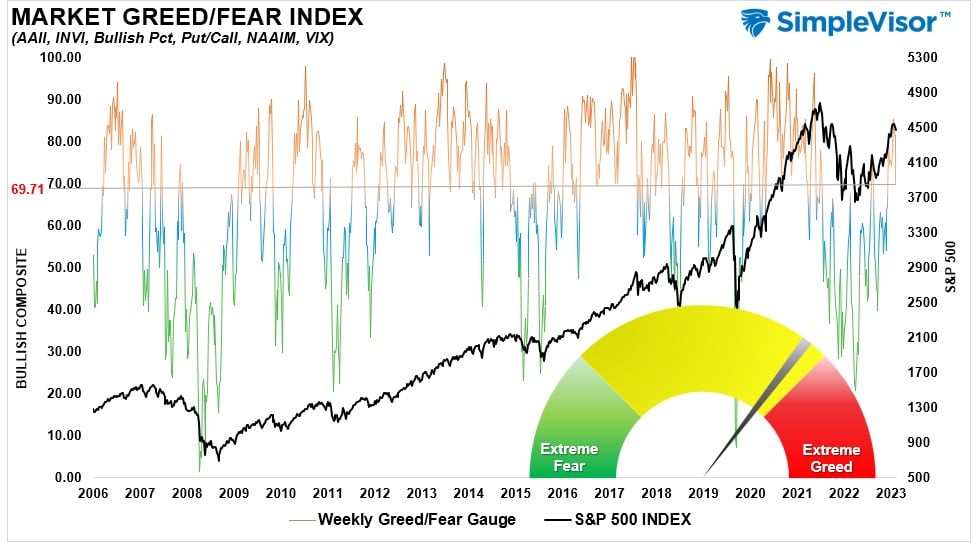
Portfolio Positioning “Fear / Greed” Gauge
The “Fear/Greed” gauge is how individual and professional investors are “positioning” themselves in the market based on their equity exposure. From a contrarian position, the higher the allocation to equities, the more likely the market is closer to a correction than not. The gauge uses weekly closing data.
NOTE: The Fear/Greed Index measures risk from 0 to 100. It is a rarity that it reaches levels above 90. The current reading is 69.71 out of a possible 100.
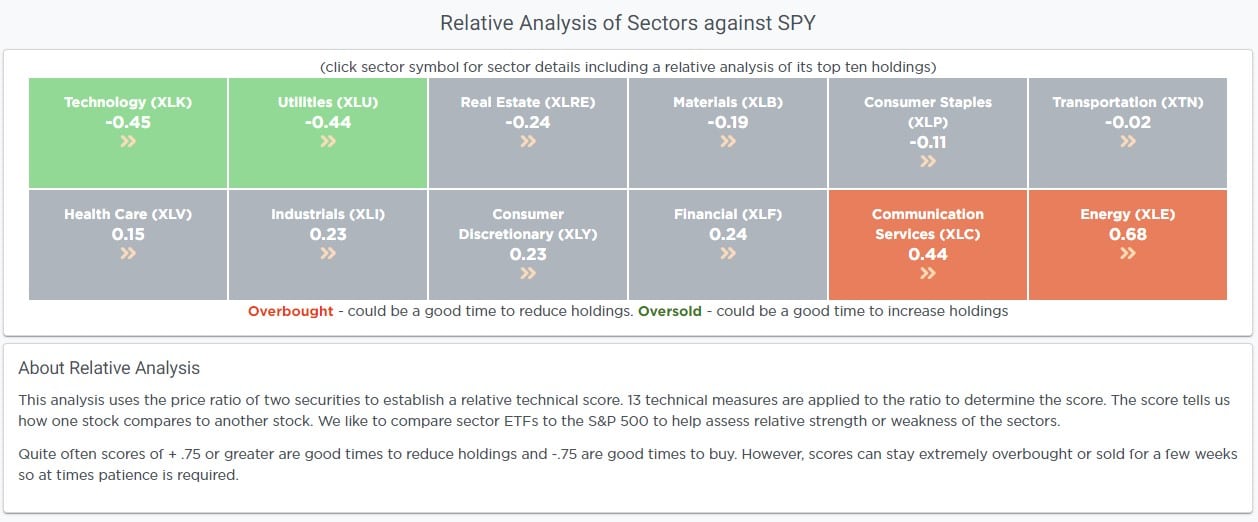
Relative Sector Analysis
Absolute Sector Analysis
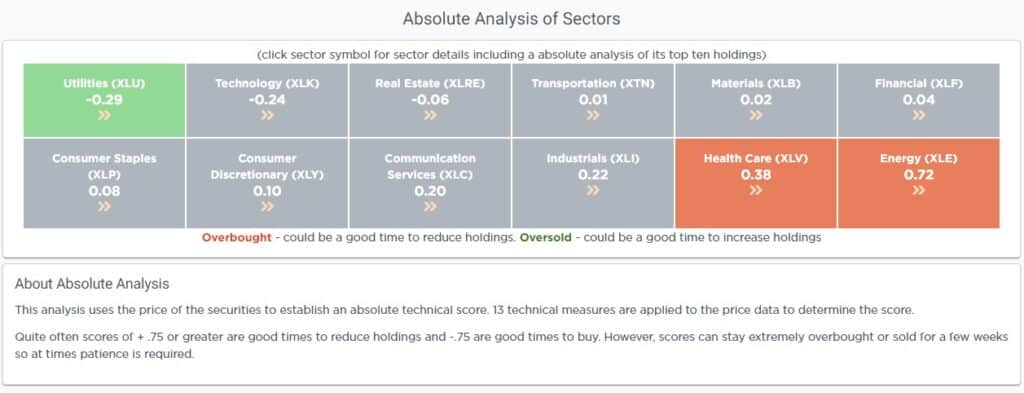
Sector Model Analysis & Risk Ranges
How To Read This Table
- The table compares the relative performance of each sector and market to the S&P 500 index.
- “MA XVER” (Moving Average Cross Over) is determined by the short-term weekly moving average crossing positively or negatively with the long-term weekly moving average.
- The risk range is a function of the month-end closing price and the “beta” of the sector or market. (Ranges reset on the 1st of each month)
- The table shows the price deviation above and below the weekly moving averages.
As noted last week,
“We could get a little equity rally early next week, which should likely be used to rebalance equity exposures before a further correction to the 50-DMA.”
Such is what happened as the market rallied to the 20-DMA, failed, and tested the 50-DMA on Friday. Therefore, with the broad market short-term oversold, look for a rally next week. Furthermore, Bonds and Utilities, Real Estate, and the Dollar remain deeply oversold. Use rallies to continue to rebalance risk short-term until the market begins to reverse its current “sell” signals.
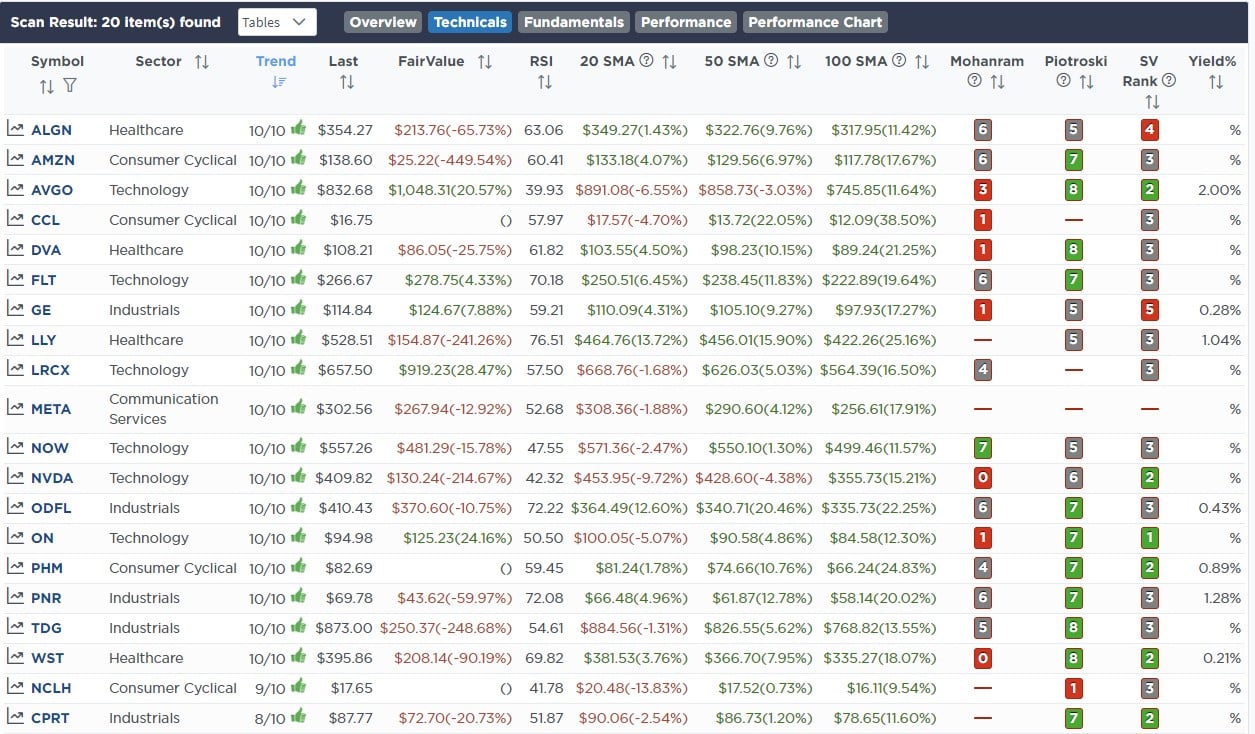
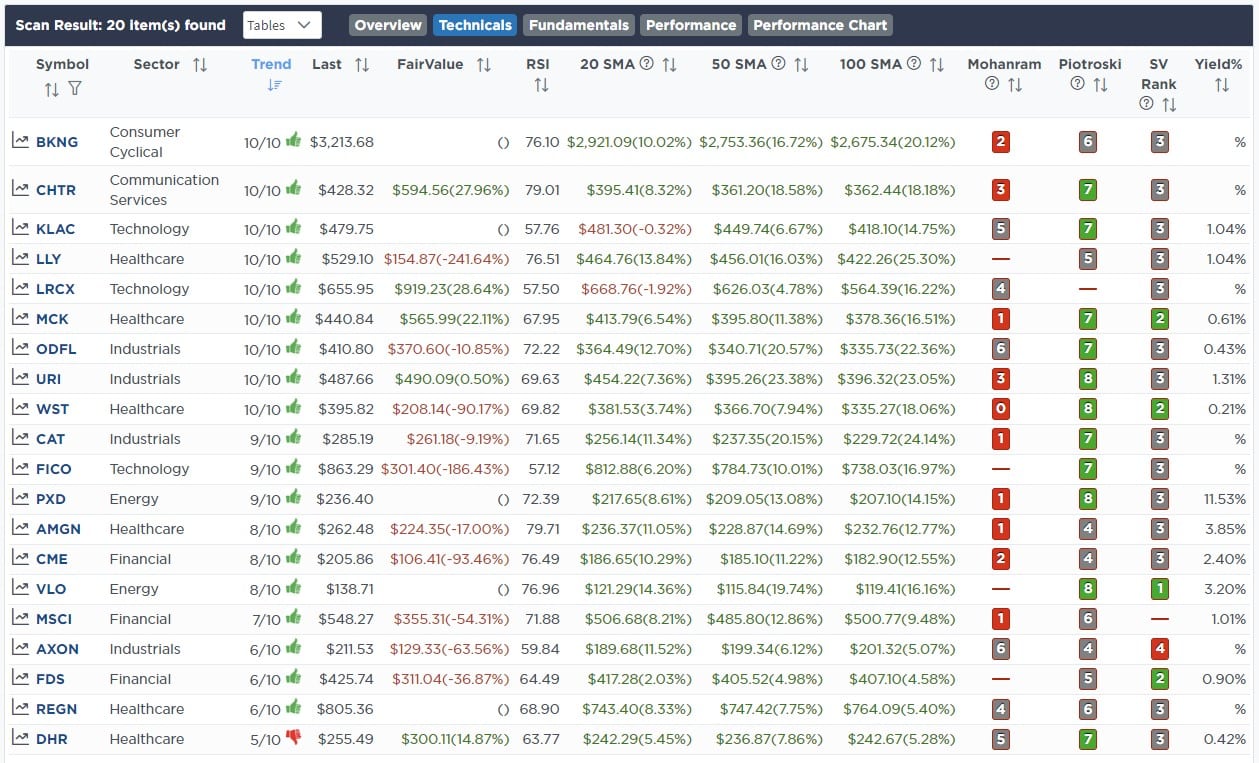
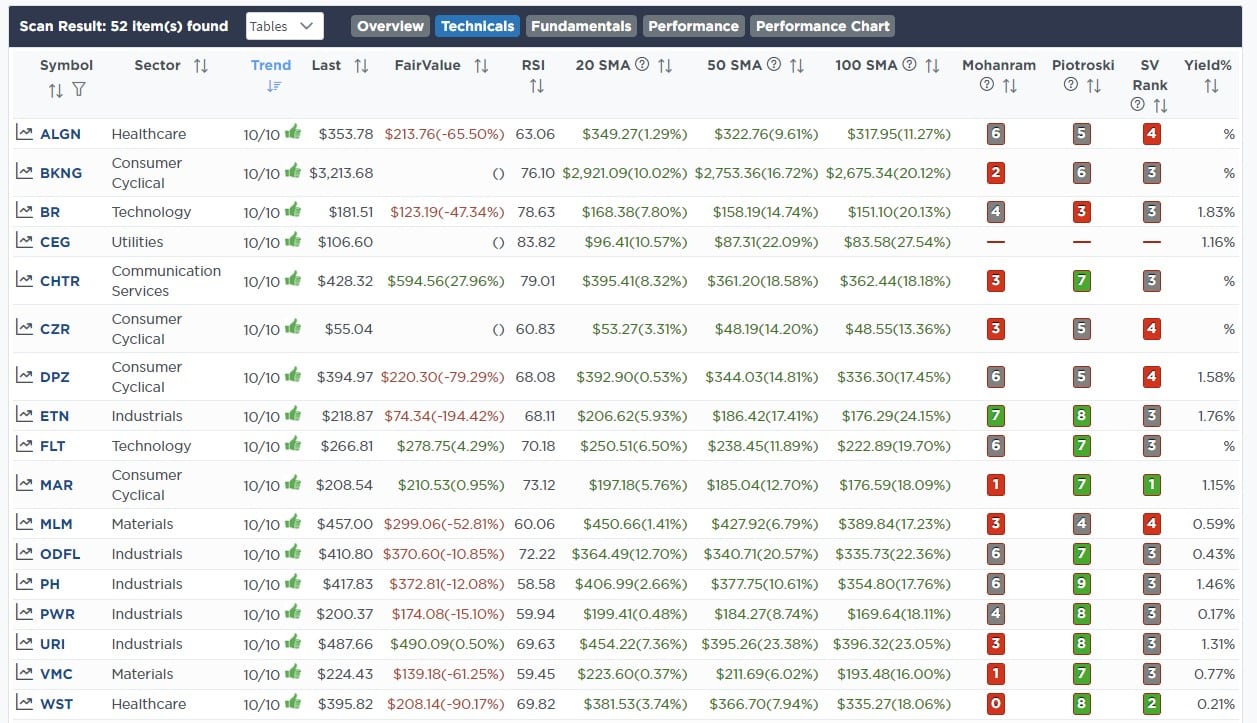
Weekly SimpleVisor Stock Screens
We provide three stock screens each week from SimpleVisor.
This week we are searching for the Top 20:
- Relative Strength Stocks
- Momentum Stocks
- Fundamental & Technical Strength
(Click Images To Enlarge)
R.S.I. Screen
Momentum Screen
Fundamental & Technical Strength
SimpleVisor Portfolio Changes
We post all of our portfolio changes as they occur at SimpleVisor:
August 9th
This morning we added 1% of Apple to the equity model. The stock is down about 10% in the last week or nearing a good buy trigger on the MACD and money flow. We have been patiently waiting to add exposure, so with Apple at two-month lows, our patience has paid off. We are holding off adding to XLK as the technical opportunity is not quite the same yet.
Equity Model
- Add 1% of the portfolio to Apple (AAPL), increasing position size to 3.5%.

Lance Roberts, C.I.O.
Have a great week!

