Estimating 2023 S&P 500 Price Targets


Inside This Week’s Bull Bear Report
- Market Sells Off To Support, Can It Hold?
- Estimating 2023 Price Targets
- How We Are Trading It
- Research Report – Will A Dollar Decline Be Good For Stocks?
- Youtube – Weekly Market Review With Adam Taggart
- Stock Of The Week
- Daily Commentary Bits
- Market Statistics
- Stock Screens
- Portfolio Trades This Week
Market Sells Off To Support
It’s that time of year when everyone starts estimating price targets for the New Year. However, let’s recap this week’s market action starting with where we left off last week.
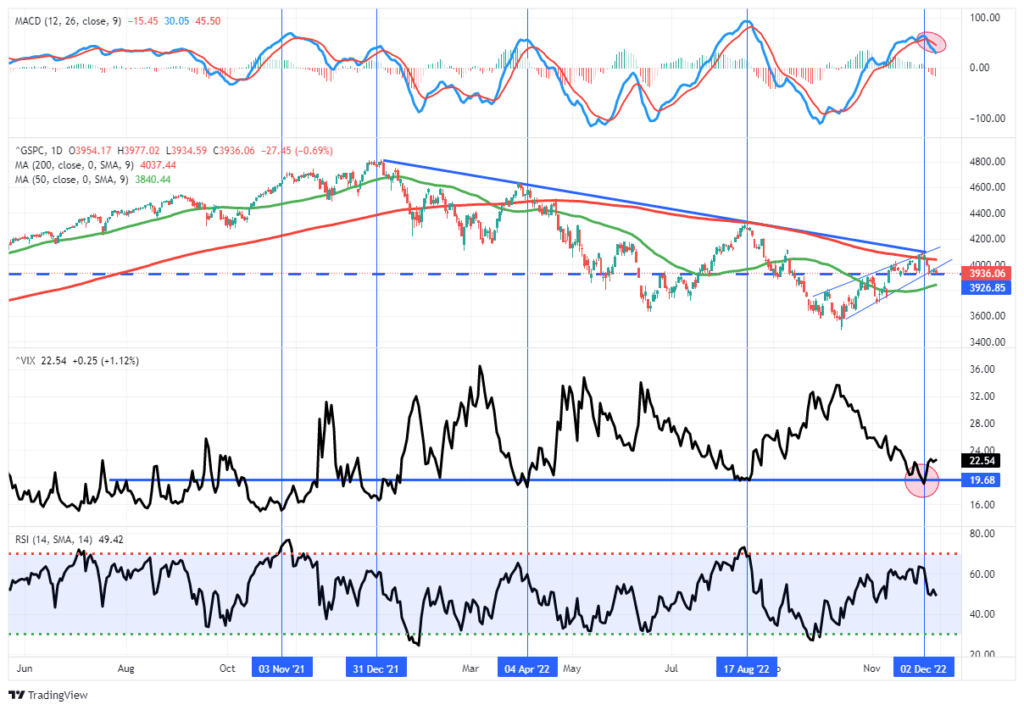
“The market rally sent the volatility index below 20, which has historically denoted market peaks rather than the beginning of a bullish rally. However, Friday, the stronger-than-expected jobs report hit the market, but it hung onto support at the 200-dma. If the market can look past the employment report next week and rally, we will have a successful first test of the 200-dma as support.”
Unfortunately, the market did NOT look past the more robust jobs support, as Nick Timaros suggested the Federal Reserve will remain aggressive in its inflation-fighting campaign. To wit:
“Federal Reserve officials have signaled plans to raise their benchmark interest rate by 0.5 percentage point at their meeting next week. However, elevated wage pressures could lead them to continue lifting it to higher levels than investors expect.
…brisk wage growth or higher inflation in labor-intensive service sectors of the economy could lead more of them to support raising their benchmark rate next year above the 5% anticipated by investors.“
Not surprisingly, that hawkish language took the “wind out of the bull’s sails,” sending the market back below the 200-DMA. The market held support at the 100-DMA but broke the 3950 support level, which triggered selling late yesterday afternoon. That selling pushed the MACD “sell” signal lower, suggesting the market may struggle between now and next week’s FOMC meeting. Furthermore, due to wage growth, there is a risk of a hotter-than-expected CPI report on Tuesday.
We remain risk-averse until we get a better opportunity to increase equity risk.
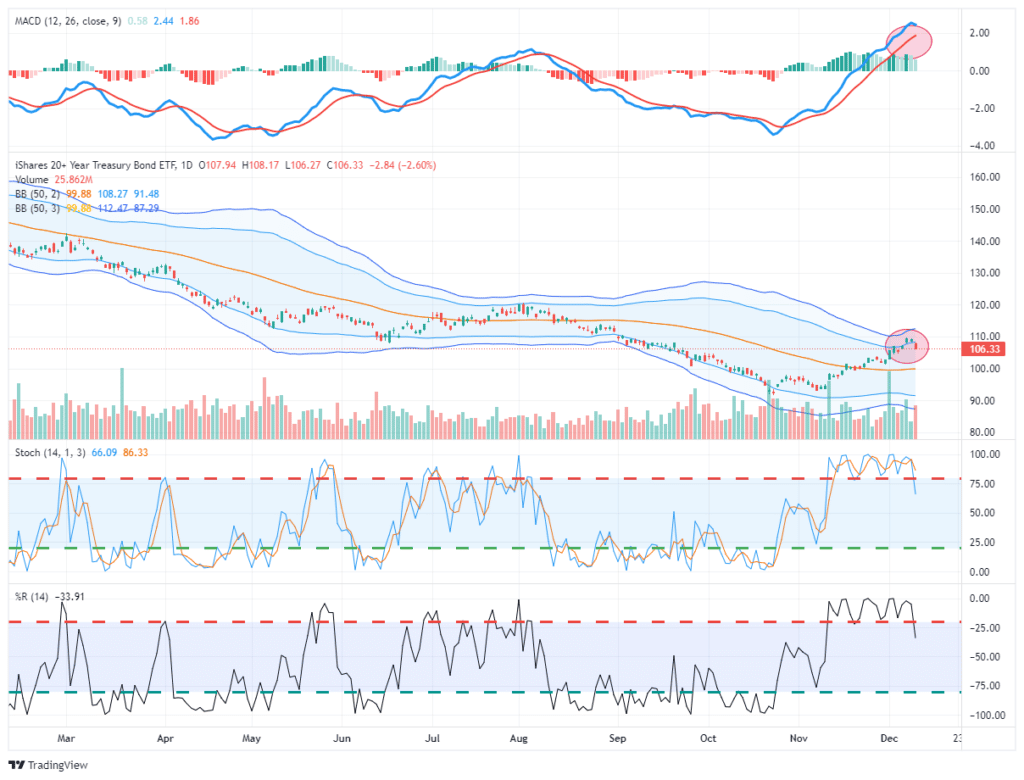
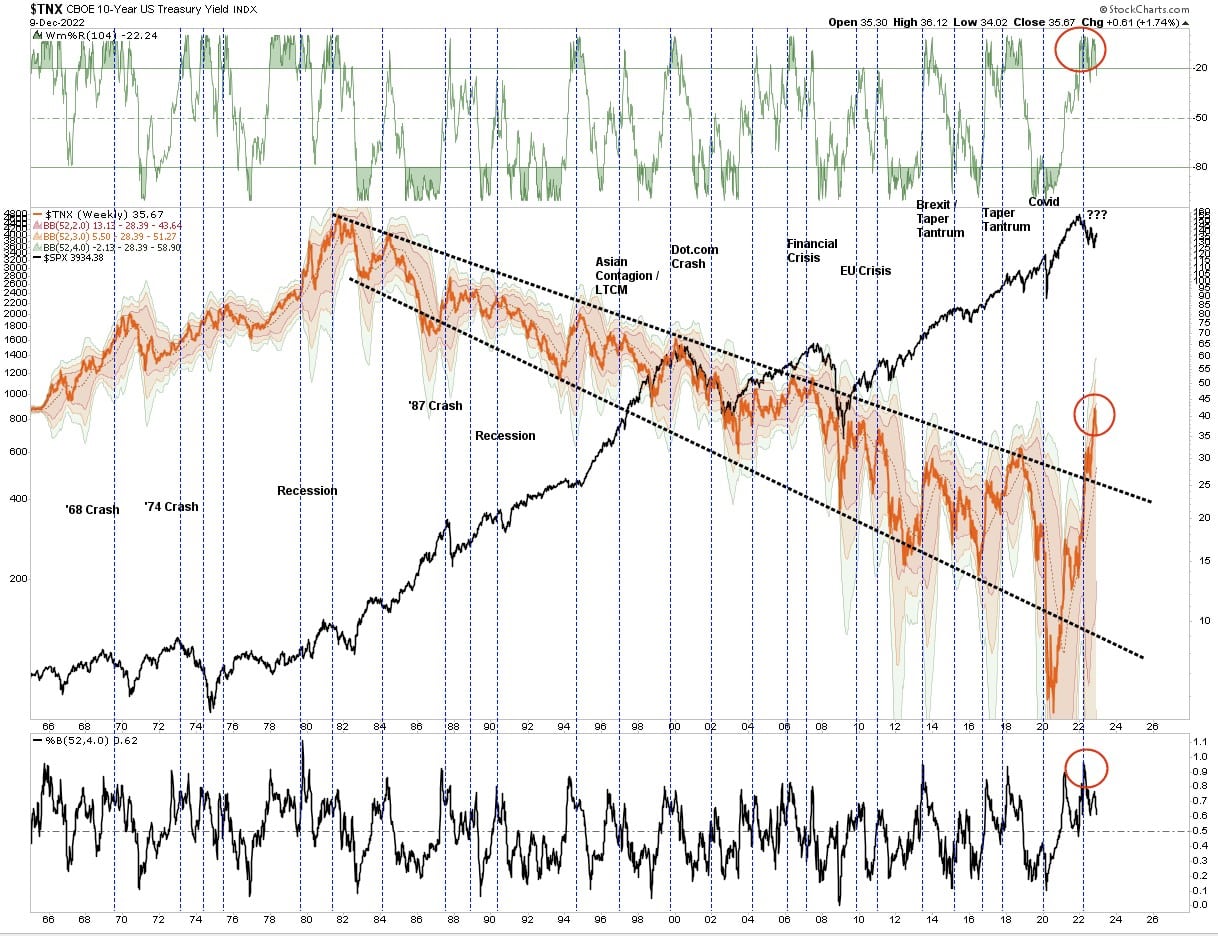
Also, as noted last Monday, Treasury Bonds had a huge move over the last couple of weeks and are now extremely overbought and extended. Most likely, this bond rally is due to portfolio rebalancing for year-end reporting. I expect a pullback in bond prices early next year to provide a better entry point to increase our bond duration in portfolios. Be patient for now.
Of course, as we approach the end of the year, all eyes turn to 2023 with optimistic hopes of a better year than the last. Such is where estimating market targets becomes an annual Wall Street event. As we will discuss, no one has any idea what next year holds. However, the math of valuations can tell us much about the risks we need to consider.
Need Help With Your Investing Strategy?
Are you looking for complete financial, insurance, and estate planning? Need a risk-managed portfolio management strategy to grow and protect your savings? Whatever your needs are, we are here to help.

Estimating 2023 Price Targets For The S&P 500
Estimating price targets for the next full trading year is an exercise in futility. Too many variables, from politics to economics to monetary and fiscal policies, can impact market outcomes at a moment’s notice. However, we can build some ranges based on current valuations when estimating possible and probable returns for the following year.
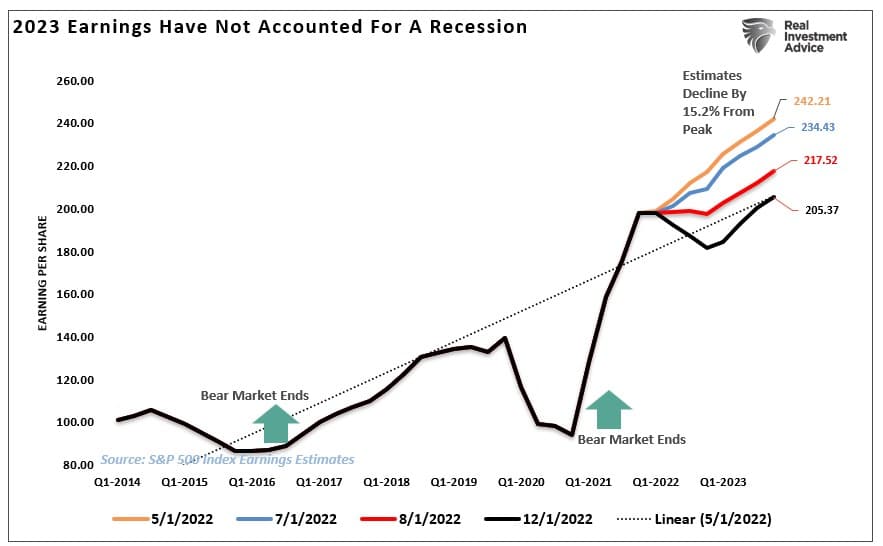
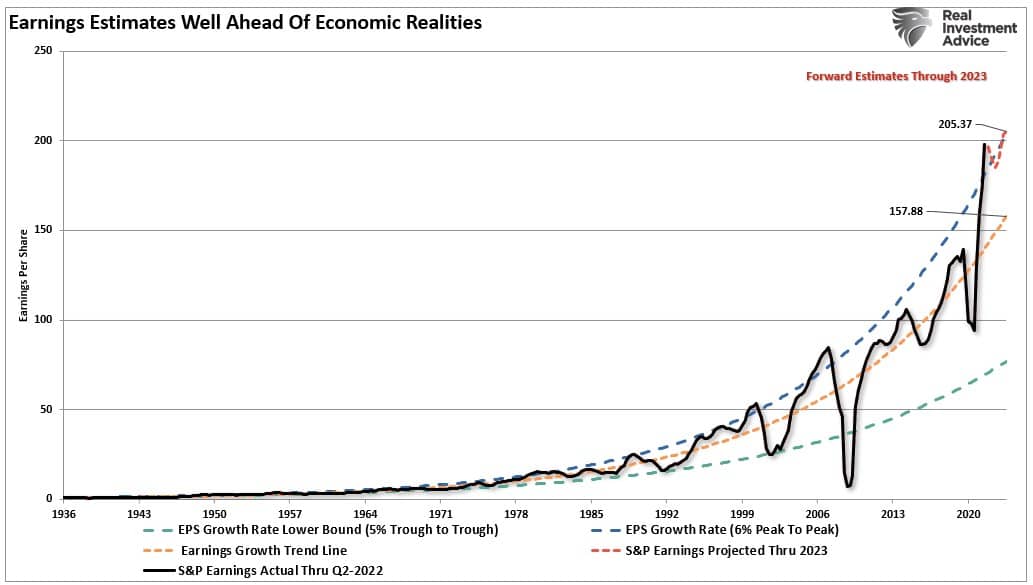
As discussed previously, using FORWARD operating earnings for any analysis is flawed. The reason is that forward operating earnings today will not be at the same level in the future. Since May 2022, forward earnings estimates have already declined 15%, and we suspect they will fall further next year, making all forward valuation assumptions unreliable.
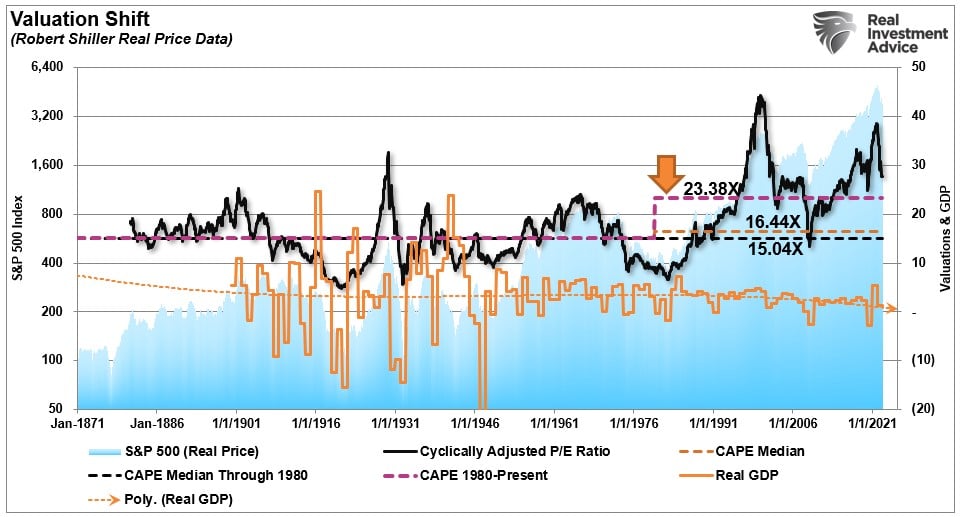
Therefore, we need to use trailing earnings when estimating forward market returns, as they remain static. When looking at historical valuation levels, a shift higher in median valuations occurred as the Federal Reserve became active in monetary policy. The long-term historical median valuation from 1871 to 1980 is 15.04x earnings. When including 1980 to the present, that long-term media rose to 16.44x earnings. However, as the monetary and fiscal policies employed kept “mean-reverting” events from happening, valuations jumped to 23.38x earnings since 1980.
This analysis gives us three baselines for estimating next year’s potential return ranges. We will have to make several assumptions:
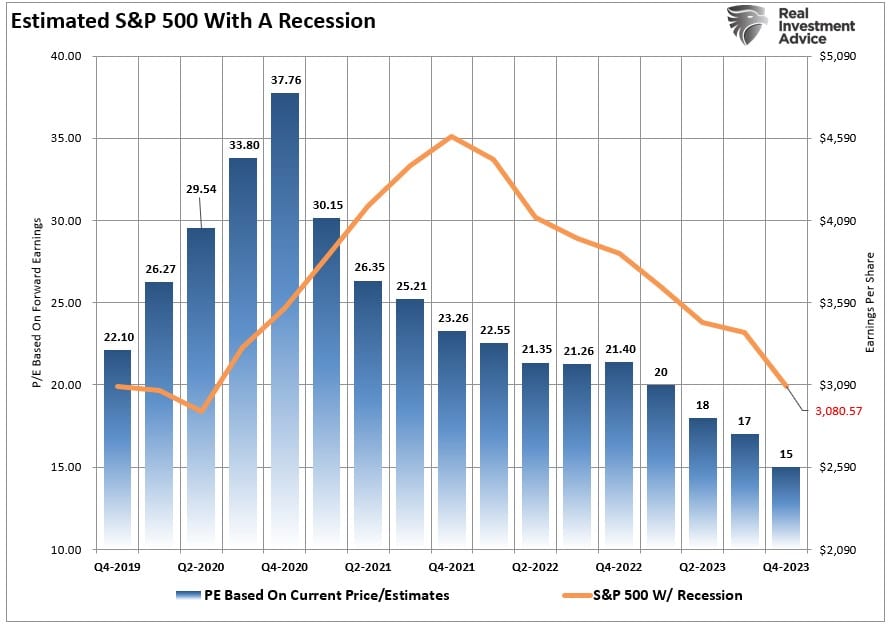
- We will use Wall Street’s current earnings estimates for both scenarios of $205/share.
- In a “Recession” scenario, we would expect $160/share earnings, equating to a reversion to the growth trend. (Shown below). However, for this exercise, we will use $205/share as the baseline and use “valuation multiples” to adjust for outcomes.
- We will use Wall Street’s estimates for fair value at 17x earnings for a “No Recession” scenario and 15x for a “Recession” outcome.
As noted, the current earnings estimates for 2023 remain well above the long-term historical 6% peak-to-peak earnings trend throughout history. It is exceedingly difficult not to expect a sharp reversion in earnings in a “recessionary” outcome, but for the purpose of this exercise, we will remain focused on valuation differentials.
Estimating The Outcomes
The problem with current forward estimates is that several factors must exist to sustain historically high earnings growth.
- Economic growth must remain stronger than the average 20-year growth rate.
- Wage and labor growth must reverse to sustain historically elevated profit margins, and,
- Both interest rates and inflation must reverse to very low levels.
While such is possible, the probabilities are low, as strong economic growth can not exist in a low inflation and interest-rate environment.
However, with that said, we can use the current forward estimates, as shown above, to estimate both a recession and non-recession price target for the S&P 500 as we head into 2023.
In the non-recession scenario, the assumption is that valuations will fall to 17x earnings over the next year. If such is the case, based on current estimates, then the S&P 500 should theoretically trade at roughly 3500. Given the market is trading at approximately 4000, such would imply a 12.5% decline from current levels.

However, should the economy slip into a recession and valuations revert to the longer-term median of 15x earnings, such would imply a level of 3100.
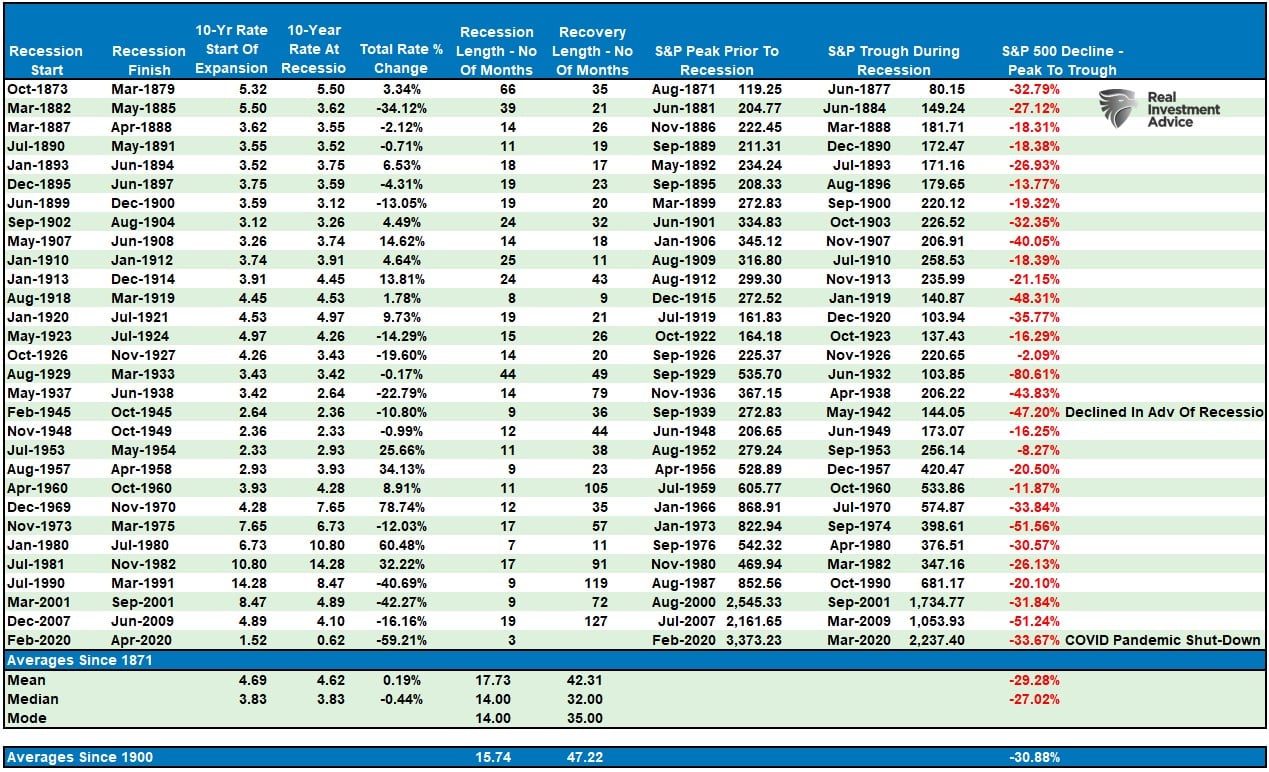
While an additional 22.5% decline from current levels seems hostile, such would align with typical recessionary bear markets throughout history.
The chart below plots both paths for the S&P 500 for a better visual.
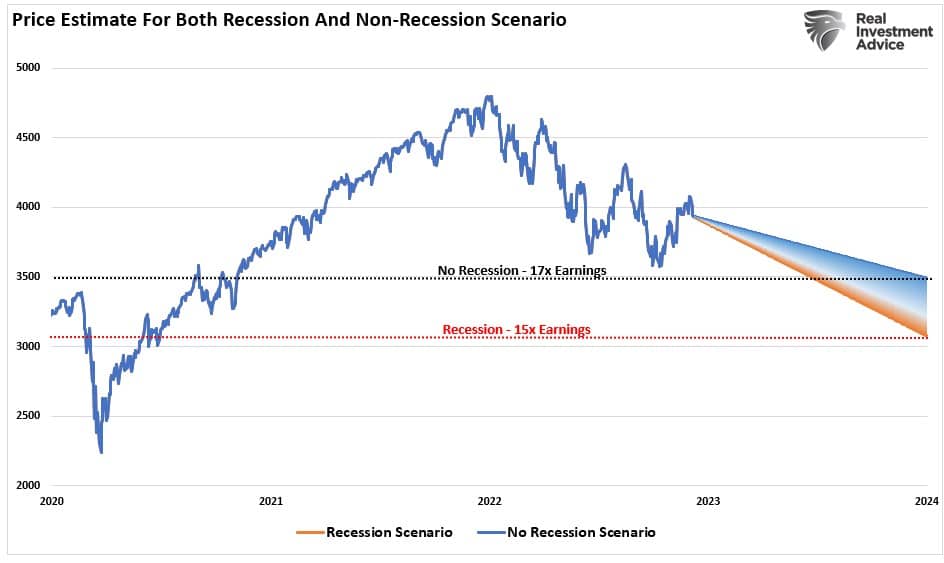
Optimistically, the market’s lows are already made, and a retest next year will bring valuations down to 17x earnings. Pessimistically, a recession will pull the market below the 2019 peak and revert valuations to 15x earnings.
As stated, many things can occur when estimating future price targets. However, based on current earnings estimates and historical median valuations, both cases suggest poor returns over the next 12 months.
That is just the math.
Is A Recession Inevitable
As stated, we must make many assumptions when estimating forward price targets. While the “no recession” case is possible, we struggle with that view.
With the Federal Reserve committed to continued rate hikes in 2023, reducing market liquidity through Quantitative Tightening, and the consumer struggling to make ends meet, the risk of a recession seems quite elevated.
However, if employment remains strong, unemployment doesn’t rise, and wages continue to rise to offset inflation pressures, then it is possible to avoid a recession. The problem is that strong employment and wage growth will add to inflationary pressures. Of course, that is what the Federal Reserve is actively trying to resolve.
A recession seems highly probable if the Fed’s end game is higher unemployment and lower inflation through higher interest rates, which will ultimately slow wage growth. The economic data already seems well tilted into a recessionary trend. However, the composite economic index declines further during a recession, suggesting a deeper reversion in the stock market.

In our view, the risk seem tilted toward weaker economic outcomes, given the Fed’s ongoing monetary tightening. However, as we have stated previously, the Fed will reverse course when something eventually breaks.
The bullish expectation is that when the Fed finally makes a “policy pivot,” such will end the bear market. While that expectation is not wrong, it may not occur as quickly as the bulls expect. Historically, when the Fed cuts interest rates, such is not the end of equity “bear markets,” but rather the beginning. Such is shown in the chart below of previous “Fed pivots.”
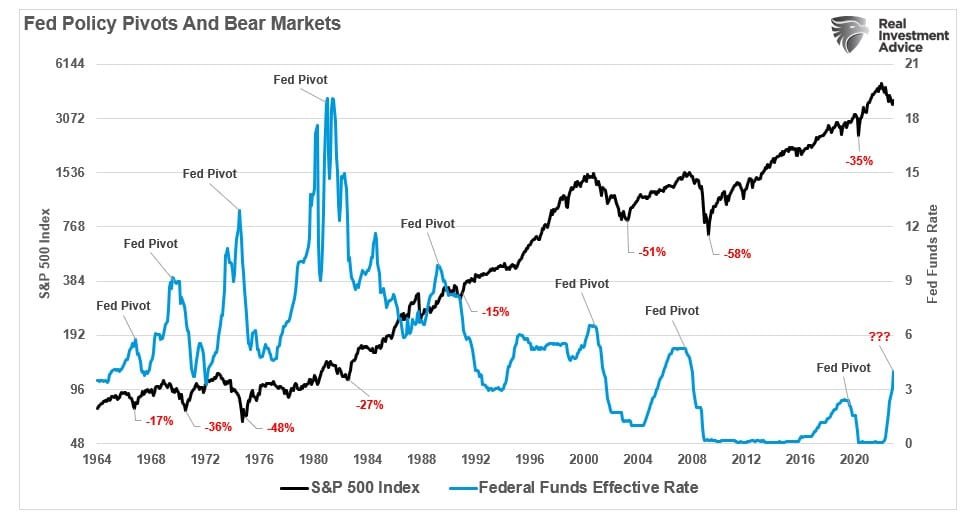
Notably, most “bear markets” occur AFTER the Fed’s “policy pivot.”
The reason is that the policy pivot comes with the recognition that something has broken either economically (aka “recession”) or financially (aka “credit event”). When that event occurs, and the Fed initially takes action, the market reprices for lower economic and earnings growth rates.
Such is why we continue to remain cautious for now.
The time to be bullish again will come. However, it is most often best recognized after the bottom gets made.
Not Getting The Bull Bear Report Each Week In Your Mailbox? Subscribe Here For Free.
How We Are Trading It
As noted last week, the “risk on” chase was quite extended, with markets back to more overbought levels. This week, that reversal came, and after reducing our equity exposure over the last couple of weeks, there was little action for us to take.
We are currently maintaining our bond exposure as the recent drop in yields, and surge in bond prices, was most likely a function of year-end portfolio rebalancing. As shown in the chart below, we suspect we will see a reversal in yields higher before the actual top occurs early next year. There are several reasons for this. Notably, yields will not fall aggressively until inflation, and economic growth weakens markedly. That is coming, but most likely in Q2 of next year.
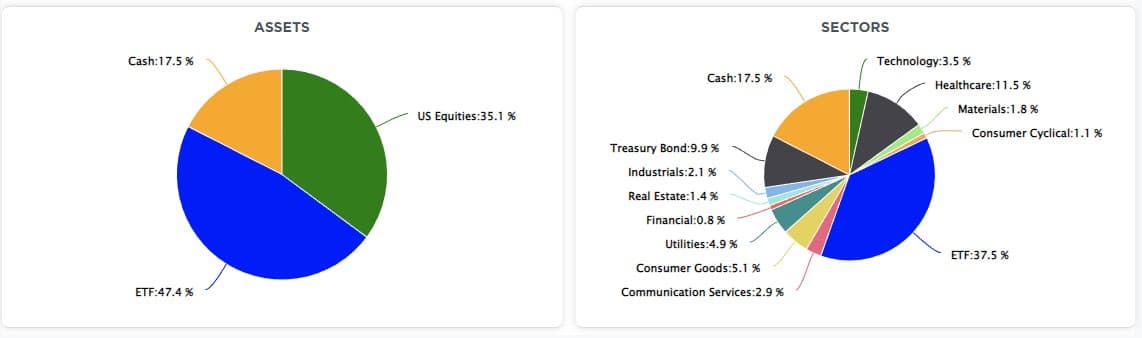
Despite the recent push higher above the 200-DMA, we continued to promote caution and profit-taking. Such remains the case this week as well. With the Federal Reserve on deck next week, we think Powell will deliver a more “hawkish” statement to prevent another misreading by the stock market of their policy intent. We are maintaining our much-reduced equity exposure and overweight cash and bond holdings. (The ETFs are all fixed income of different durations.)
Last week, I concluded by stating:
“The risk of a correction is rising. We suggest continuing to follow our portfolio management guidelines for now and that you take some action if you have not done so as of yet.”
That continues to be the message again this week.
- Tighten up stop-loss levels to current support levels for each position.
- Hedge portfolios against significant market declines.
- Take profits in positions that have been big winners
- Sell laggards and losers. Raise cash and rebalance portfolios to target weightings.
See you next week.
Research Report
Weekly Market Recap With Adam Taggart
Subscribe To Our Youtube Channel To Get Notified Of All Our Videos
Stock Of The Week In Review
Five Closed-End Funds For Bond Bulls Redux
This week’s Five for Friday report seeks to profit from lower bond yields in a unique way that offers higher potential returns than most individual bonds and open-end bond funds. In this screen, we look at Closed-End Fixed Income Mutual Funds (CEFs) for opportunities to take advantage of their leverage and price discounts to their respective NAVs. Leverage and discounts allow for more significant price gains and higher yields than individual bonds.
For more information on CEFs and why they might present an excellent opportunity if bond yields decline, we share- Bond Bull Market Coming? Take The Road Less Traveled. While the article is dated, it summarizes the potential benefits and risks of holding CEFs.
Screening Criteria
- Fixed Income CEF- Predominately Investment Grade: Corporate, Treasury, and Asset/Mortgage-Backed
- Leverage >25%
- Discount to NAV -5% or more
- Distribution rate >6%
- Age of Fund >20 years
Here is a link to the full SimpleVisor Article For Step-By-Step Screening Instructions.
JMM – Nuveen Multi-Market Income Fund
The Fund’s objective is to provide high monthly income consistent with prudent risk to capital. The Fund will invest primarily in debt securities, including, but not limited to, U.S. agency and privately issued mortgage-backed securities, corporate debt securities, and asset-backed securities. At least 65% of the Fund’s total assets must get invested in securities that are rated investment-grade or comparable quality at the time of purchase.

Login to Simplevisor.com to read the full 5-For-Friday report.
Daily Commentary Bits
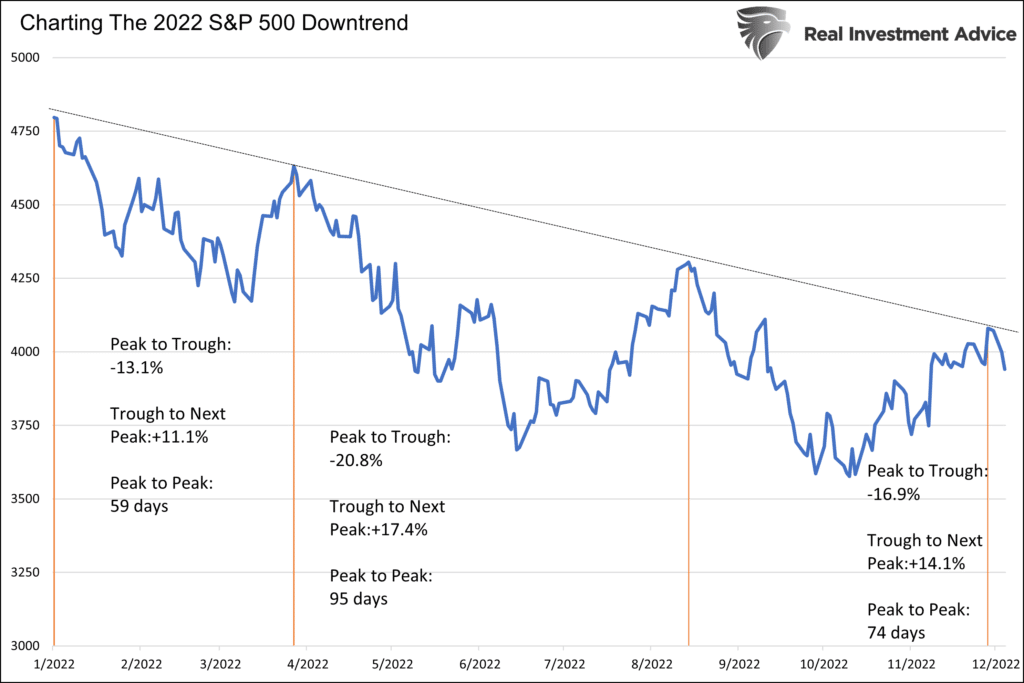
The Next Leg of the 2022 Downtrend
As we think about what 2023 may hold in store for stocks, it’s worth looking at the 2022 downtrend in the S&P 500. As we show, the market has gone through a series of declines and rebounds. The black resistance line defines the peak of each rebound. Each of this year’s three cycles has lasted between two and three months. Possibly most interesting, the rebound in all three cycles has been nearly identical. In each case, the bounce recaptured between 83% to 85% of the initial decline.
If the S&P 500 continues to repeat this cycle, we should expect this latest downturn to bottom below the prior trough. That low will probably not occur until February or March. At that time, a rally should kick off, which could recoup about 85% of the decline. We heavily caution cycles like this work until they don’t. The current decline may be much steeper than the prior one and may not rebound like the other cycles. Conversely, the recent sell-off may only last a week or two before the price breaks above the trend line.
Click Here To Read The Latest Daily Market Commentary (Subscribe For Pre-Market Email)
Bull Bear Report Market Statistics & Screens

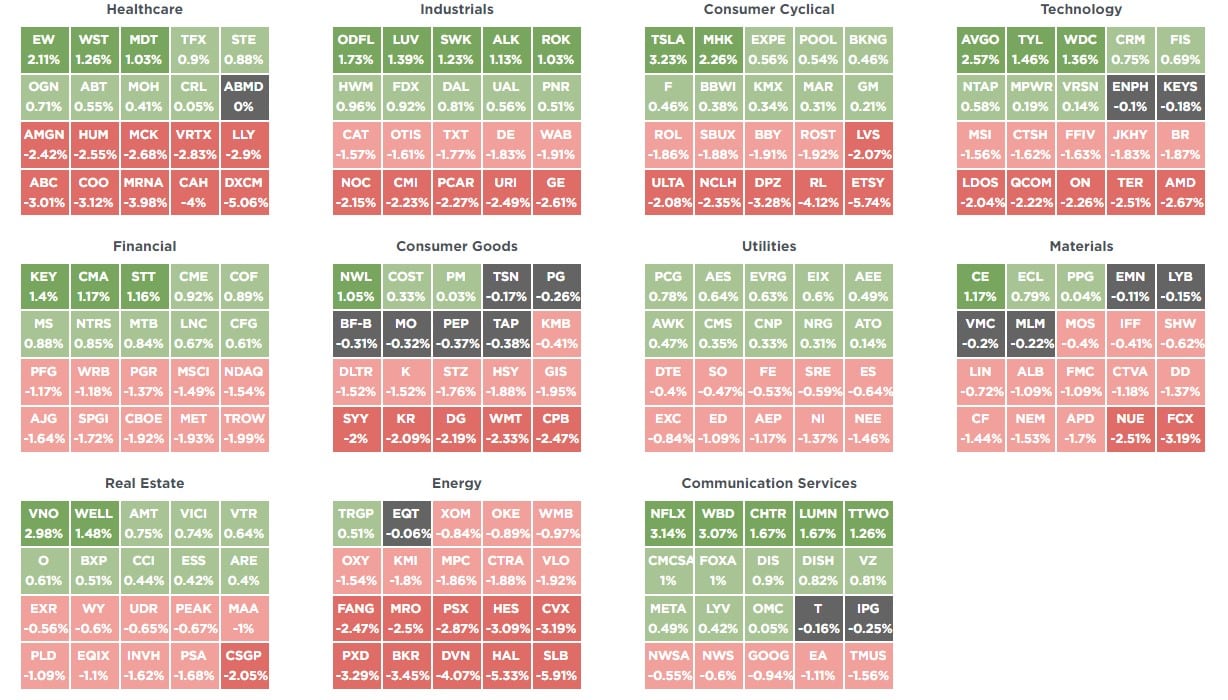
SimpleVisor Top & Bottom Performers By Sector
S&P 500 Tear Sheet

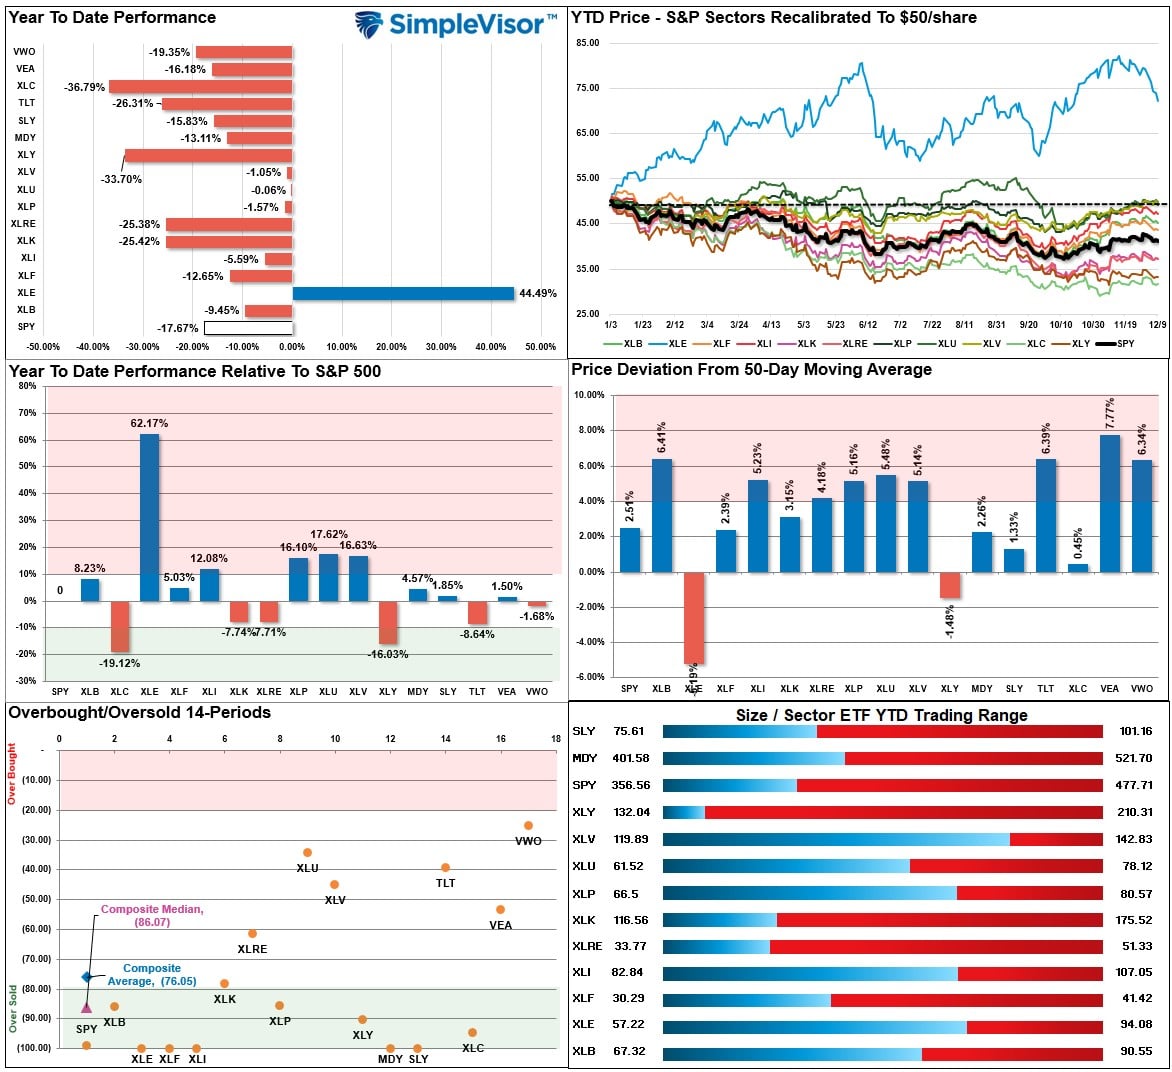
Relative Performance Analysis
Last week we stated that with the weekly Technical Gauge (below) increasing to more overbought levels, we advised readers to take profits and reduce risk. That advice was timely as the market traded lower this past week, which did resolve some of the overbought conditions. Next week is both CPI and the FOMC meeting, so we suggest remaining cautious until those events are past, which could be a setup for the traditional year-end “Santa Rally.”
Technical Composite
The technical overbought/sold gauge comprises several price indicators (RSI, Williams %R, etc.), measured using “weekly” closing price data. Readings above “80” are considered overbought, and below “20” are oversold. Markets tend to peak when those readings are at 80 or above, which suggests profit-taking and risk management are prudent. The best buying opportunities exist when those readings are 20 or below.
The current reading is 43.41 out of a possible 100 and rising. Remain long equities for now.

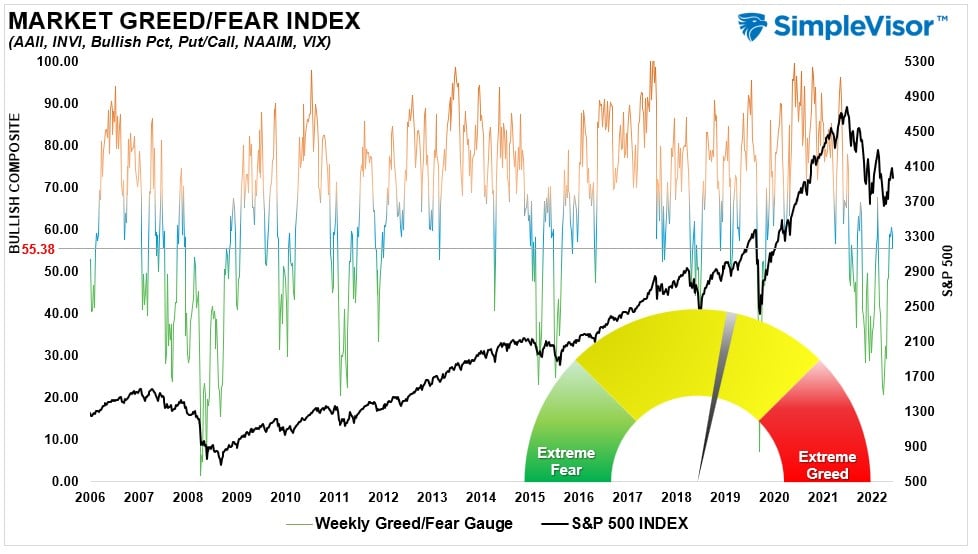
Portfolio Positioning “Fear / Greed” Gauge
The “Fear/Greed” Gauge is how individual and professional investors are “positioning” themselves in the market based on their equity exposure. From a contrarian position, the higher the allocation to equities, the more likely the market is closer to a correction than not. The gauge uses weekly closing data.
NOTE: The Fear/Greed Index measures risk from 0 to 100. It is a rarity that it reaches levels above 90. The current 4-week Average is 55.38 out of a possible 100.
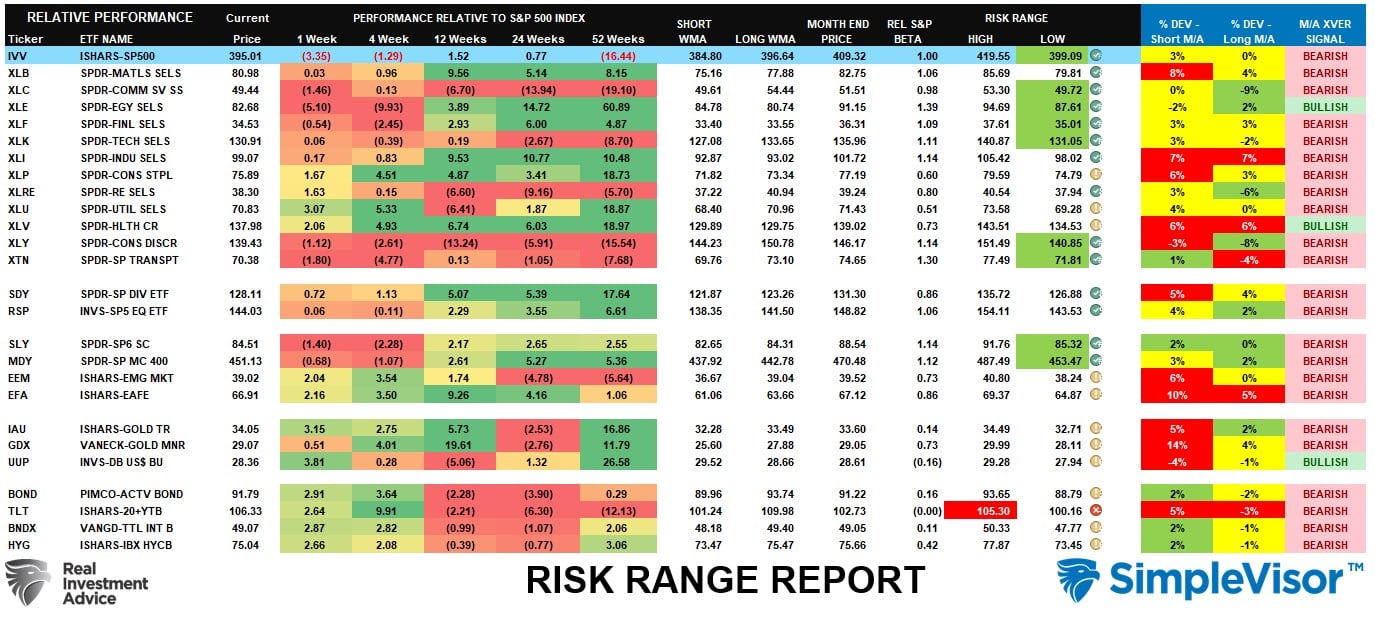
Sector Model Analysis & Risk Ranges
How To Read This Table
- The table compares the relative performance of each sector and market to the S&P 500 index.
- “M” XVER” “Moving Average Cross Over) is determined by the short-term weekly moving average crossing positively or negatively with the long-term weekly moving average.
- The risk range is a function of the month-end closing price and the “beta” of the sector or market. (Ranges reset on the 1st of each month)
- The table shows the price deviation above and below the weekly moving averages.
While bonds are extremely extended after their recent run, the sell-off last week on the equity side took several sectors and markets below their monthly risk ranges. The S&P 500, Communications, Energy, Financials, Technology, Discretionary, Transports, and Small and Mid-cap stocks are trading below their normal ranges. Deviations from the long-term moving averages have improved markedly and suggest a year-end rally, post-Fed meeting, is possible.
Weekly SimpleVisor Stock Screens
Each week we will provide three different stock screens generated from SimpleVisor: (RIAPro.net subscribers use your current credentials to log in.)
This week we are scanning for the Top 20:
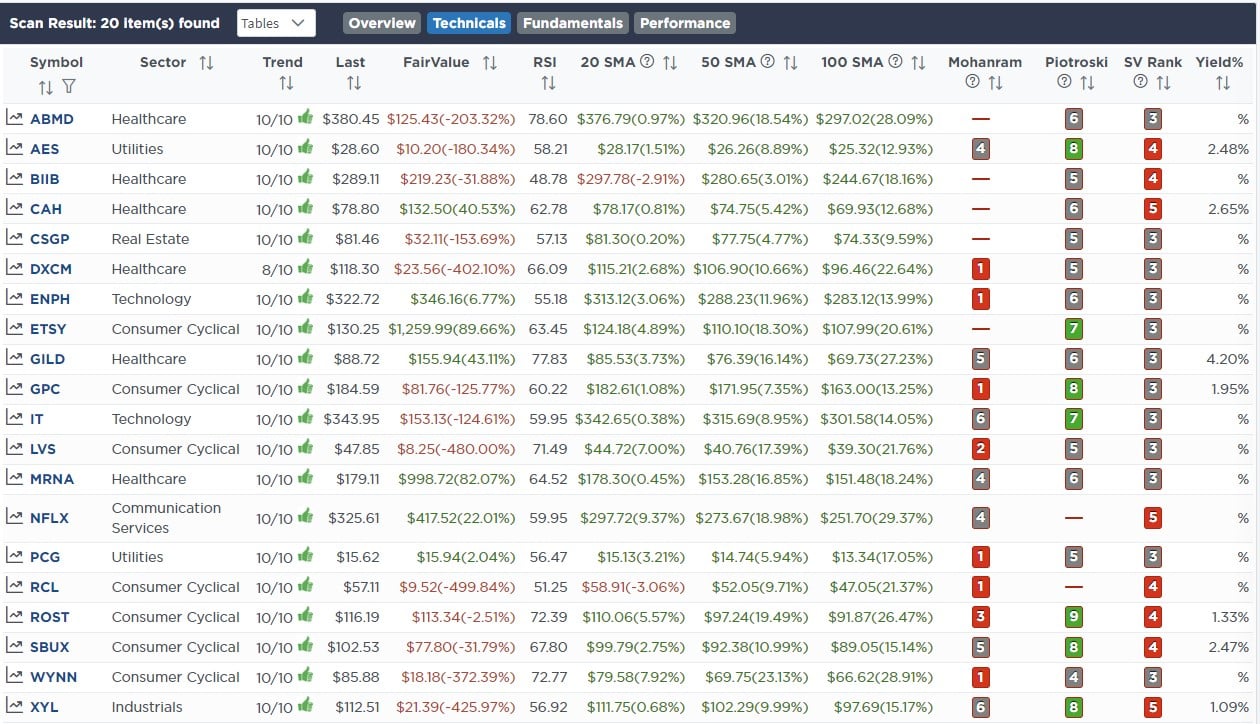
- Relative Strength Stocks
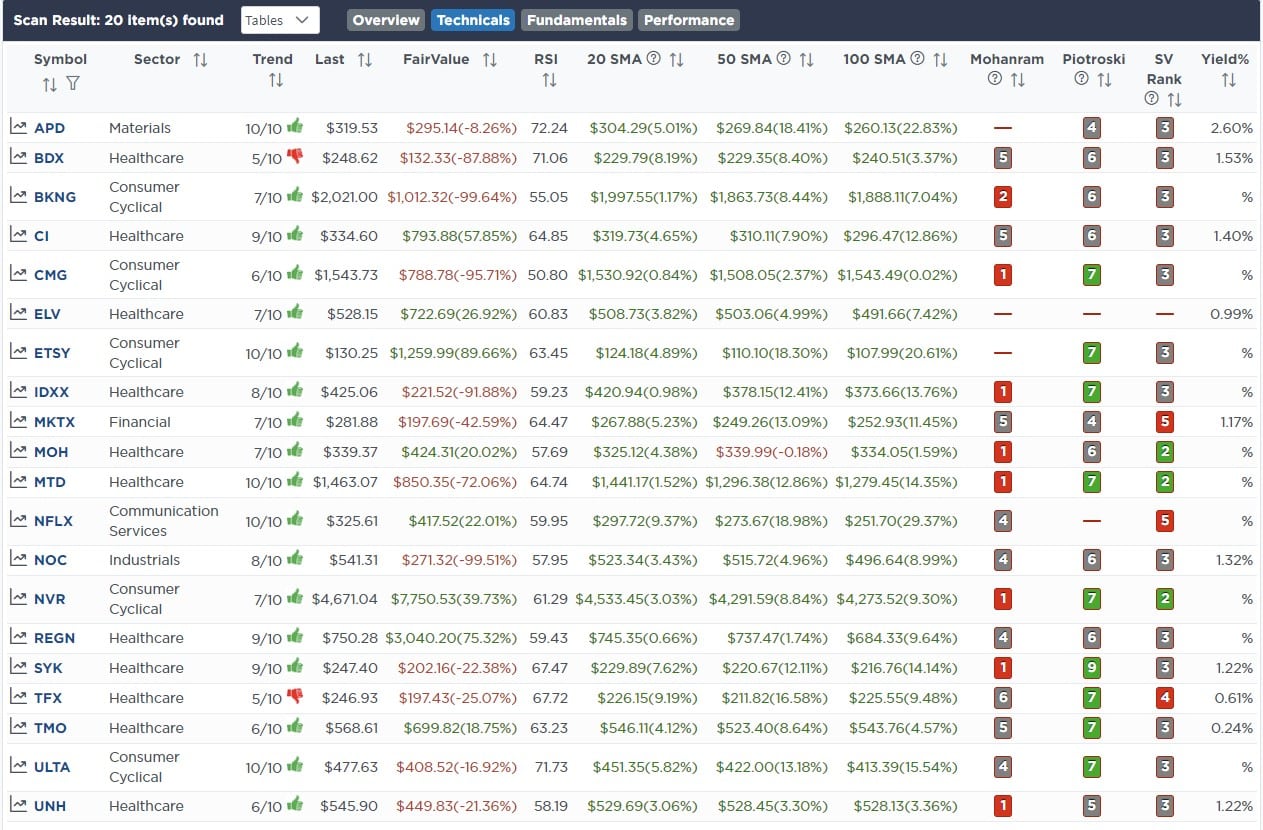
- Momentum Stocks
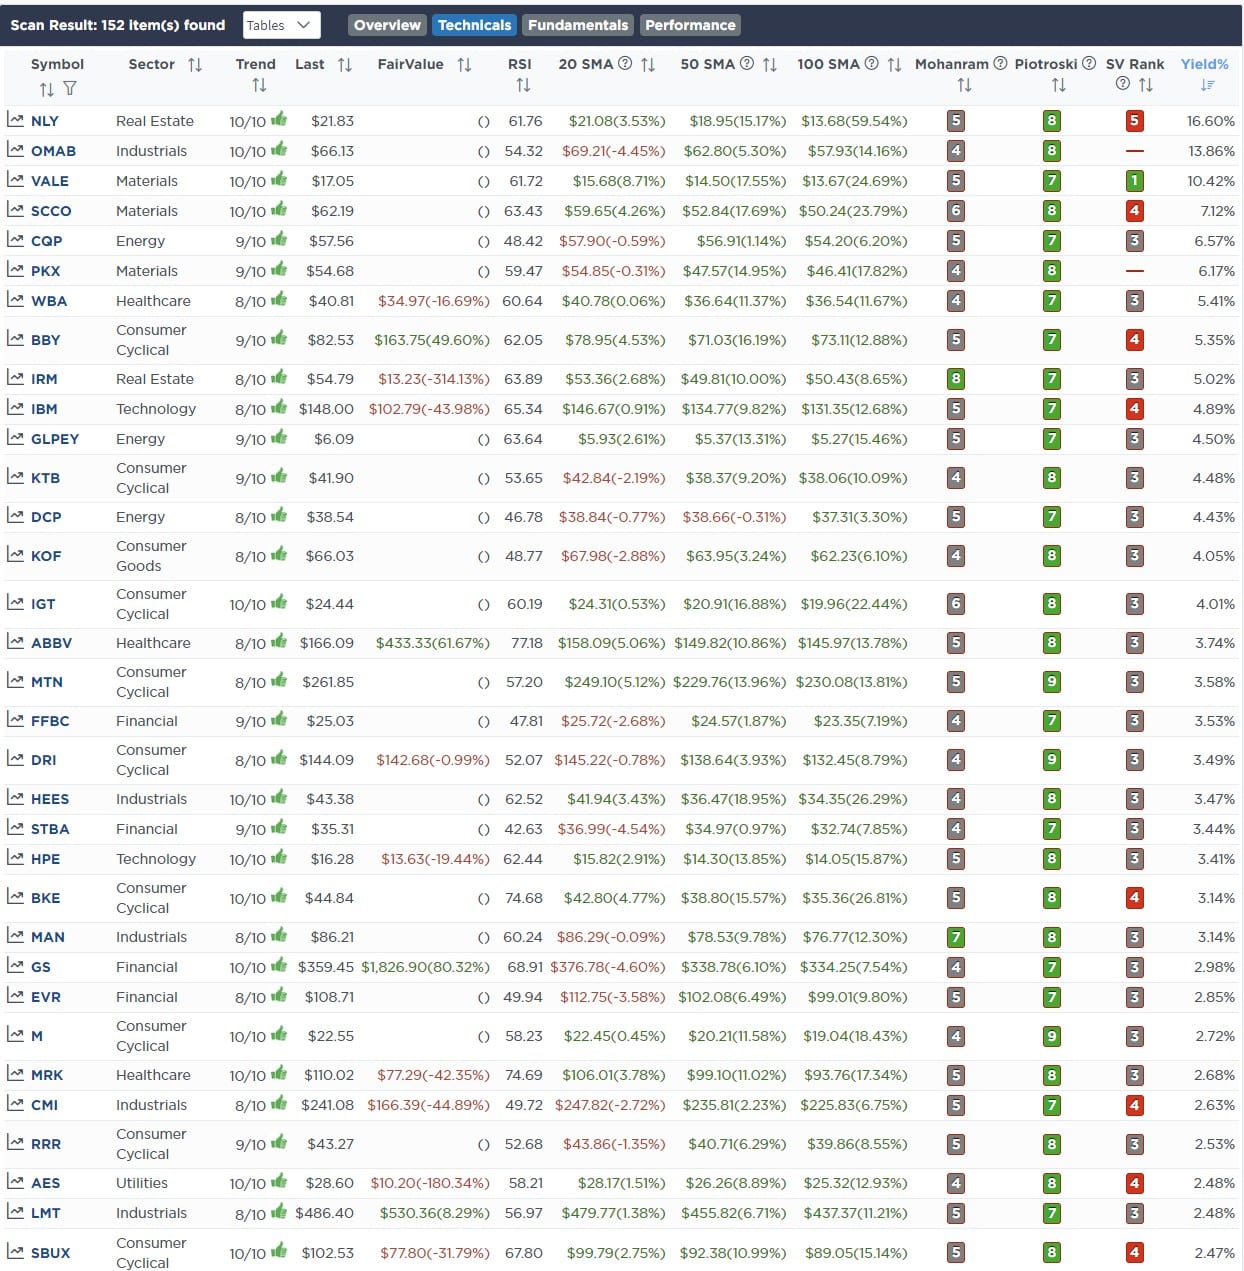
- Highest Rated Stocks With Dividends
These screens generate portfolio ideas and serve as the starting point for further research.
(Click Images To Enlarge)
RSI Screen
Momentum Screen
Highest Rated Stocks With Dividends
SimpleVisor Portfolio Changes
We post all of our portfolio changes as they occur at SimpleVisor:
We made no trades in the portfolios this past week.
The equity model is now at 35% equity exposure, and the ETF model is at 40.5%.

Lance Roberts, CIO
Have a great week!


