Reviewing Market Signals As Warnings Increase


In this 06-11-21 issue of “Reviewing Market Signals As Warnings Increase.“
- Reviewing Market Signals
- Warnings Increase
- Bonds Say Deflation Is A Risk
- Portfolio Positioning
- #MacroView: Rates, Dollar & The 2021 Outlook
- Sector & Market Analysis
- 401k Plan Manager
Follow Us On: Twitter, Facebook, Linked-In, Sound Cloud, Seeking Alpha
Are you worried about the potential for a market correction, a surge in inflation, or are you unsure how to invest for your retirement? We can help. If you are not yet a client and would like to discuss your portfolio construction, please schedule a time to meet with one of our advisors below.

Reviewing Market Signals
Over the last several weeks, we discussed evaluating the recent “buy” signal and concerns about a potential summer correction. We will review that bit of history and discuss our reduction of equity exposures this past week.
May 7th:
“The uptick in money flows did allow us to add some exposure to portfolios in holdings we took profits in previously. Overall, the market trend remains bullish, so there is no need to be overly defensive. Just a regular process of tweaking risk and managing exposures is all that portfolios require for now.”
May 14th – things didn’t work out as planned:
“Well, that follow-through failed to occur. Not only did the “buy signal” not trigger, but the market also broke down through the previous consolidation range. The last exposure we took on is now pressuring the portfolio momentarily, but we should benefit from the turn if we are correct.”
May 21st – the rally gets underway:
“We do expect a counter-trend rally due to the liquidations occurring by institutional investors over the previous few weeks. We will hold exposures at current levels for now. However, instead of looking for a more extended rally into mid-summer, we suspect this rally will be fairly short-lived.”
That week we also began to build the case for a 5-10% correction by mid-summer.
“The risk of a more significant drawdown outweighs the reward longer-term, but we are willing to trade short-term opportunities.”
Jumping ahead, last week, the signals returned to overbought short-term conditions.
“The good news is that we did indeed get the rally we were expecting. The not-so-good news is that the rally already consumed a majority of the ‘buy signal.’ Such does not mean the market is about to correct; it does suggest that upside remains limited near term.”
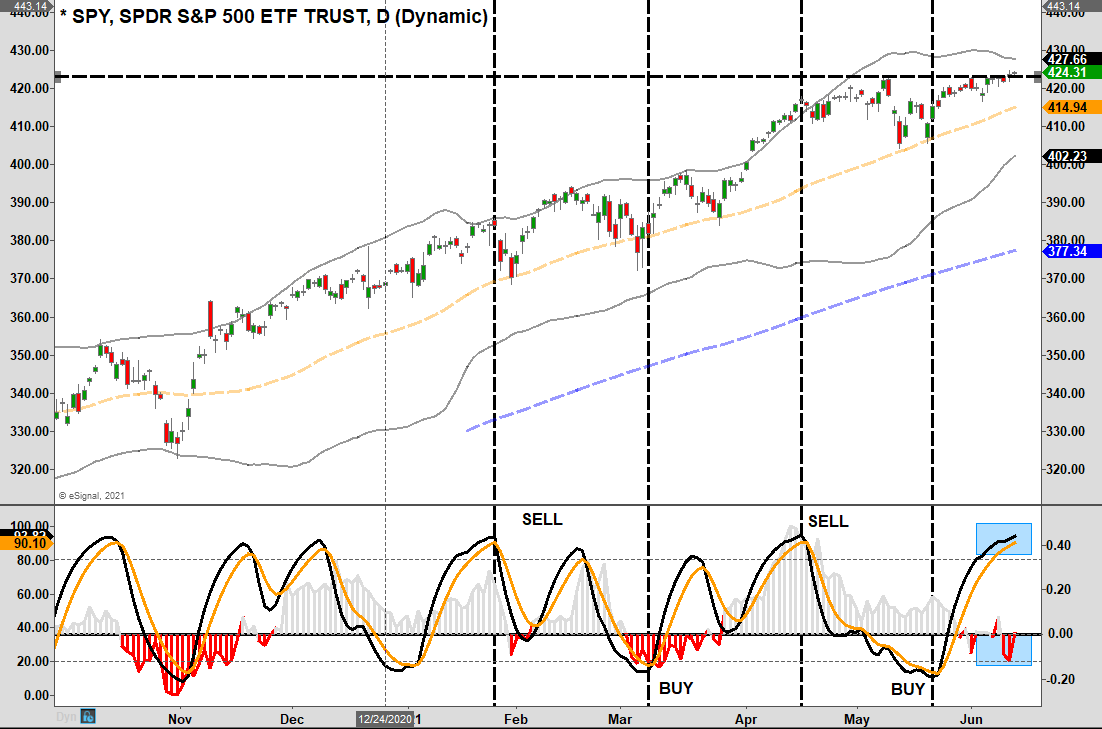
Market Struggles At Highs As Signals Peak
While the market did hit all-time highs this week, it was a feeble rally. Both Thursday and Friday saw the market drop into the red intraday only to be saved by end-of-day buying. Unfortunately, as shown, money flows continued to decline until there was “distribution” as the market hit highs. Such is not a sign of confidence the “highs” will stick.
On a weekly chart, the picture improves somewhat with the “buy signal” still intact. However, it is just barely the case, and if we get selling pressure next week, it will trigger a “sell.”
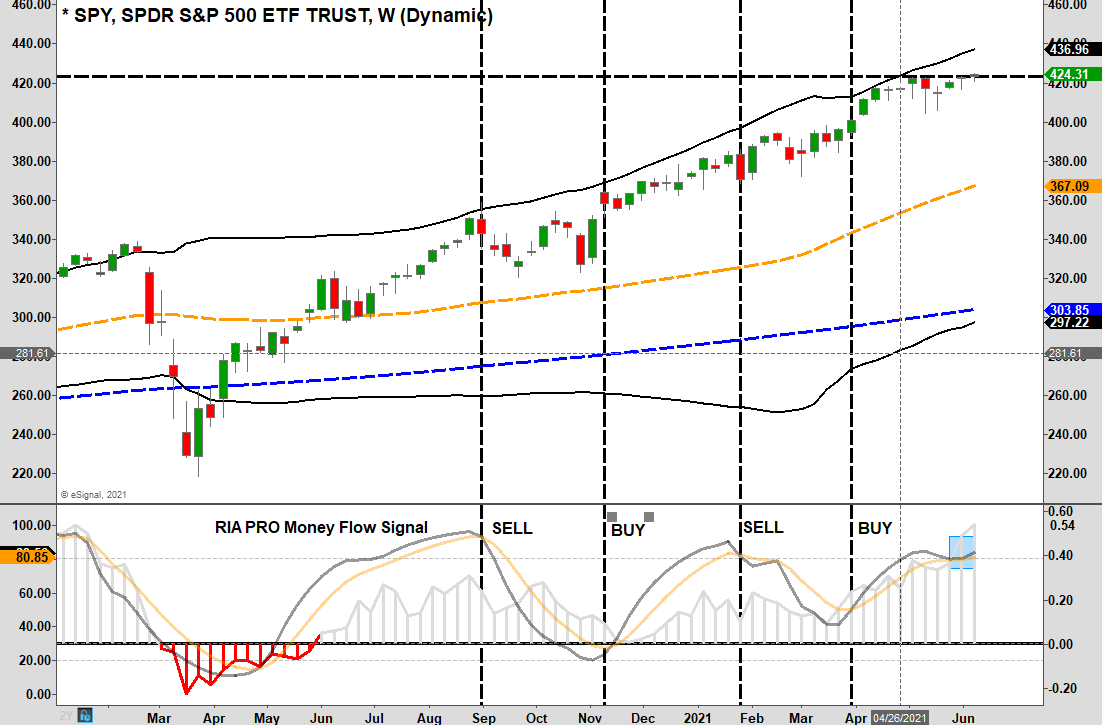
As discussed previously, we set our expectations for a 5-10% correction between mid-June and July. With that window approaching and signals very close to triggering “sells” on both a daily and weekly basis, we used the rally this week to lighten our equity exposure and raise cash levels. (See the portfolio update below.)
For now, the bullish trend remains intact. Therefore, there is no need to get overly defensive at this juncture. However, being excessively complacent and not applying some risk management to portfolios will leave you flat-footed when the correction does come.
Investors are exceedingly exuberant about markets once again, with numerous analysts suggesting nothing but “blue skies” ahead.
Maybe. But there are plenty of warnings that suggest “carrying an umbrella” may come in handy.

Warning Signals Increase
In our “Warning Signs Ahead,” we discussed several concerns of a correction in the coming weeks. Importantly, as noted then, we are only discussing the potential for a short-term correction. As is often the case, some tend to extrapolate such commentary to mean a “crash” is coming. Such is not the case currently, but it does not mean a deeper correction is not possible.
Currently, complacency has reached more extreme levels. As noted last week, the 15-day moving average of VIX, on an inverted scale, suggests a correction is likely.
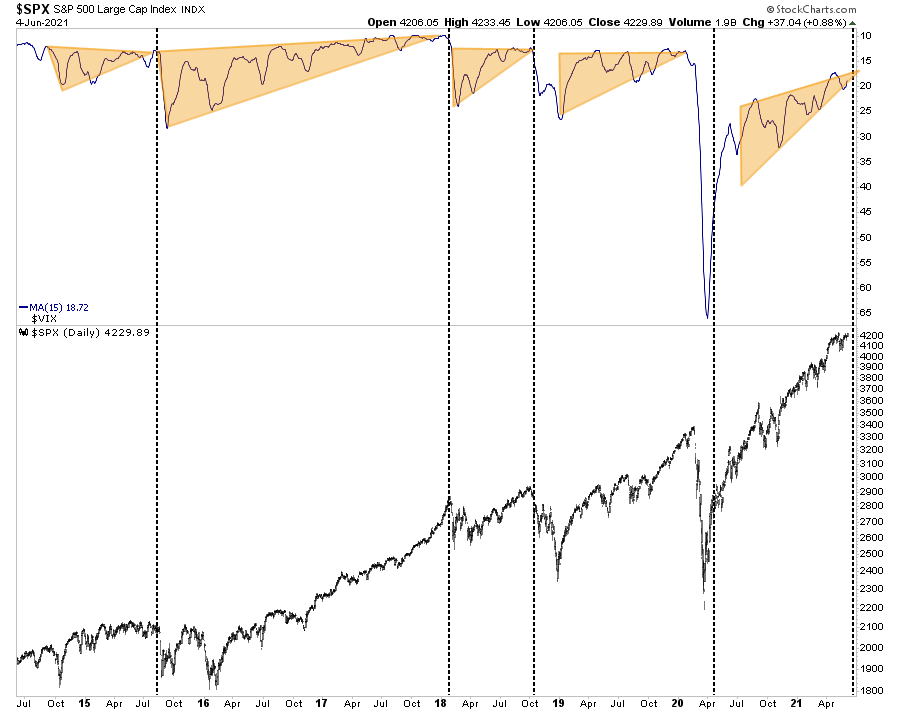
“The market may have one last push higher over the next several weeks. Such will take the VIX even lower and complete the VIX wedge pattern. That pattern has been evident in the last three 10% or greater corrections. By this measure, the correction should begin somewhere around July 21st – August 10th.” – Jim Colquitt
Morgan Stanley‘s market timing indicator is also at levels typically associated with market downturns. Just for reference, the current reading is the most “bearish” on record.
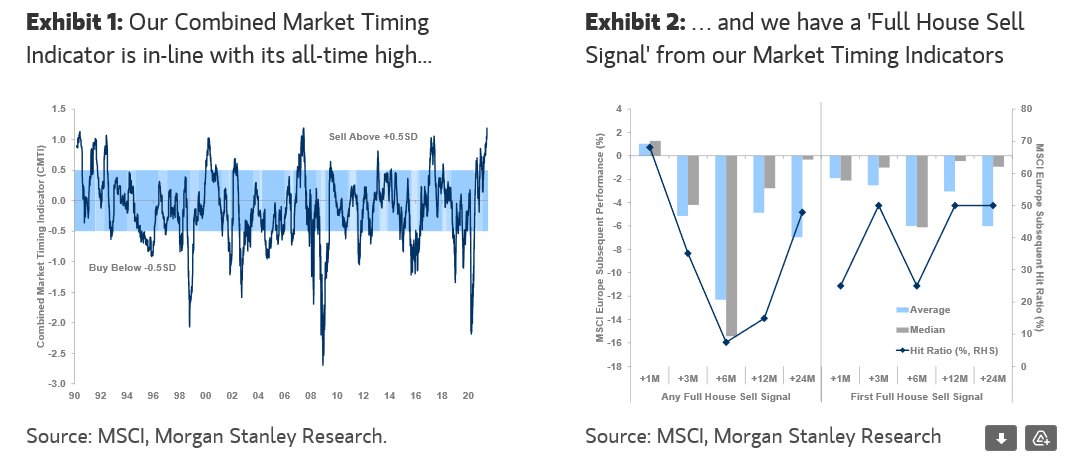
We covered several other indicators, all suggesting that risk has become elevated. Moreover, given the length of the current advance without a correction, the risk of such has increased.
More Signs
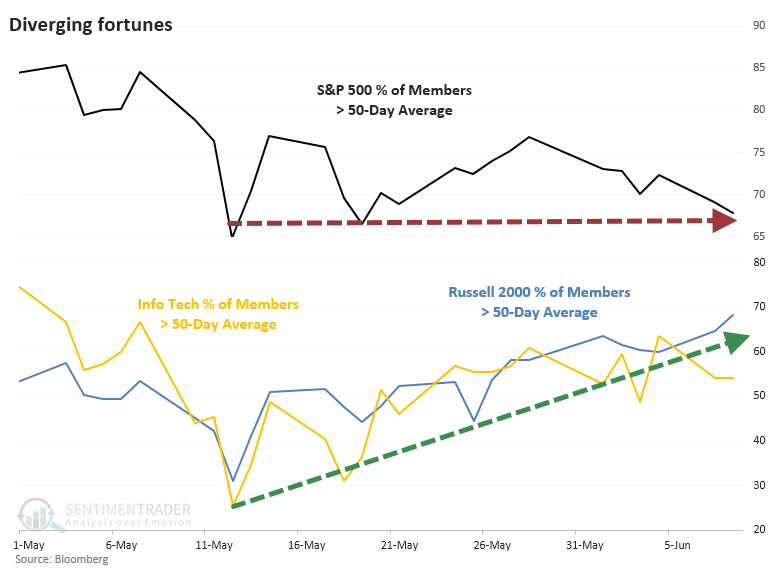
Furthermore, during the past week, we saw other indicators suggesting that market upside is likely limited short-term. For example, Sentiment Trader made an excellent observation of the recent rotation from large to small-caps.
“Over the past few weeks, there has been a remarkable rotation under the surface. On May 12, only 31% of stocks in the Russell 2000 were holding above their 50-day moving averages. In the Info-Tech sector, only 25% of stocks were above their averages. Both have seen participation more than double since then, while the S&P 500 has stagnated internally, as pointed out by the esteemed Liz Ann Sonders.”
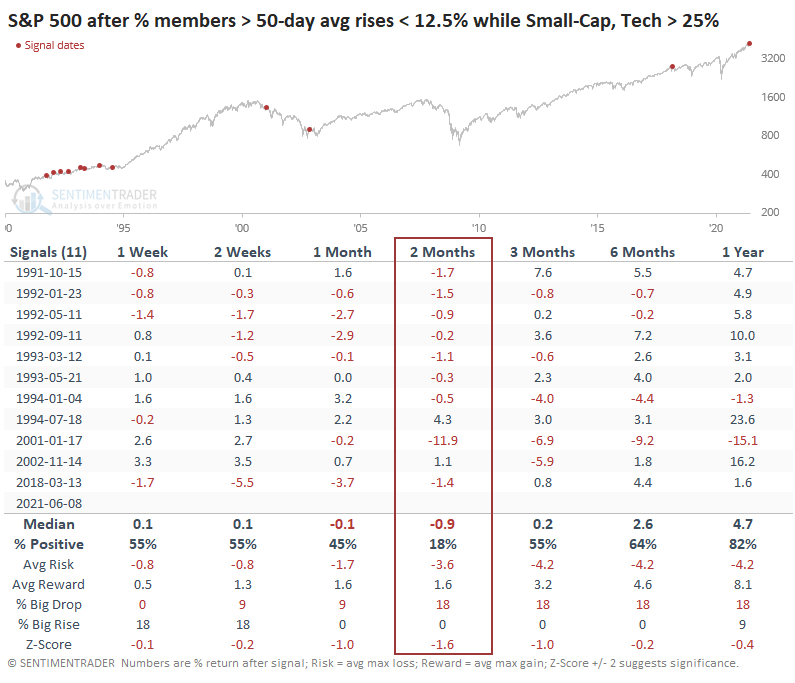
As noted above, one of the common themes has been numerous bullish commentators suggesting the market is about to run to new highs. However, given the confluence of warning signals and “stagnation” of the advance, the bearish view is such action usually appears near market peaks. Sentiment Trader provided some historical evidence.
“Looking at available history, bears have the more compelling evidence on their side, depending on the index and the time frame. The table below shows the S&P 500’s future returns when its percentage of members above the 50-day average rises less than 12.5% over a multi-week period while the percentage of members above their averages in Small-Caps and Tech rises more than 25%.”
Again, given the more extreme conditions seen in not only our current short-term “money-flow” signals but numerous other indications, the risk of a short-term correction seems a realistic probability.
Does such mean that a “correction” must occur? No. However, as noted last week, we prefer to err to the side of our analysis and discipline. By the time a correction appears, it is often too late to mitigate the damage effectively.
Bonds Say Deflation Is The Risk
Despite a sharp year-over-year increase in the latest CPI report, the bond market suggests deflation remains the more considerable risk. As shown in the chart below, the latest CPI and “Core CPI” surged sharply. I also included a “consumer inflation gauge,” which excludes healthcare and home prices. (For most individuals, these two costs are fixed by a mortgage payment and health insurance.)
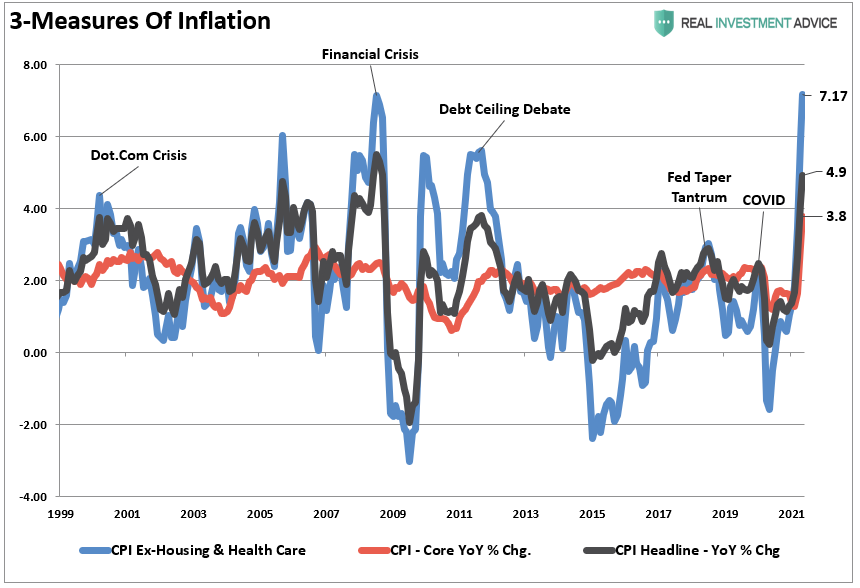
Interestingly, the “bond market” continues to suggest deflation is the more significant threat as we are currently at the largest deviation between annual CPI and rates since 1980.
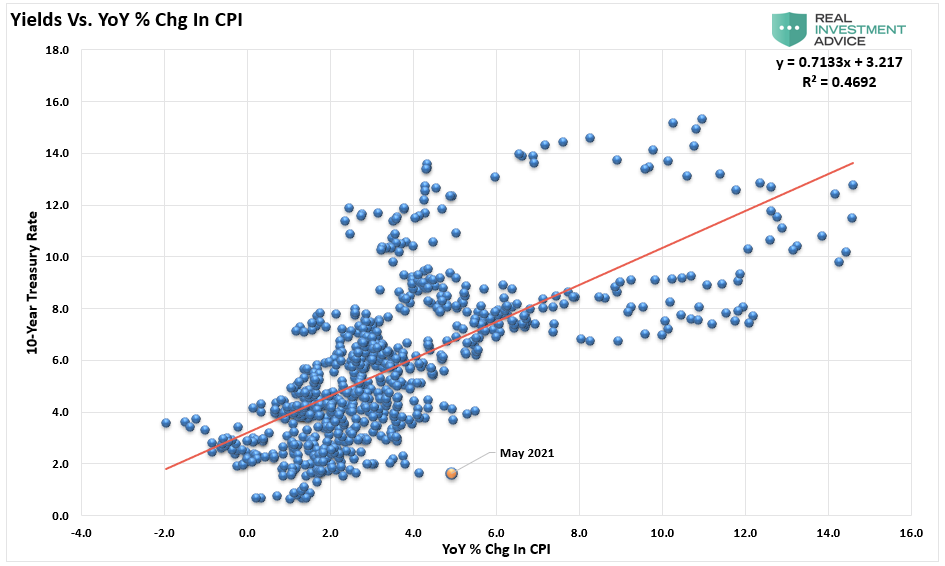
This model suggests the market agrees with the Fed’s view that inflation is transitory and is pricing in sub-2% inflation and economic growth. Furthermore, over the next two quarters, the year-over-year rate of change will slow (the “base effect”) as the economic “shutdown” is removed from the calculation.
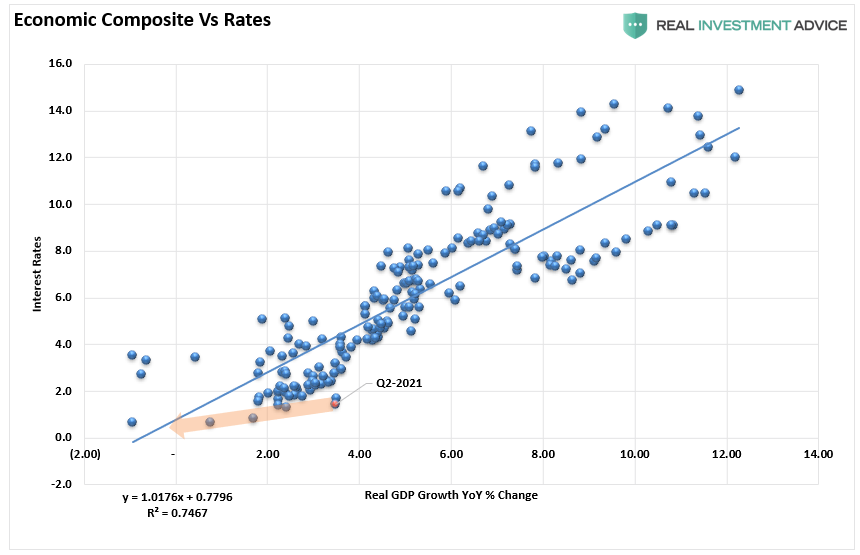
As discussed in Friday’s #MacroView report “The Dollar, Rates & 2021 Outlook,” deflation is set to return.
“Contrary to the conventional wisdom, disinflation is more likely than accelerating inflation. Since prices deflated in the second quarter of 2020, the annual inflation rate will move transitorily higher. Once these base effects are exhausted, cyclical, structural, and monetary considerations suggest that the inflation rate will moderate lower by year-end and will undershoot the Fed Reserve’s target of 2%. The inflationary psychosis that has gripped the bond market will fade away in the face of such persistent disinflation.” – Dr. Lacy Hunt
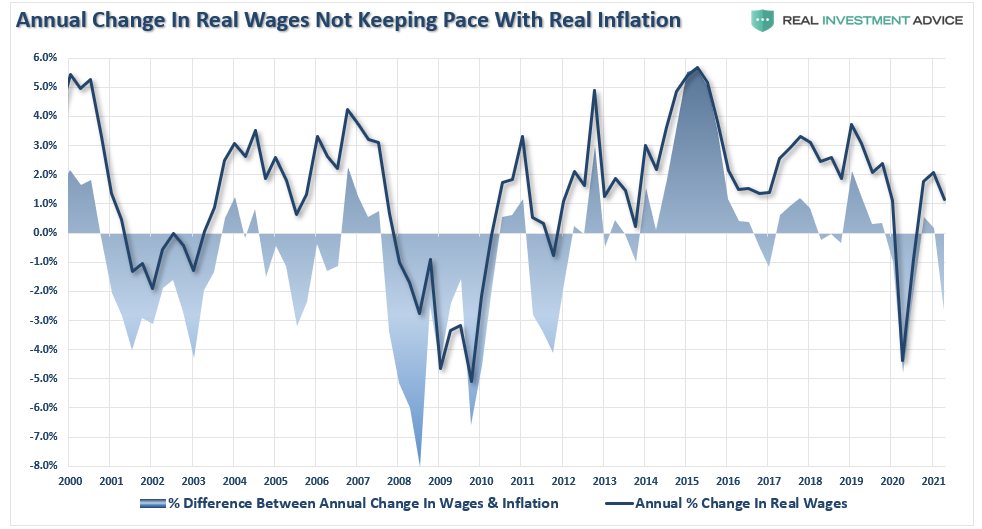
Furthermore, given real wages are not keeping up with the actual “cost of living” increases, the “stimulus” effect is fading, and the pull-forward of consumption is mostly complete, we most likely have seen the peak of economic and earnings growth.
We remained concerned about a repricing of risk over the next few months.
Portfolio Update
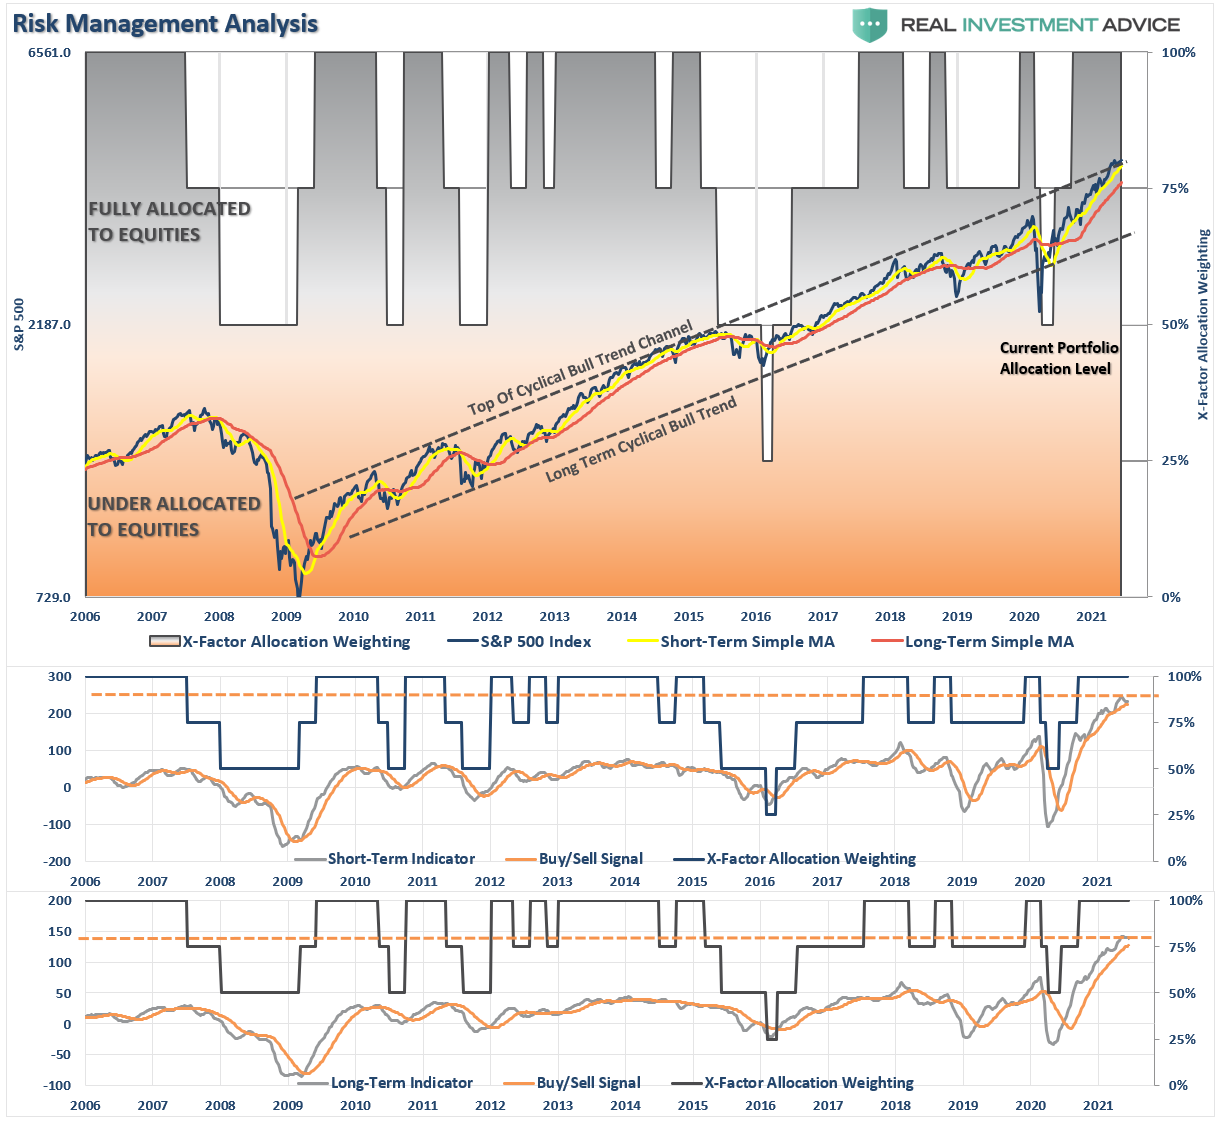
On Thursday, we did begin reducing our exposures slightly in 60/40 equity and ETF portfolios. (Chart via RIAPRO.net)
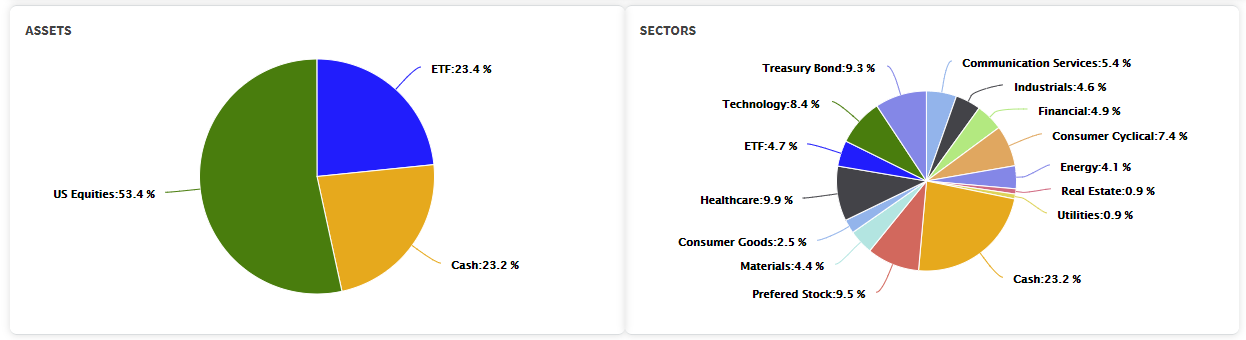
As shown, we are still 53% long equity exposure but are down from nearly 70% from the recent market lows. Part of the cash exposure comes from our bond portfolio due to shortening duration to offset short-term interest rate risk. We did begin increasing bond duration a couple of weeks ago.
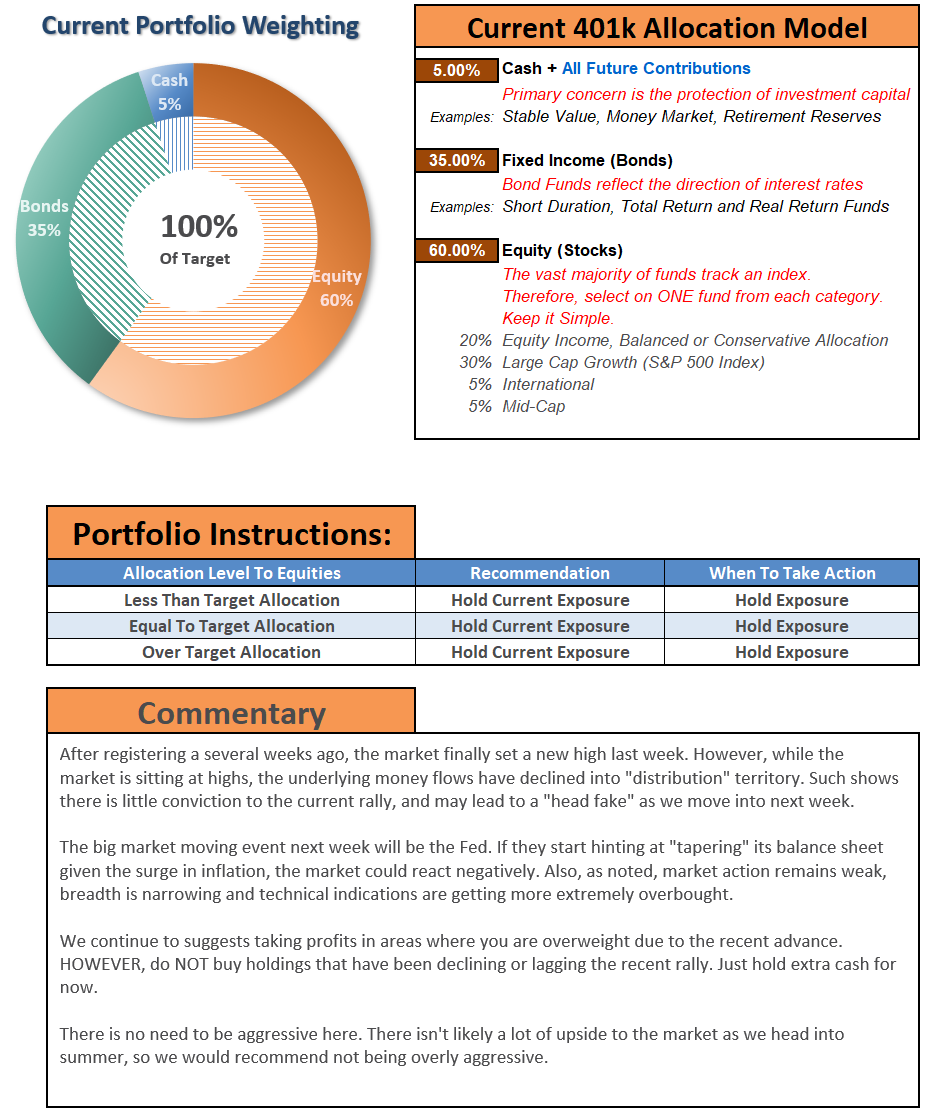
The reason for showing you the allocation is that you don’t assume that just because we are warning of a potential correction, we are not sitting 100% in cash. I suggest that with our “sell signals” approaching, it is time to start taking some action essential to portfolio risk management.
- Trim back winning positions to original portfolio weights: Investment Rule: Let Winners Run
- Sell positions that simply are not working (if the position was not working in a rising market, it likely won’t in a declining market.) Investment Rule: Cut Losers Short
- Hold the cash raised from these activities until the next buying opportunity occurs. Investment Rule: Buy Low
We may very well be a little early in our actions which could equate to short-term portfolio underperformance. However, there is minimal risk in “risk management.” In the long term, the results of avoiding periods of severe capital loss will outweigh missed short-term gains.
If you need help or have questions, we are always glad to help. Just email me.
See You Next Week
By Lance Roberts, CIO
Market & Sector Analysis
Analysis & Stock Screens Exclusively For RIAPro Members
Discover All You Are Missing At RIAPRO.NET
Come find out what our RIAPRO.NET subscribers are reading right now! Risk-Free For 30-Day Trial.
- Sector & Market Analysis
- Technical Gauge
- Fear/Greed Positioning Gauge
- Sector Rotation Analysis (Risk/Reward Ranges)
- Stock Screens (Growth, Value, Technical)
- Client Portfolio Updates
- Live 401k Plan Manager

THE REAL 401k PLAN MANAGER
A Conservative Strategy For Long-Term Investors
If you need help after reading the alert, do not hesitate to contact me.

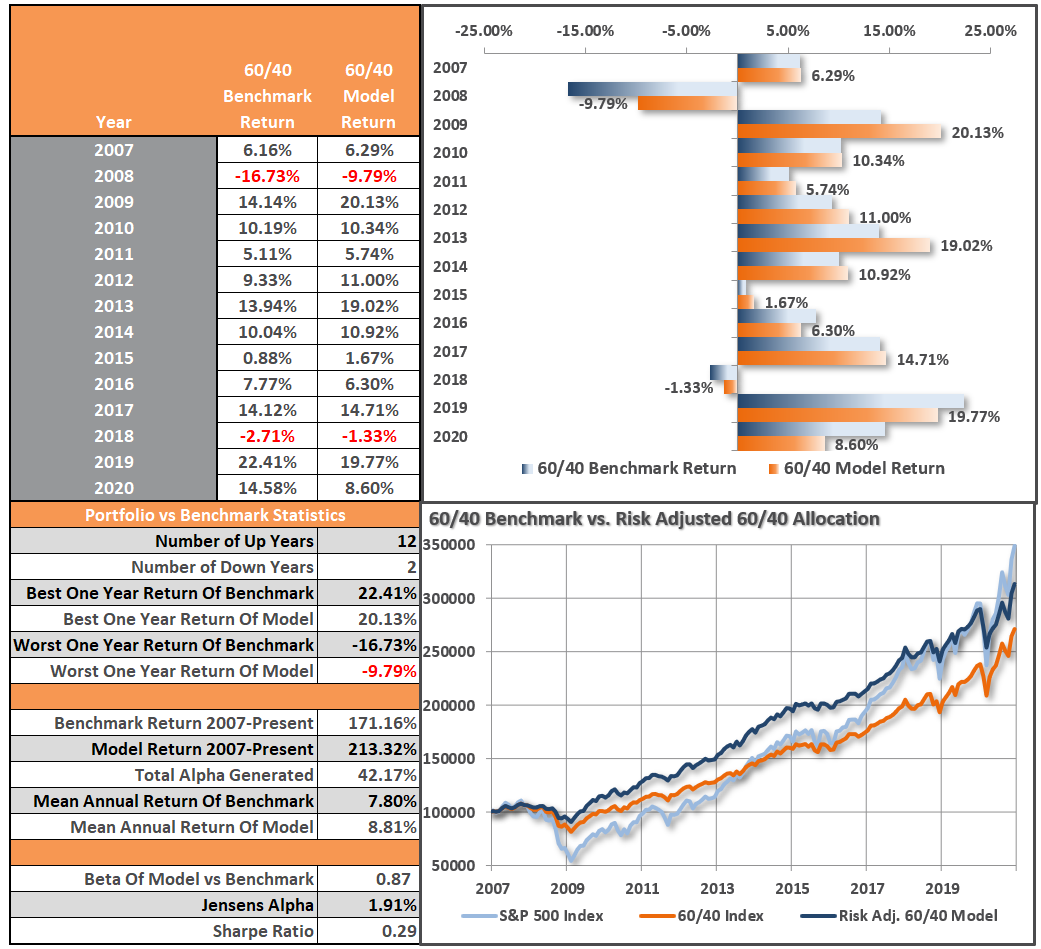
Model performance is a two-asset model of stocks and bonds relative to the weighting changes made each week in the newsletter. Such is strictly for informational and educational purposes only, and one should not rely on it for any reason. Past performance is not a guarantee of future results. Use at your own risk and peril.
Have a great week!


