
Inside This Week’s Bull Bear Report
- Market Rise Due To Just 10-Stocks
- Indicators Warn Of Recession. Analysts Disagree.
- How We Are Trading It
- Research Report – Banking Crisis Is How It Starts.
- Youtube – Before The Bell
- Stock Of The Week
- Daily Commentary Bits
- Market Statistics
- Stock Screens
- Portfolio Trades This Week
Market Rise Due To Just 10-Stocks
We live in interesting times as investors push stocks higher as recession indicators send a strong warning. However, that rise is not broad-based and is a function of a topic we posed in November 2022.
“As we head into 2023, there is one final reason why FANG stocks will likely perform much better than many currently expect – ‘disinflation.’”
In a disinflationary/deflationary environment, particularly in an economic recession, investors seek out companies with sustainable earnings growth rates. While many of the FANG stocks have come under pressure as of late due to ‘disappointing’ earnings and forecasts, it is worth noting the earnings growth rates of these companies remain high over the next 3-5 years, according to Zacks Research:
- AAPL – 12.5% Annually
- GOOG – 11.3% Annually
- MSFT – 10.8% Annually
- NVDA – 12.3% Annually
- AMZN – 20.2% Annually
“The point is that investors should not dismiss FANG stocks entirely because the media says they are ‘dead.’ It is worth remembering many said the same about Energy stocks in late 2020. Of course, that was just before that ‘dead asset’ outperformed everything else in the market.”
Well, this year, that prognostication has undoubtedly been the case.
“Markets have seemingly entered a time warp — where last year’s losers are this year’s winners and vice versa. Tech stocks are bringing the FAANG vibes from 2021 and before. The top ten Nasdaq 100 stocks account for nearly all of this year’s gains in the Nasdaq 100 (88%). Apple and Microsoft alone account for 13.2% of the S&P 500’s composition, the highest level since AT&T and IBM ruled the roost in 1978.” – Yahoo Finance
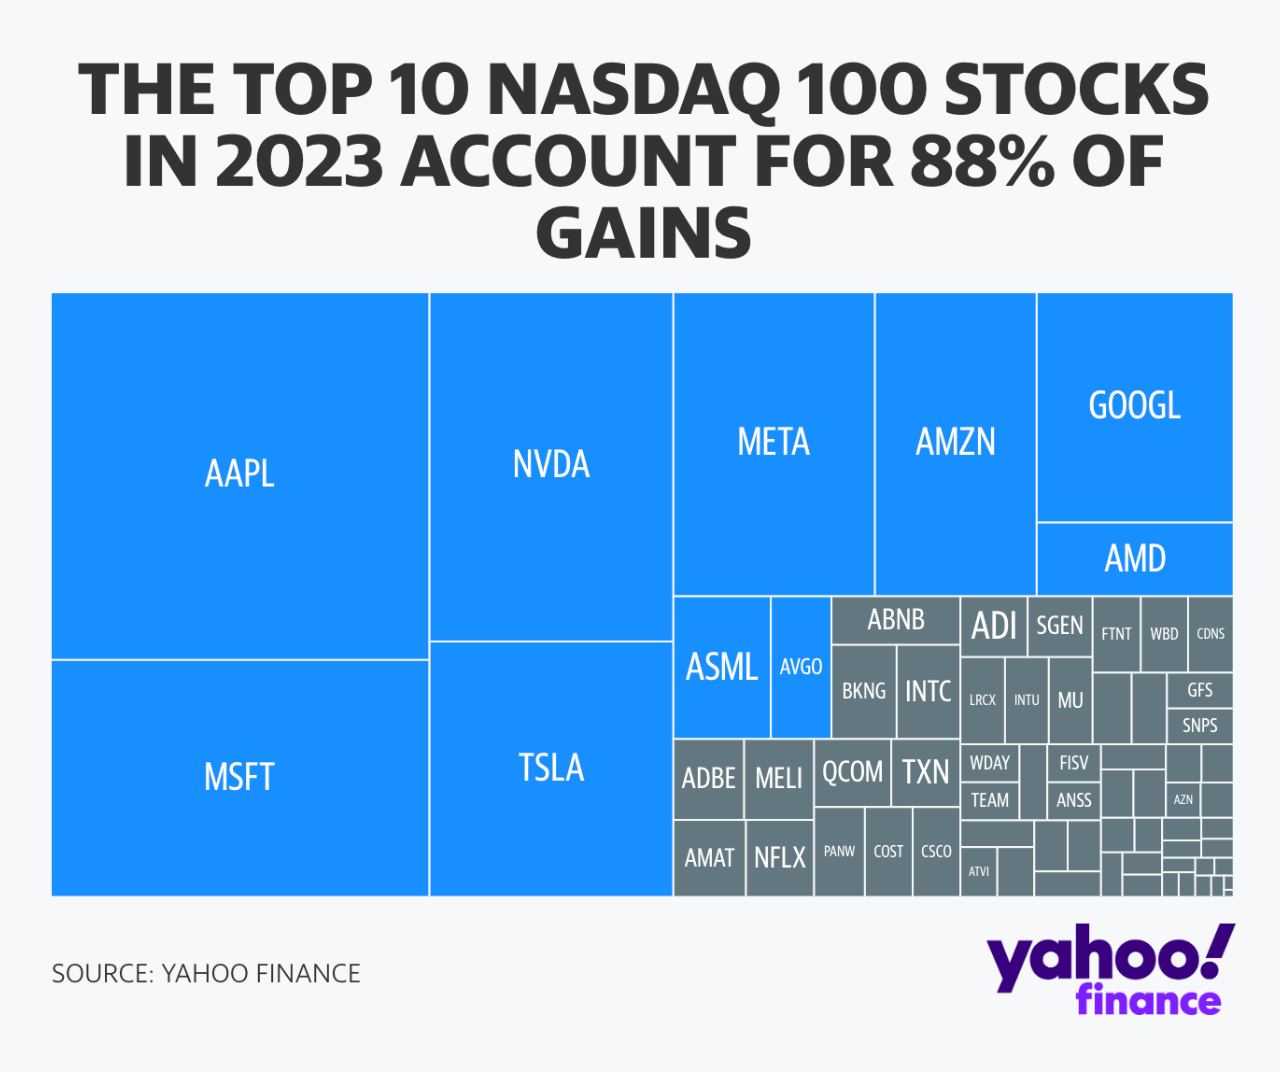
Interestingly, we saw much of the same in 2021 as investors piled into the top-10 stocks through passive indexing.
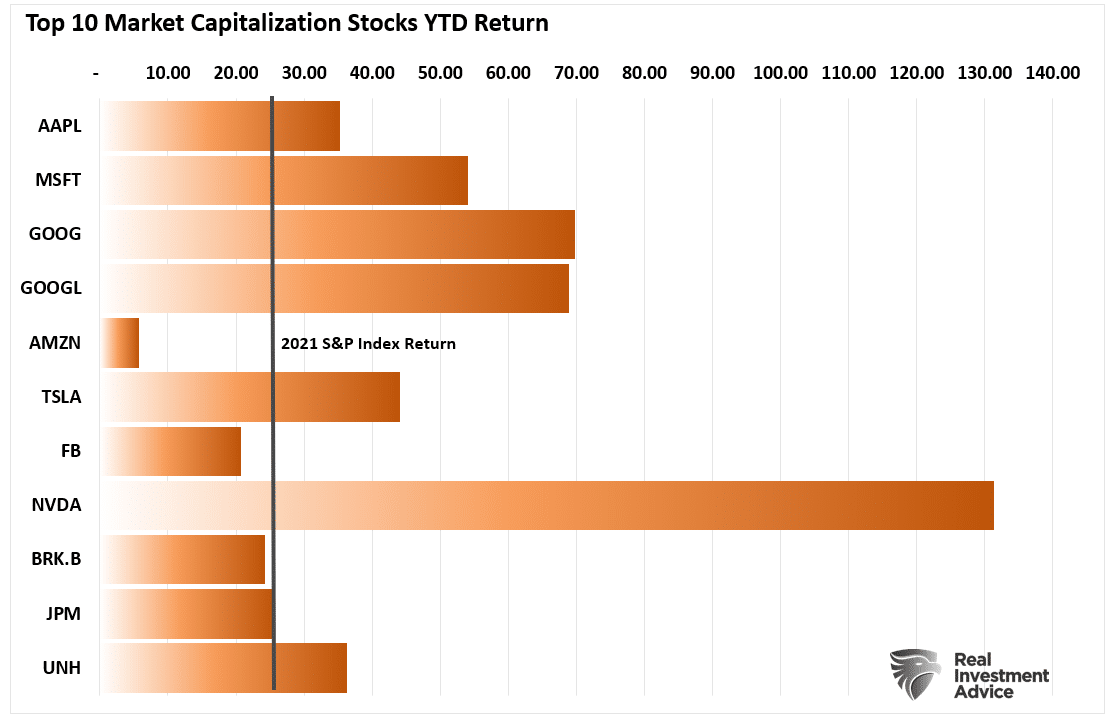
“Such is the story of 2021. Had it not been for the enormous returns in companies like Apple (AAPL), Google (GOOG), Microsoft (MSFT), Tesla (TSLA), and Nvidia (NVDA), the years return would be much different.”
This is the return of the top index stocks in 2021 compared to the index.
Of course, we know that in 2022, just one month after that post, the market reversed course sharply in those same stocks.
The Bull Is Back…For Now
However, in the short term, there is no denying the underlying bullish tones, as we stated last week.
“With these buy signals in place, investors should modestly increase equity exposure, as the most likely path for stock prices is higher over the next couple of weeks to months.”
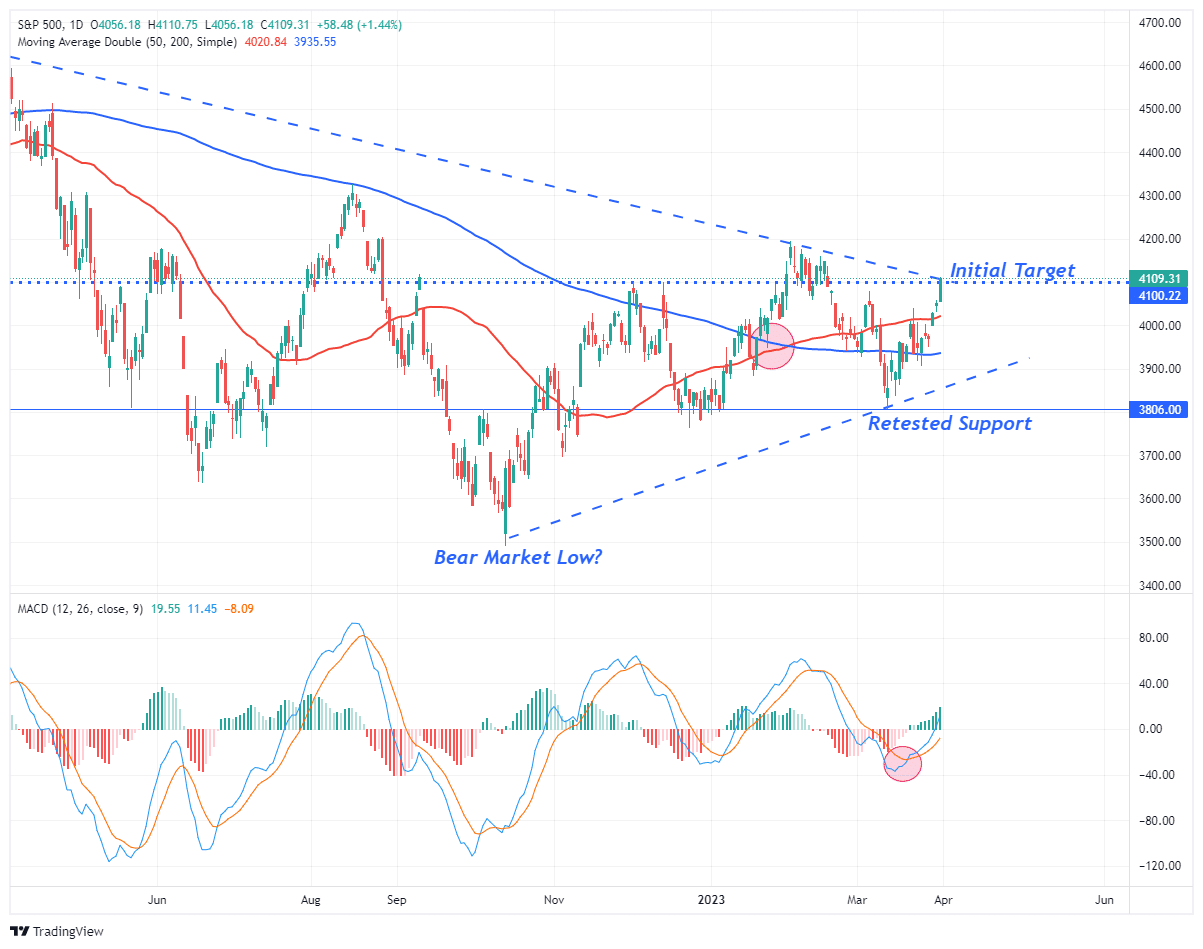
Despite many headlines, “youtube experts,” and media analysts regurgitating narratives of “crisis” and “doom,” the market has continued to rise since the lows of October. Importantly, from a bullish perspective, the markets held the December lows confirming previous support levels. While the market is challenging the downtrend from the April 2022 peak, a breakout of the consolidation range from June 2022 would suggest a significant move higher.
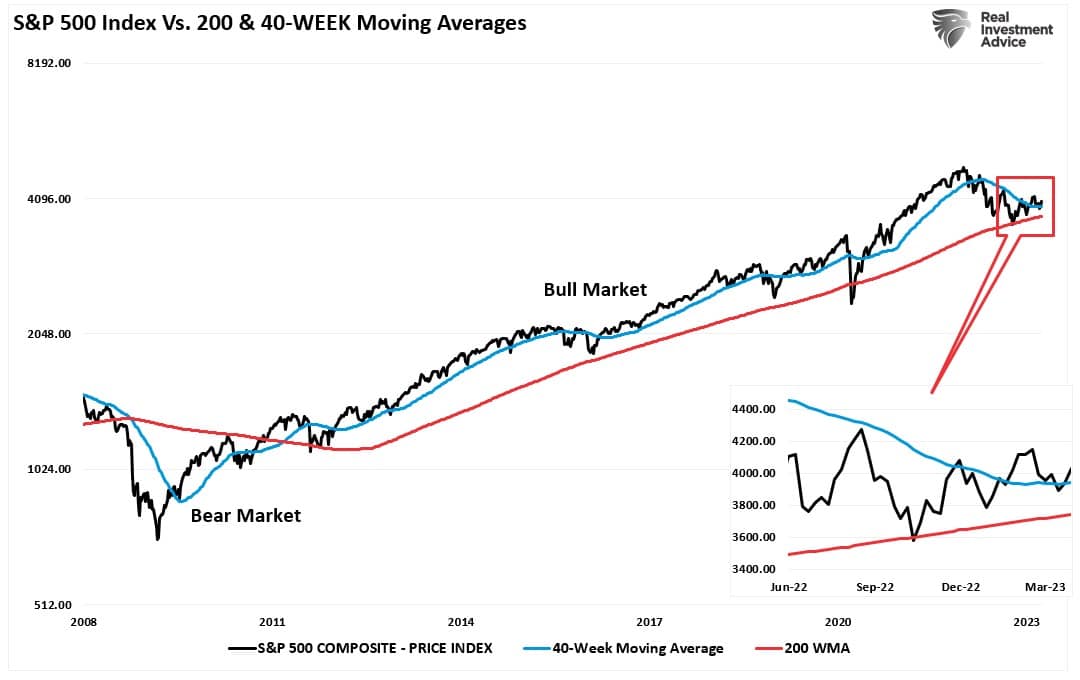
Furthermore, the weekly price chart also projects a more bullish scenario with critical long-term supports remaining firmly intact. For illustrative purposes, the chart shows the 200-week moving average since 2008. The “bear market” was defined as a break below that average. The “bull market” is determined by the move above. Since 2008, there have been five successful tests of that ongoing bullish trend, with October 2023 being the most recent. With the market, as shown in the callout, retesting and holding above the 40-week moving average, such confirms both the long-term and short-term bullish trends are intact.
This more bullish market action is a representation of both analysts and economists upgrading their expectations of both earnings and economic growth. However, while expectations are optimistic about the economy avoiding a recession, multiple indicators suggest such may not be accurate.
We will explore both in this week’s analysis.
Need Help With Your Investing Strategy?
Are you looking for complete financial, insurance, and estate planning? Need a risk-managed portfolio management strategy to grow and protect your savings? Whatever your needs are, we are here to help.

Reviewing Our Recession Indicators
Last year, we noted that with “everyone expecting a recession, something else tends to happen.” Of course, since then, the economy has yet to register a recession, and economic data on several fronts remains robust. The indicators we will review in this week’s missive are highly correlated to the economy and have a long record of accurately predicting economic expansions and contractions. The most apparent indicator with which to start our review is the “yield curve.”
“It is not the inversion of the yield curve that denotes the recession. The inversion is the “warning sign,” whereas the un-inversion marks the start of the recession, which the NBER will recognize later.
That last sentence is the most important. Regarding a “recession countdown,” the initial inversion is not the signal. It is when the curves un-invert that a recession is approaching. The reason is that the Federal Reserve is rapidly cutting rates as the recession is recognized. Such causes the short end of the yield curve to fall faster than the long end.“
We track ten economically sensitive yield spreads. Currently, 100% of the 10-yield spreads we track are inverted. Historically, a recession follows whenever more than 50% of those spreads are inverted. Every. Single. Time.
(Read this for a complete history.)

As noted, the yield curve indicator only warns of a recession. It is the UN-inversion that signals the recession’s arrival. That is because the yield curves have started to trough at the short end of the spectrum. As previously noted:
“While the yield curve’s inversion tells you a recession is on the way, it’s the subsequent re-steepening that indicates the slump’s imminence. Not all yield curves are alike, and some parts of it begin to steepen much sooner than others. One of the first to move is the 3m30y curve. In previous recessions it started to steepen well before most other parts of the curve.” – Simon White

Leading Indicators Warn Of Recession
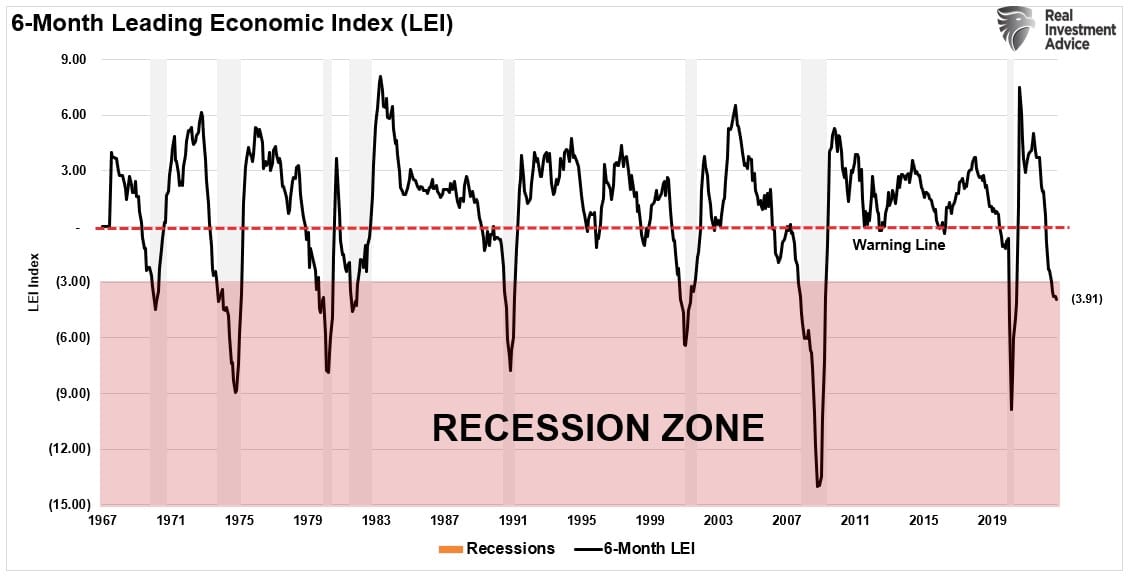
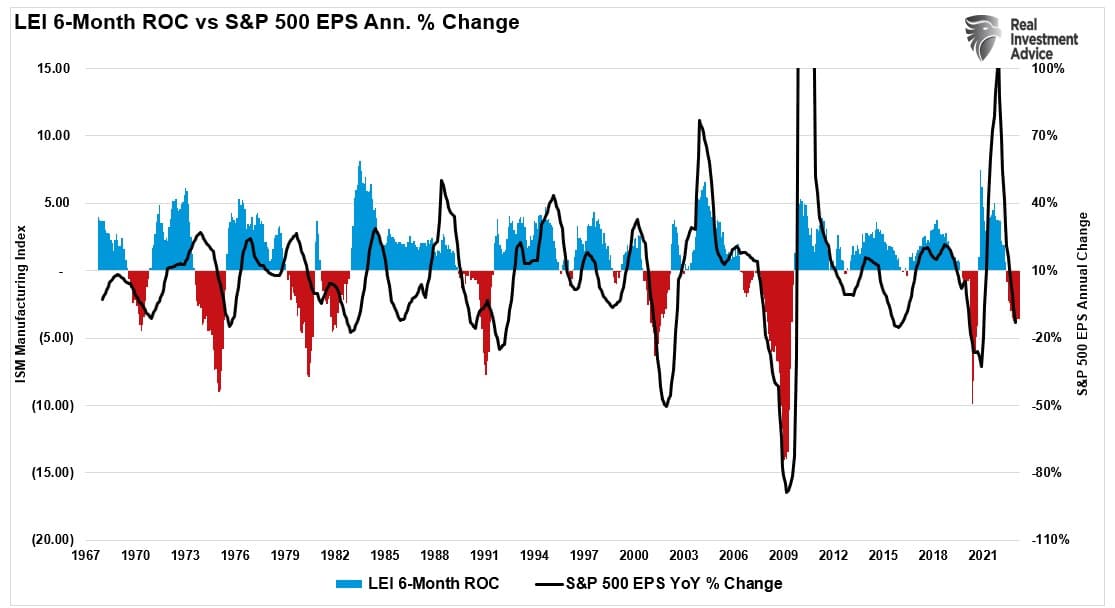
However, it isn’t just the yield curve indicator we are watching but also the Leading Economic Index (LEI), particularly its 6-month rate of change. As a recession indicator, the LEI has a flawless track record of warning of impending downturns.
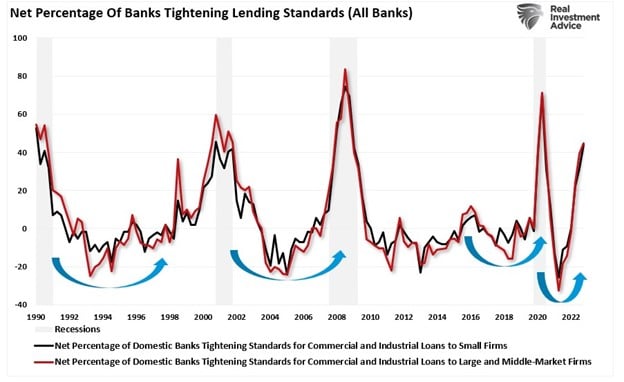
While the S&P 500 Index and the 10-year yield are essential components of the leading economic index, credit conditions are also critical. Tighter credit conditions lead to slower lending, which reduces economic activity. The surge in tighter lending standards has been a historically reliable indicator of recessions.
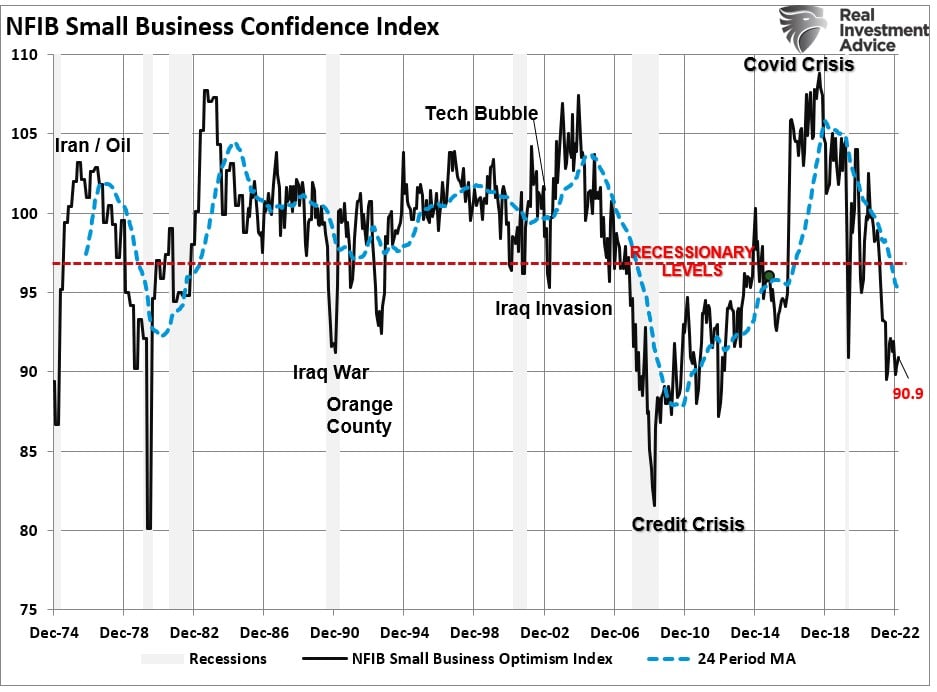
Of course, while individuals comprise roughly 70% of the economic equation, small businesses, which employ nearly 50% of the working population, are another crucial indicator. With small businesses’ confidence at levels not seen since the financial crisis, their willingness to employ, expand, or produce is increasingly restricted. Such is particularly the case as banks pull back on lending.
Different areas of the economy and financial activity impact all of these indicators. However, our Economic Output Composite Index (EOCI), which comprises more than 100 data points of manufacturing and service data, is at levels that have previously coincided with recessions. Despite measuring the economy differently, the EOCI maintains a high correlation to the LEI.

After reviewing these indicators, which have a near-perfect track record of predicting a recession, there is little doubt that an economic downturn is forthcoming.
However, analysts don’t think this is the case.
Analysts Are Raising Estimates
I wrote an article in November 2022 discussing the analyst’s views of the “No Recession” scenario.
“Importantly, under the soft landing scenario, our economists forecast below-trend GDP growth will be accompanied by just a 1/2 point increase in the unemployment rate to 4.1%, and the US economy will avoid recession in 2023.”
The view has important implications for equity performance next year. If there is ‘no recession in 2023,’ then such would suggest the decline in corporate earnings and profit margins is complete. Therefore, such would indicate that equities are fairly valued at current levels supporting the return of a more bullish trend.
Currently, the Bloomberg Economic Growth Consensus for the U.S. economy is rising, with only one-quarter of negative growth expected.

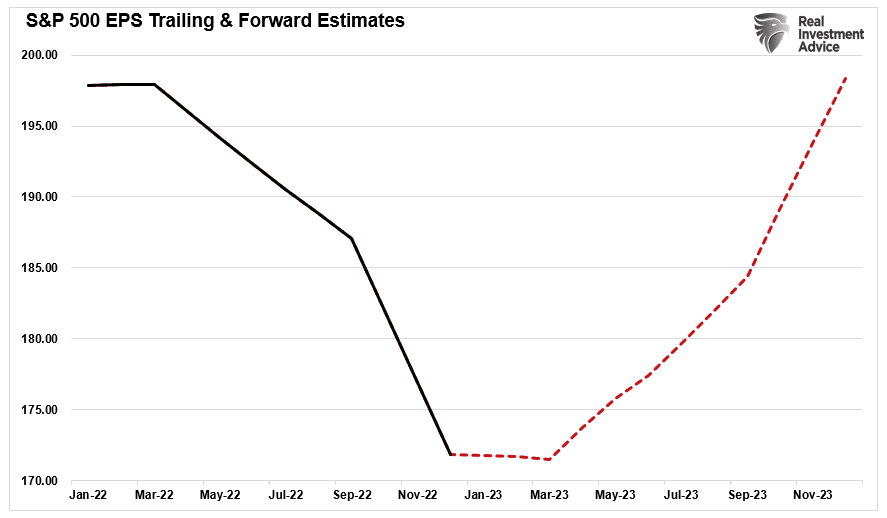
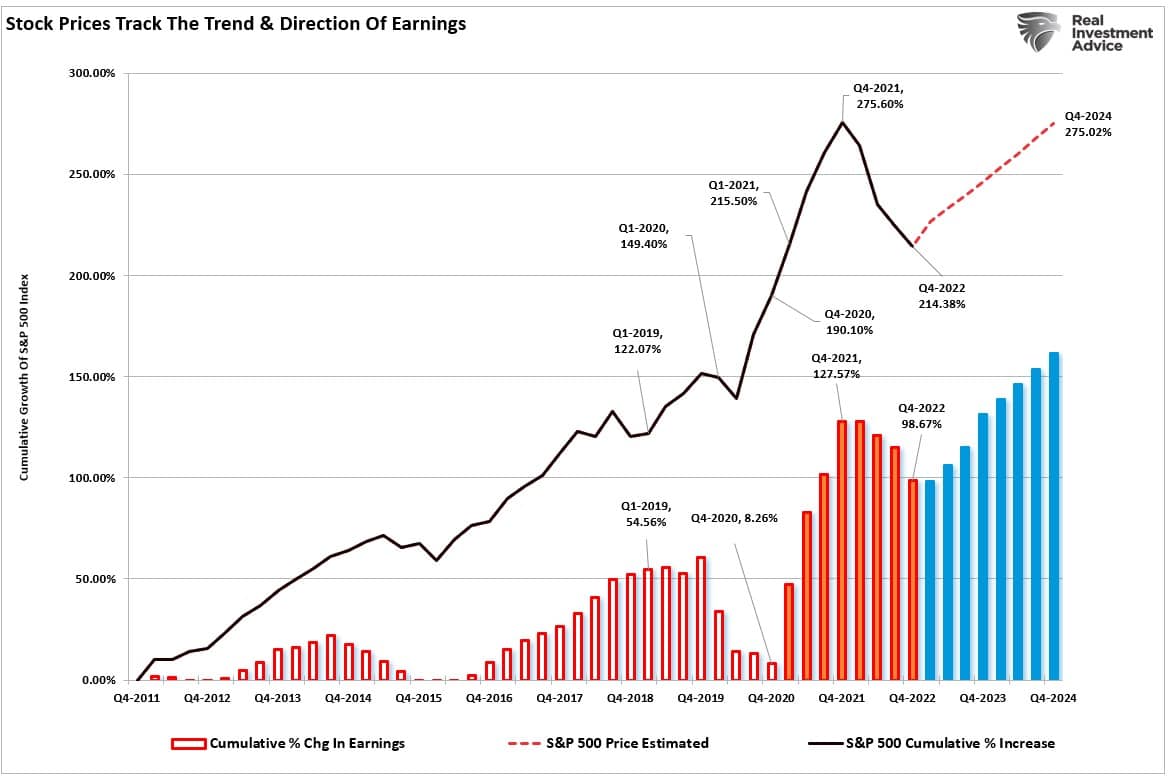
Given that earnings are derived from economic activity, then the current decline in earnings should bottom before the trough in economic activity. Interestingly, in mid-March, S&P Global released its earnings forecast for the S&P 500 through the end of 2024. As with economic analysts, S&P also sees earnings bottoming in the first quarter and returning to its January 2022 peak.
The financial markets have factored in these improving outlooks since the October lows. Such is unsurprising as investors begin to pay up for investments based on more robust forecasts. Therefore, if the earnings forecasts are correct, the market should reflect those forecasts and rise toward the previous market peak.
As investors, we must acknowledge the “possibility” of a soft landing scenario. However, as noted above, the “probabilities” of a recession seem significant.
Someone Is Going To Be Wrong
For investors, the challenge will be discerning who is right or wrong.
If the analysts are correct, earnings have likely troughed, and stock prices will rise into 2023. Such will mark the bottom of the “bear market” as of October 2022. If incorrect, the economy will slow as a recession sets in, earnings will decline as unemployment rises, and stock prices will fall further. Since the LEI index has a high correlation to the change in economic growth and earnings, we need to pay attention to it for positive changes.
The apparent debate is whether these recession indicators are wrong for the first time since 1974. The massive surge in monetary stimulus (as a percentage of GDP) remains highly elevated, which gives the illusion the economy is more robust than it likely is. As the lag effect of monetary tightening takes hold later this year, the reversion in economic strength will probably surprise most economists.
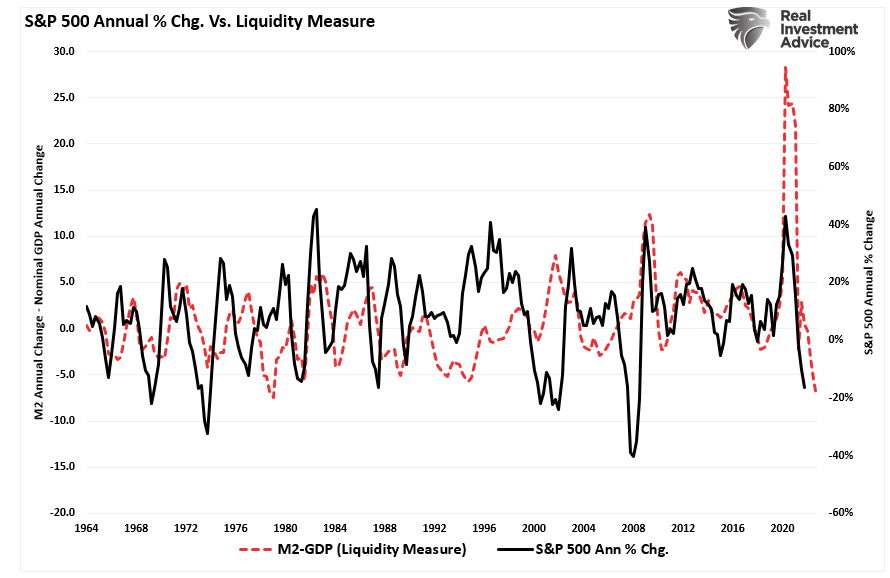
For investors, the implications of reversing monetary stimulus on prices are not bullish. As shown, the contraction in liquidity, measured by subtracting GDP from M2, correlates to changes in asset prices. Given there is significantly more reversion in monetary stimulus to come, such suggests that lower asset prices will likely follow. However, a reversal of liquidity would support the rise in asset prices.
Sure, this “time could be different.” The problem is that historically such has not been the case. Therefore, while we must weigh the possibility that analysts are correct in their more optimistic predictions, the probabilities still lie with the indicators.
However, such is why, as investors, we must remain nimble in our investment approach and trade the market for what we have rather than what we wish it to be.
How We Are Trading It
One of the most common emails of the past couple of weeks has been:
“Are you crazy increasing equity exposure in the middle of a banking crisis.”
That’s the cleaner version.
As noted above, there is quite a contradiction between what seems logical and supported by indicators and what expectations and markets are doing. As mentioned, “someone is going to be wrong.”
The problem is that we don’t know who will be wrong with absolute certainty.
Therefore, all we can do for now is continue to follow our portfolio guidelines, focus on our technical indicators, monitor short-term risks, and adjust allocations accordingly. While we did increase our equity exposure over the last two weeks, we remain decently underexposed to equities. However, that amount of equity exposure remains challenging, given that recessionary risks have increased. However, we will adhere to our discipline accordingly to help offset our base emotional reactions.
As noted last week, you can increase exposure accordingly if you are underweight equity risk.
- Move slowly. There is no rush to make dramatic changes.
- DO NOT try and fully adjust your portfolio to your target allocation in one move.
- Begin by selling laggards and losers.
- Move “stop-loss” levels up to recent lows for each position.
- Be prepared to sell into the rally and reduce overall portfolio risk. As the rally ensues, you will start to second-guess selling. Avoid that emotional trap and follow through with your plan.
- If these rules make no sense, please consider hiring someone to manage your portfolio. It will be worth the additional expense over the long term.
While increasing exposure near-term, we are cautiously allowing the market to dictate these changes. However, we will reverse this process when “sell” signals re-emerge.
Have a great week.
Research Report
Subscribe To “Before The Bell” For Daily Trading Updates (Formerly 3-Minutes)
We have set up a separate channel JUST for our short daily market updates. Be sure and subscribe to THIS CHANNEL to receive daily notifications before the market opens.
Click Here And Then Click The SUBSCRIBE Button
Subscribe To Our Youtube Channel To Get Notified Of All Our Videos
Stock Of The Week In Review
In the wake of the failure of Silicon Valley Bank and Credit Suisse, bank balance sheets will come under scrutiny by their executives and regulators. One likely impact will be that they sell assets when possible and tighten their lending standards.
Given the importance of debt-driven consumption, tighter lending standards often accompany recessions. As such, we thought it would be helpful to find five stocks that may likely suffer if lending standards and borrowing rates increase during an economic slowdown.
Our critical screening criteria for this task is the interest coverage ratio. The ratio is derived by dividing a company’s earnings before interest and taxes (EBIT) by its interest expense. A ratio below one implies the company cannot meet its interest payments without selling assets or additional borrowing. These are often called zombie stocks.
Here is a link to the full SimpleVisor Article For Step-By-Step Screening Instructions.
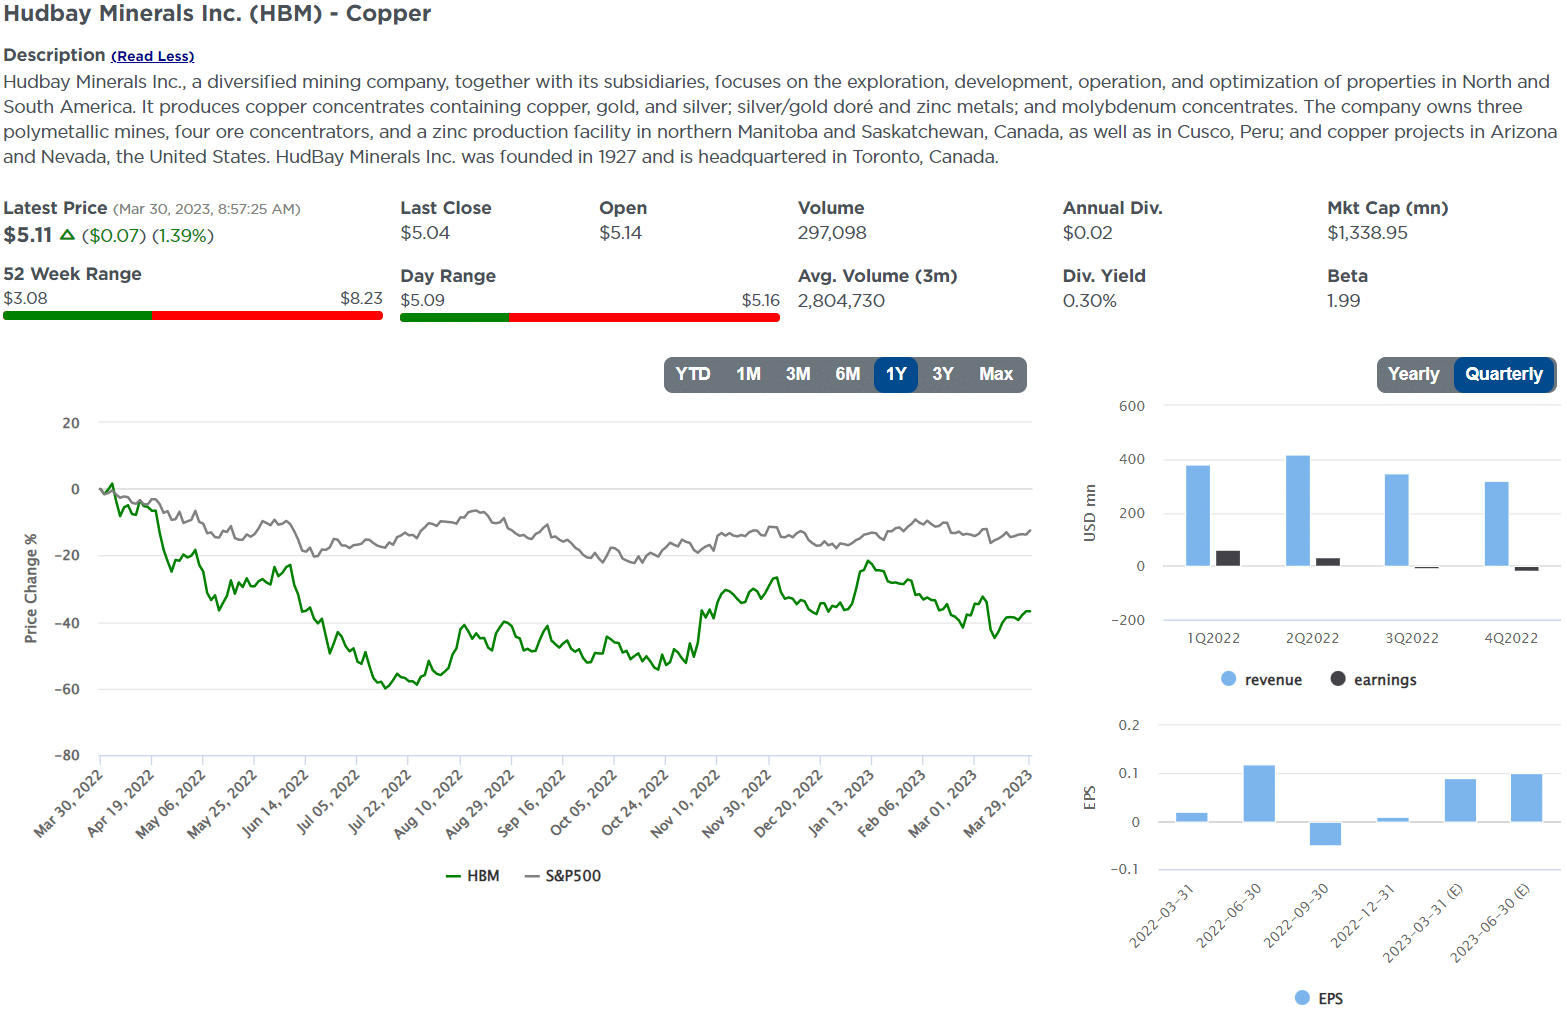
Login to Simplevisor.com to read the full 5-For-Friday report.
Daily Commentary Tidbits
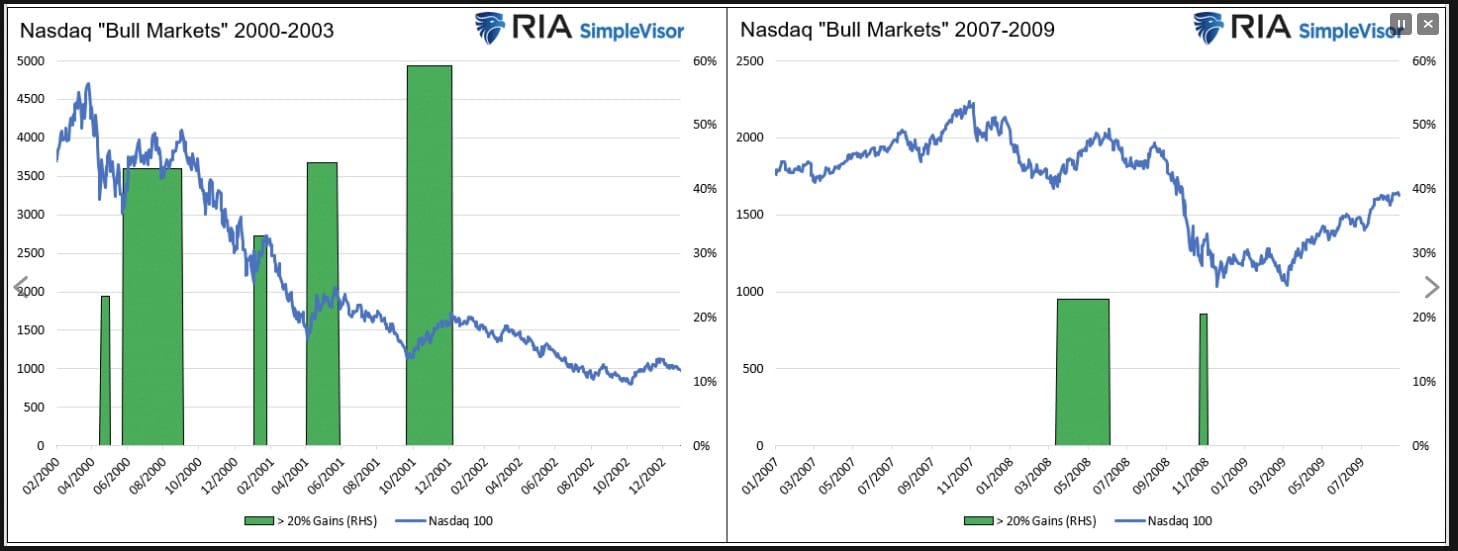
Bloomberg heralds “Nasdaq 100 Enters Bull Market as Bank Jitters Ease.” The Nasdaq is now up over 20% from recent lows, leading many media outlets like Bloomberg to declare the birth of a new bull market. Many investors seem to associate 20% declines with the start of bear markets and 20% increases with the beginning of bull markets. As investors, we must decide whether a simple rule of thumb is worth following.
We present two arguments for consideration. First, we do not believe the “bull market” since 2009 ended. Per our article, A 50% Decline will only be a Correction:
- A bull market is when the market price is trending higher over a long-term period.
- A bear market is when the previous positive trend breaks and prices trend lower.
The article questions whether the swoon in March 2020 was the start of a bear market. We state:
“The price decline in March 2020 was unusually swift using monthly closing data. However, that decline did not break the long-term bullish trend and quickly reversed to new highs, suggesting it was a “correction.”
Second, as we share below, history doesn’t always agree that 20% increases signify the beginning of bull markets. The Nasdaq dot.com crash saw five “bull markets” until a bottom was found. There were two during the financial crisis.
(Subscribe To The Daily Market Commentary For A FREE Pre-Market Email)
Bull Bear Report Market Statistics & Screens

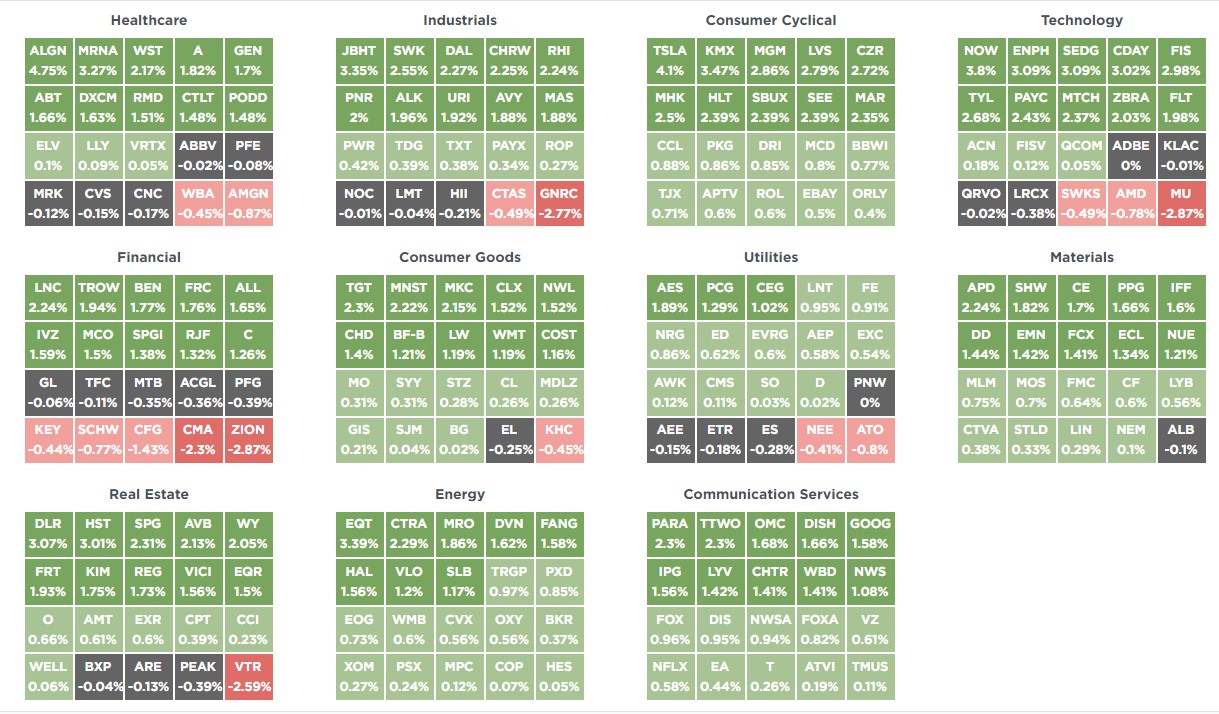
SimpleVisor Top & Bottom Performers By Sector
S&P 500 Weekly Tear Sheet

Relative Performance Analysis
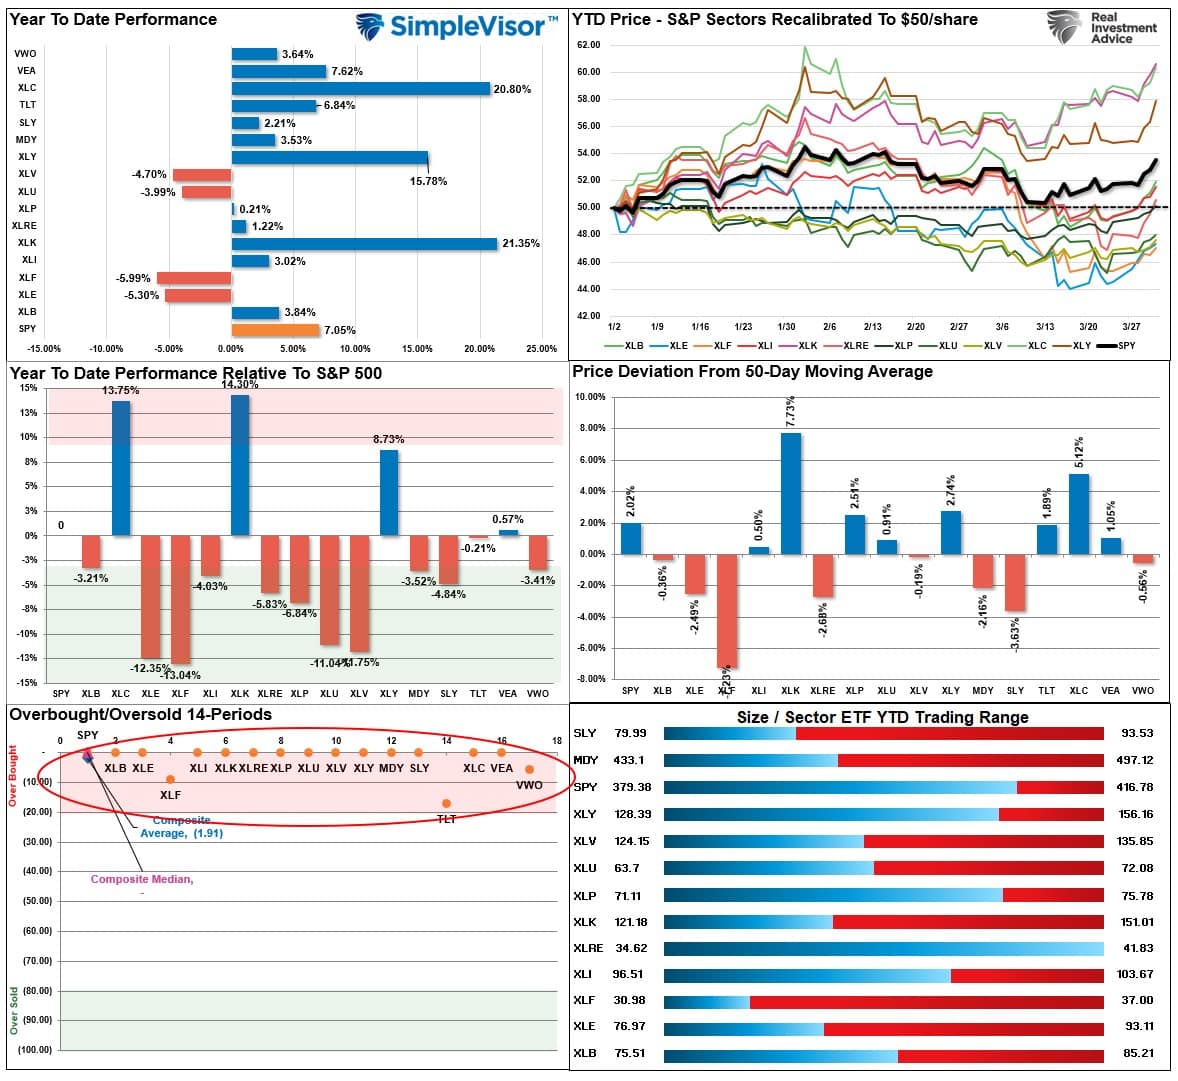
After last week’s bullish push higher, every major sector and market is now highly overbought short-term. Look for a bit of correction next week, which will provide an opportunity to increase exposure for the next couple of weeks. April tends to be one of the more robust performance months of the year, and while markets are short-term overbought, they remain on solid bullish buy signals for now.
Technical Composite
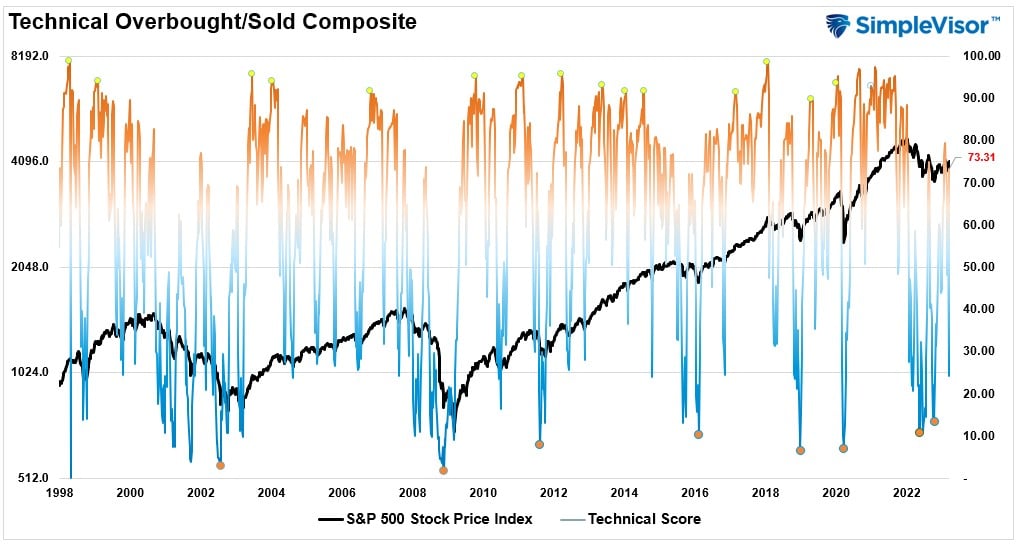
The technical overbought/sold gauge comprises several price indicators (RSI, Williams %R, etc.), measured using “weekly” closing price data. Readings above “80” are considered overbought, and below “20” are oversold. Markets peak when those readings are 80 or above, suggesting prudent profit-taking and risk management. The best buying opportunities exist when those readings are 20 or below.
The current reading is 73.21 out of a possible 100.
Portfolio Positioning “Fear / Greed” Gauge
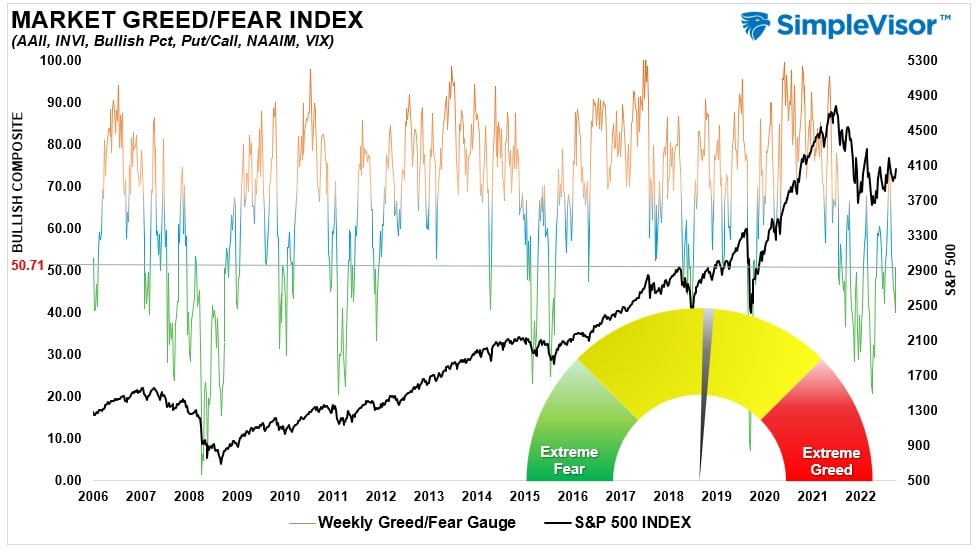
The “Fear/Greed” Gauge is how individual and professional investors are “positioning” themselves in the market based on their equity exposure. From a contrarian position, the higher the allocation to equities, the more likely the market is closer to a correction than not. The gauge uses weekly closing data.
NOTE: The Fear/Greed Index measures risk from 0 to 100. It is a rarity that it reaches levels above 90. The current reading is 50.71 out of a possible 100.
Sector Model Analysis & Risk Ranges
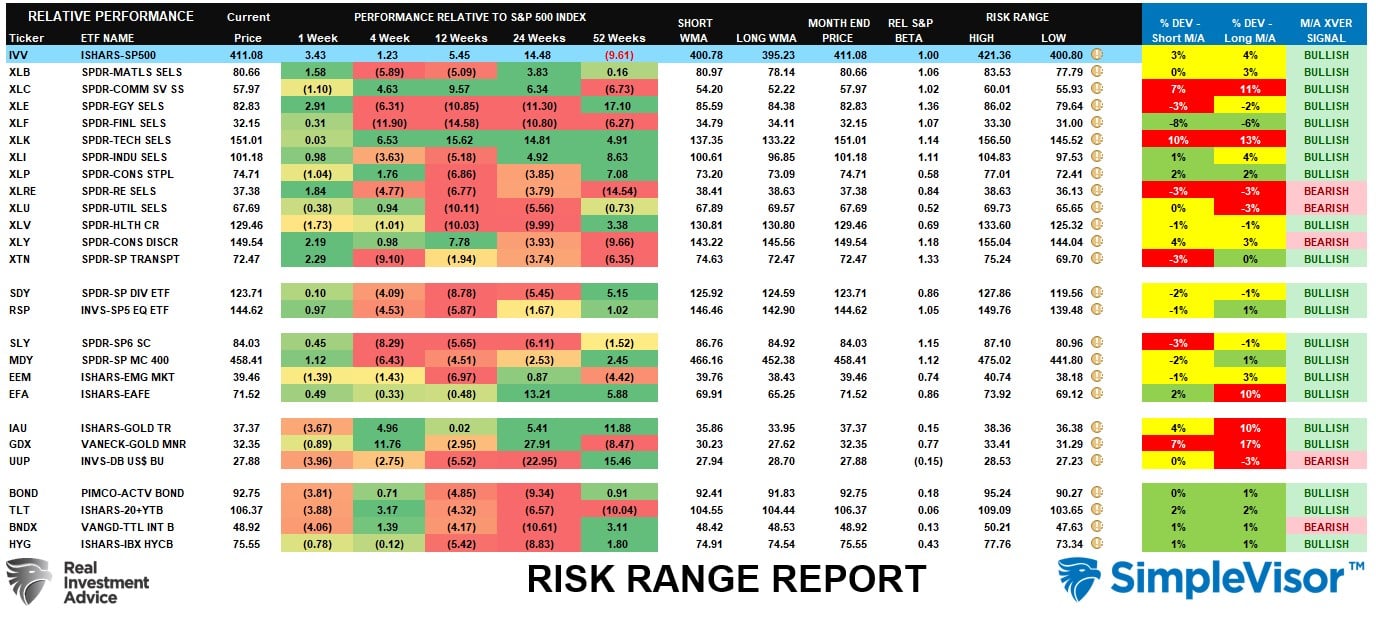
How To Read This Table
- The table compares the relative performance of each sector and market to the S&P 500 index.
- “M” XVER” “Moving Average Cross Over) is determined by the short-term weekly moving average crossing positively or negatively with the long-term weekly moving average.
- The risk range is a function of the month-end closing price and the “beta” of the sector or market. (Ranges reset on the 1st of each month)
- The table shows the price deviation above and below the weekly moving averages.
The Risk/Range report resets on the first of the month; therefore, range breaks won’t be visible until next week. However, it is essential to note that except for Real Estate, Utilities, Discretionary, the Dollar, and International Bonds, every other sector and market is in a bull market. Historically, there has NEVER been a “bear market” when so many sectors and markets are in bullish trends after just reversing from bearish trends. Yes, this time could be different, but an increasing number of indicators are suggesting the 2022 correction is over.
Weekly SimpleVisor Stock Screens
We provide three stock screens each week from SimpleVisor.
This week we are searching for the Top 20:
- Relative Strength Stocks
- Momentum Stocks
- Fundamental And Technically Strong Stocks
(Click Images To Enlarge)
RSI Screen

Momentum Screen

Fundamental Stocks With Strong Technicals

SimpleVisor Portfolio Changes
We post all of our portfolio changes as they occur at SimpleVisor:
March 27th
In this past weekend’s newsletter, we discussed the multiple “buy signals” the market registered, suggesting that with the “banking crisis” stabilized in the short term, the market could muster a rally to roughly 4100. To wit:
“With these buy signals in place, investors should modestly increase equity exposure, as the likely path for stock prices is higher over the next couple of weeks to months. However, with the banking crisis unfolding, such could limit any upside to equity prices near term until the crisis is “contained” or the Fed reverts to monetary accommodation.”
With that, we are adding a small S&P 500 (VOO) trading position to our portfolio to complement the Nasdaq (QQQ) and S&P Equal Weight (RSP) positions we added last week.
Equity And ETF Models
- Initiate a 2.5% position of the total portfolio to the Vanguard S&P 500 Index ETF (VOO)

Lance Roberts, CIO
Have a great week!

