Despite the Debt Cap circus and continual default threats, the dollar has bounced 2% over the last few weeks. Is the dollar finally gaining some footing after falling 15% since late 2022, or is it consolidating before another leg lower? The direction of the dollar is meaningful. First, a weaker dollar is inflationary as the cost of imported goods rises in dollar terms. Second, corporate earnings tend to be negatively affected by a weaker dollar as they repatriate profits at lower dollar levels, but their exports are more price competitive. Third, U.S. bonds become more attractive to foreign investors. Lastly, foreign borrowers of debt benefit from lower interest costs and principal payments as their currency strengthens versus the dollar. It is also worth noting many financial assets go through periods of strong correlation, positive or negative, with the dollar.
The graph below shows the steep 28% bounce in the dollar index from mid-2021 to late 2022. Since then, it has given up a third of its gains. The resulting pattern is what technicians call a pennant or continuation pattern. Per Investopedia, “a pennant is a type of continuation pattern formed when there is a large movement in a security, known as the flagpole, followed by a consolidation period with converging trend lines—the pennant—followed by a breakout movement in the same direction as the initial large movement, which represents the second half of the flagpole.” Will the pattern be bullish, resulting in another significant dollar bounce higher? Or, will the dollar’s bounce of 2021 and 2022 vanish as the Fed relents to a more neutral or even dovish stance going forward? The second graph shows the MACD has a bullish positive divergence.

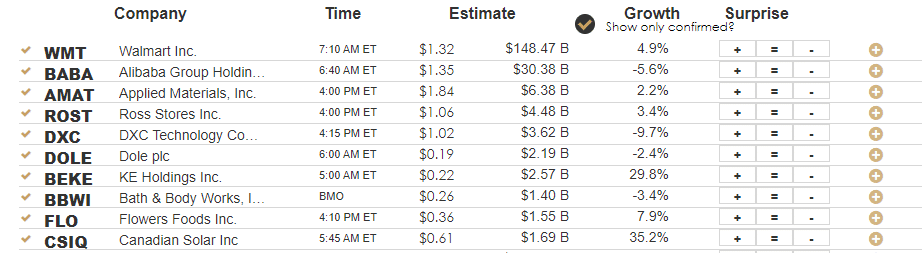
What To Watch Today
Earnings
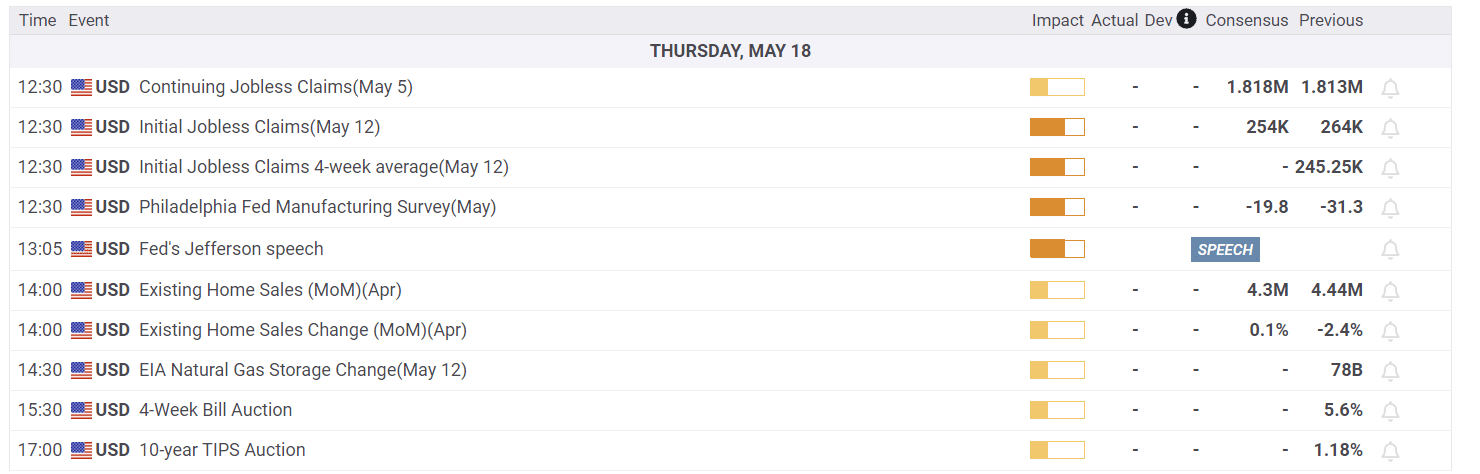
Economy
The New T.I.N.A. Is Not The Old T.I.N.A.
What is TINA? TINA is an acronym for the phrase “There is no alternative.”
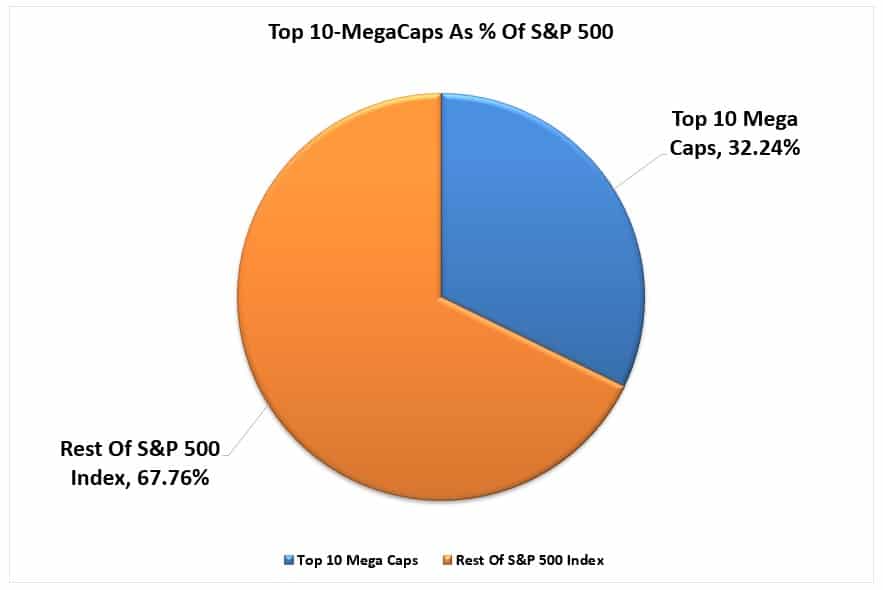
For investment managers, generating performance is necessary to limit “career risk.” If a manager underperforms their relative benchmark index for very long, they most likely won’t have a “career” in the investment management business. Currently, there are two drivers for the mega-capitalization stock chase. First, these stocks are extremely liquid and easy to quickly move money into and out of without significant price movements. The second is the passive indexing effect. As investors move money back into the market, it unequally flows into the largest capitalization stocks in the index.
As shown, for each $1 invested in the S&P 500 index, $0.32 cents flow directly into the top 10 stocks. The remaining $0.68 cents is divided between the remaining 490 stocks. This “passive indexing effect” has changed the market dynamics over the last decade.
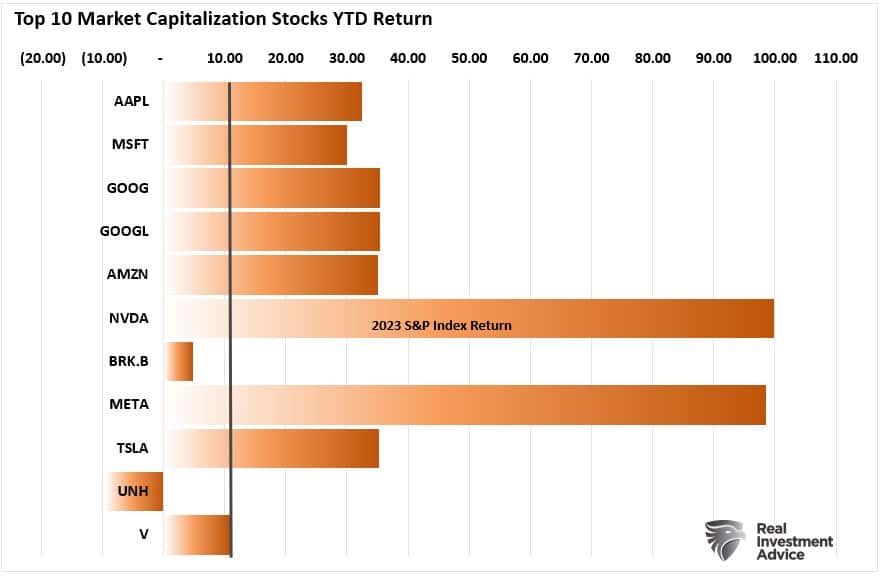
When looking at the year-to-date performance of those top 10 stocks, it is clear where the overall index’s performance is coming from.
As my colleague Doug Kass recently noted in his always excellent daily digest.
“Today, TINA can arguably be associated with a small group of large-cap tech stocks – Microsoft, Meta, Apple, Alphabet, Nvidia, and Amazon. To many, there is no alternative to these six stocks, and their leadership is as conspicuous as the last narrow market advance in history…that of The Nifty Fifty.
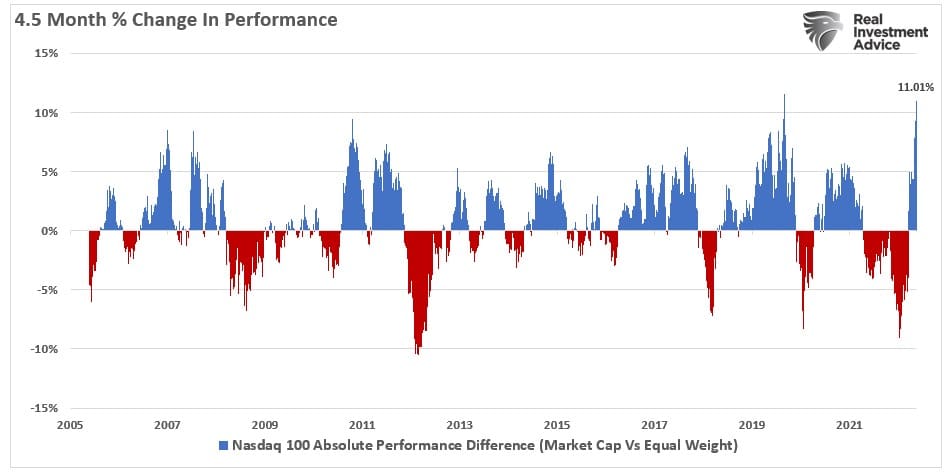
The following chart underscores the remarkable year-to-date outperformance of the unweighted Nasdaq versus the equal-weighted Index. This NDX > NDXE spread is now +11% on the year, by far the widest spread over any 4.5 month period in the last 18 years.”
As Jefferies recently noted, the long technology is now both an extremely overcrowded and overbought trade.
“We have been banging on about the last few days, how the US Tech sector is working on a pretty convincing exhaustion setup. We obviously do not want to go on about the same thing over and over again, but in all fairness, it is the only convincing chart setup right now across pretty much all markets and all assets.
As it is usually with these type of exhaustion outlooks, there is no way to tell, if we get an imminent reaction, or the choppy trading continues. But what can be said with pretty strong confidence is, that upside right now from current levels will be hard to come by.‘
This massive overbought condition of the Technology sector relative to the rest of the market is easily seen in the SimpleVisor Relative Performance Analysis

It is worth noting that such periods of outperformance were ultimately unsustainable. While such does NOT mean the market must experience a mean-reverting event, it does suggest that, at the minimum, there will be a rotation to other market sectors.
One thing is certain: the old T.I.N.A. of chasing stocks due to zero interest rates is not the new T.I.N.A. of performance chasing.

Tom DeMark Says Nasdaq is Exhausted
MarketWatch published a summary of famed market technician Tom DeMark, in which he thinks the Nasdaq, this year’s market darling, is close to peaking. Per MarketWatch:
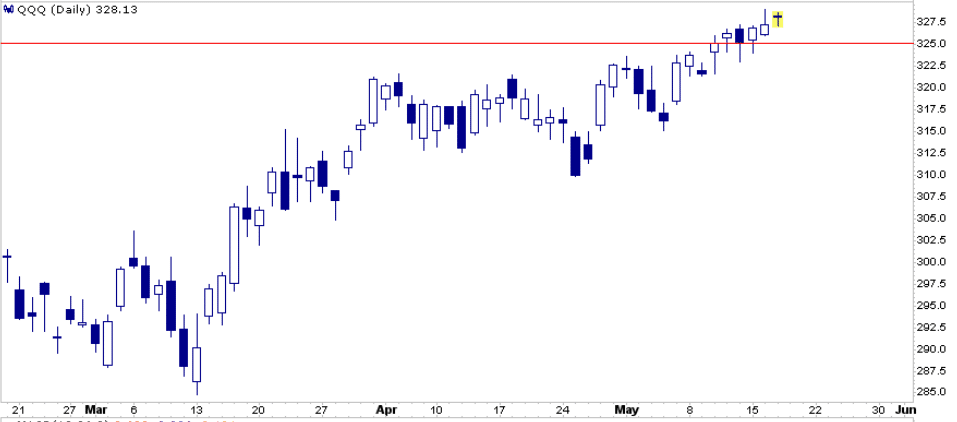
In an email to MarketWatch, DeMark, who has advised investing legends including Paul Tudor Jones, Leon Cooperman and Steven A. Cohen, says the Nasdaq 100 QQQ, has been in an extended uptrend, but now it’s likely approaching exhaustion.
DeMark’s analysis counts the number of days in which the market rises or falls after setting a three day low or high. Essentially the analysis looks to capture strong but unsustainable price trends. His analysis triggers a buy or sell signal when his count reaches 13. Per the article:
“This will be the first time this year Nasdaq 100 time and price trend exhaustion components should be in sync with one another. Once they align, a subsequent close less than both the closes 4 and 5 days prior should confirm the nascent downtrend,” says DeMark.
Based on the quote above, a close below 325 on QQQ would confirm a new downtrend based on DeMark’s model. However, he would like to see two more higher closes first.
Housing Starts
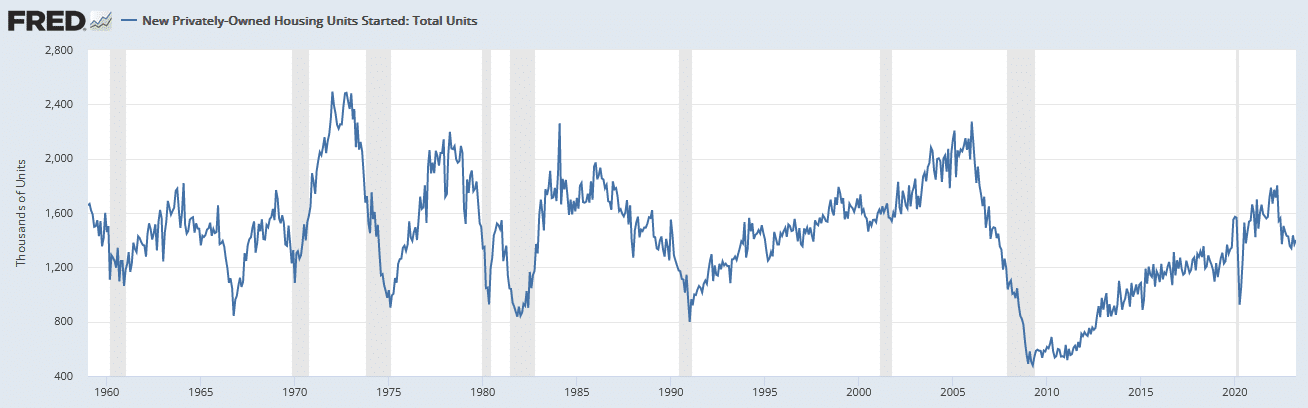
Per the U.S. Census Bureau, a housing start “occurs when excavation begins for the footings or foundation of a building.” Given that it takes at least six months to build a house and up to a couple of years for a multifamily building, housing starts data provide a good leading indicator on construction employment and spending on construction related materials. Given the importance of housing, it also is a key leading economic indicator. The graph below shows housing starts tend to fall before recessions start but trough in most cases during the latter half of a recession.
Yesterday’s the Census Bureau reported that housing starts were down 22% over the last year. Such was the 12th consecutive annual decline. While the longest streak since 2006-2009, the decline is thus far limited. Further, the peak level in April 2022 occurred at the 65 year average, not at an elevated level. Therefore one can make the case that overbuilding was not nearly as big a problem as some of the other pre-recessionary drawdowns. Therefore the decline will also be less signficant.
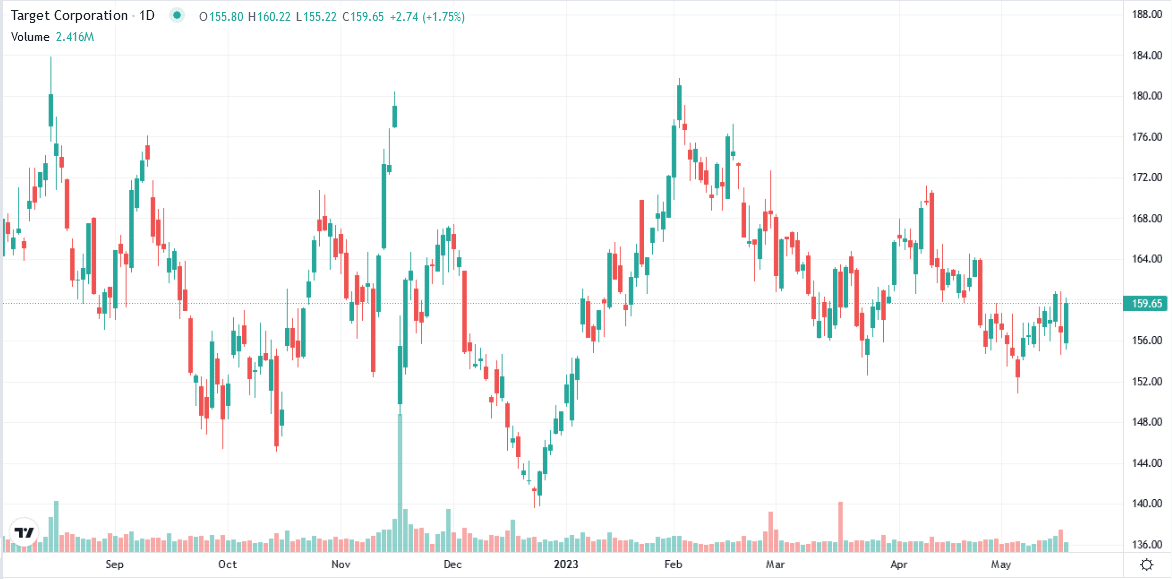
Target Gets Gloomy
Like Home Depot, Target reduced forward earnings guidance as they anticipate weakening consumer spending. Unlike Home Depot, their earnings last quarter beat expectations, and their profit margins improved slightly. While not warning of a recession, like Home Depot, they see ongoing weakness in consumer expenditures. Per Target’s CFO and Chief Growth Officer:
“We are confident that the economy and consumer will stabilize overtime and will once again benefit from growth in that (discretionary) portion.”
“The consumer is under pressure,” Chief Growth Officer Christina Hennington said on a call with reporters. “The consistent inflation, the running out of savings as well as just economic uncertainty in general is having an impact on their choices and they’re making tradeoffs.”
While earnings rose nicely above expectations, revenue matched expectations and only grew by 1% from a year ago. Comparable sales, which do not include new stores, were flat versus last year. Despite flat sales, Target boosted earnings as they reduced inventory by 16%, which resulted in fewer customer discounts. Normalizing freight costs also helped.
The bottom line is that Home Depot and Target are bracing for an economic slowdown and have witnessed flat to negative sales growth for a year.
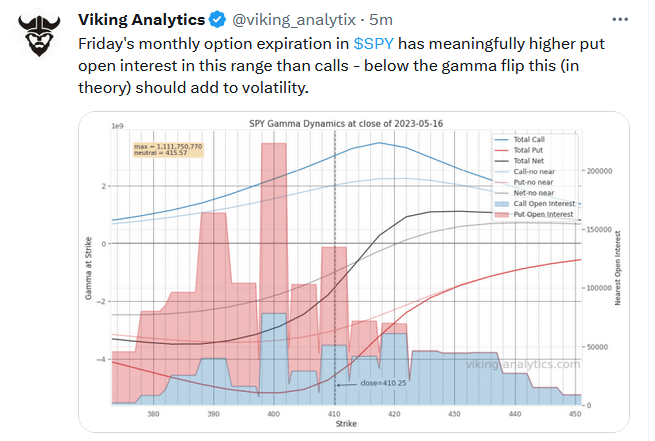
Tweet of the Day
Please subscribe to the daily commentary to receive these updates every morning before the opening bell.
If you found this blog useful, please send it to someone else, share it on social media, or contact us to set up a meeting.

