
Often, boaters take the warning blow of a foghorn for granted and disregard it. However, all skippers seem to pay attention when they hear the scraping of their hull against a reef.
The yield curve is a financial foghorn of sorts. Currently, it is bellowing that something is drastically wrong. As evidenced by earnings growth estimates for 2023, financial skippers are going about their business as if a recession is unlikely.
Yield curve foghorns are often unheeded by investors as they blow well before danger is apparent. As such many investors are unprepared when problems arise.
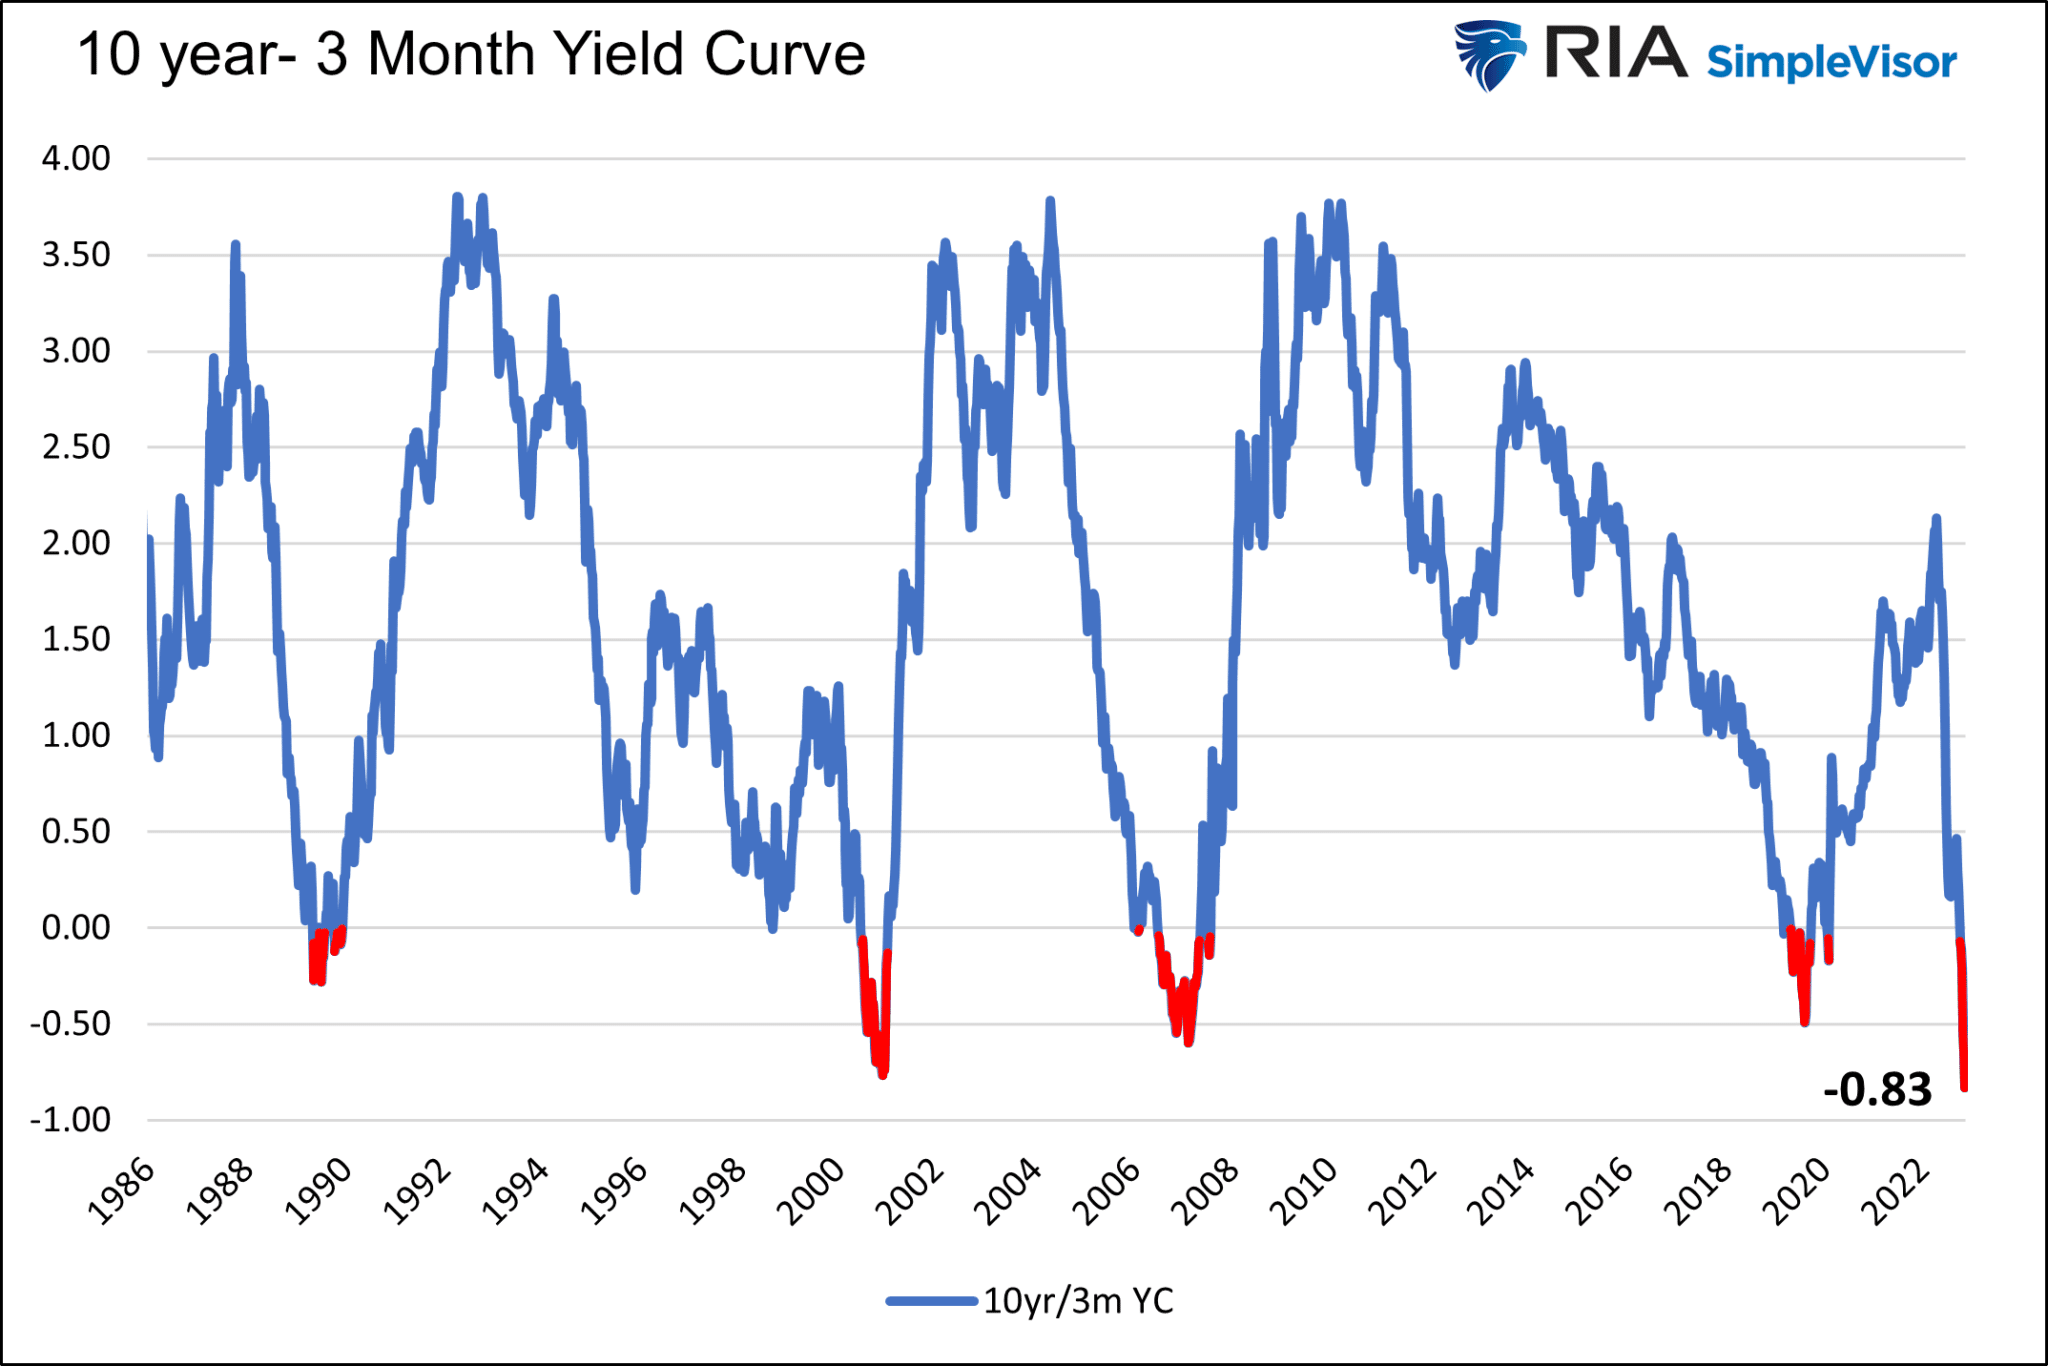
Today, the 10-year/3-month UST yield curve is at its most negative level since 1982, as we share below.
The blast of the financial foghorn is deafening, but the financial waters and economic environment appear relatively calm.
Given the strong possibility that history repeats and the yield curve correctly portends danger, now is the time to examine how and when the yield curve will un-invert, or steepen, and what that might mean for asset prices.
In this article, we use the terms un-invert and steepen interchangeably to describe the yield curve rising from a negative value to a positive one.

The Market’s Foghorn
An inverted yield curve, whereby the yield of a shorter maturity bond is higher than a longer maturity bond, is an omen that something is wrong. Yield curves are often positively sloped. In free markets, investors should receive a higher yield for taking on the potential risks that grow with time. Since 1986, the 10yr/3m yield curve has been in a state of inversion less than 5% of the time.
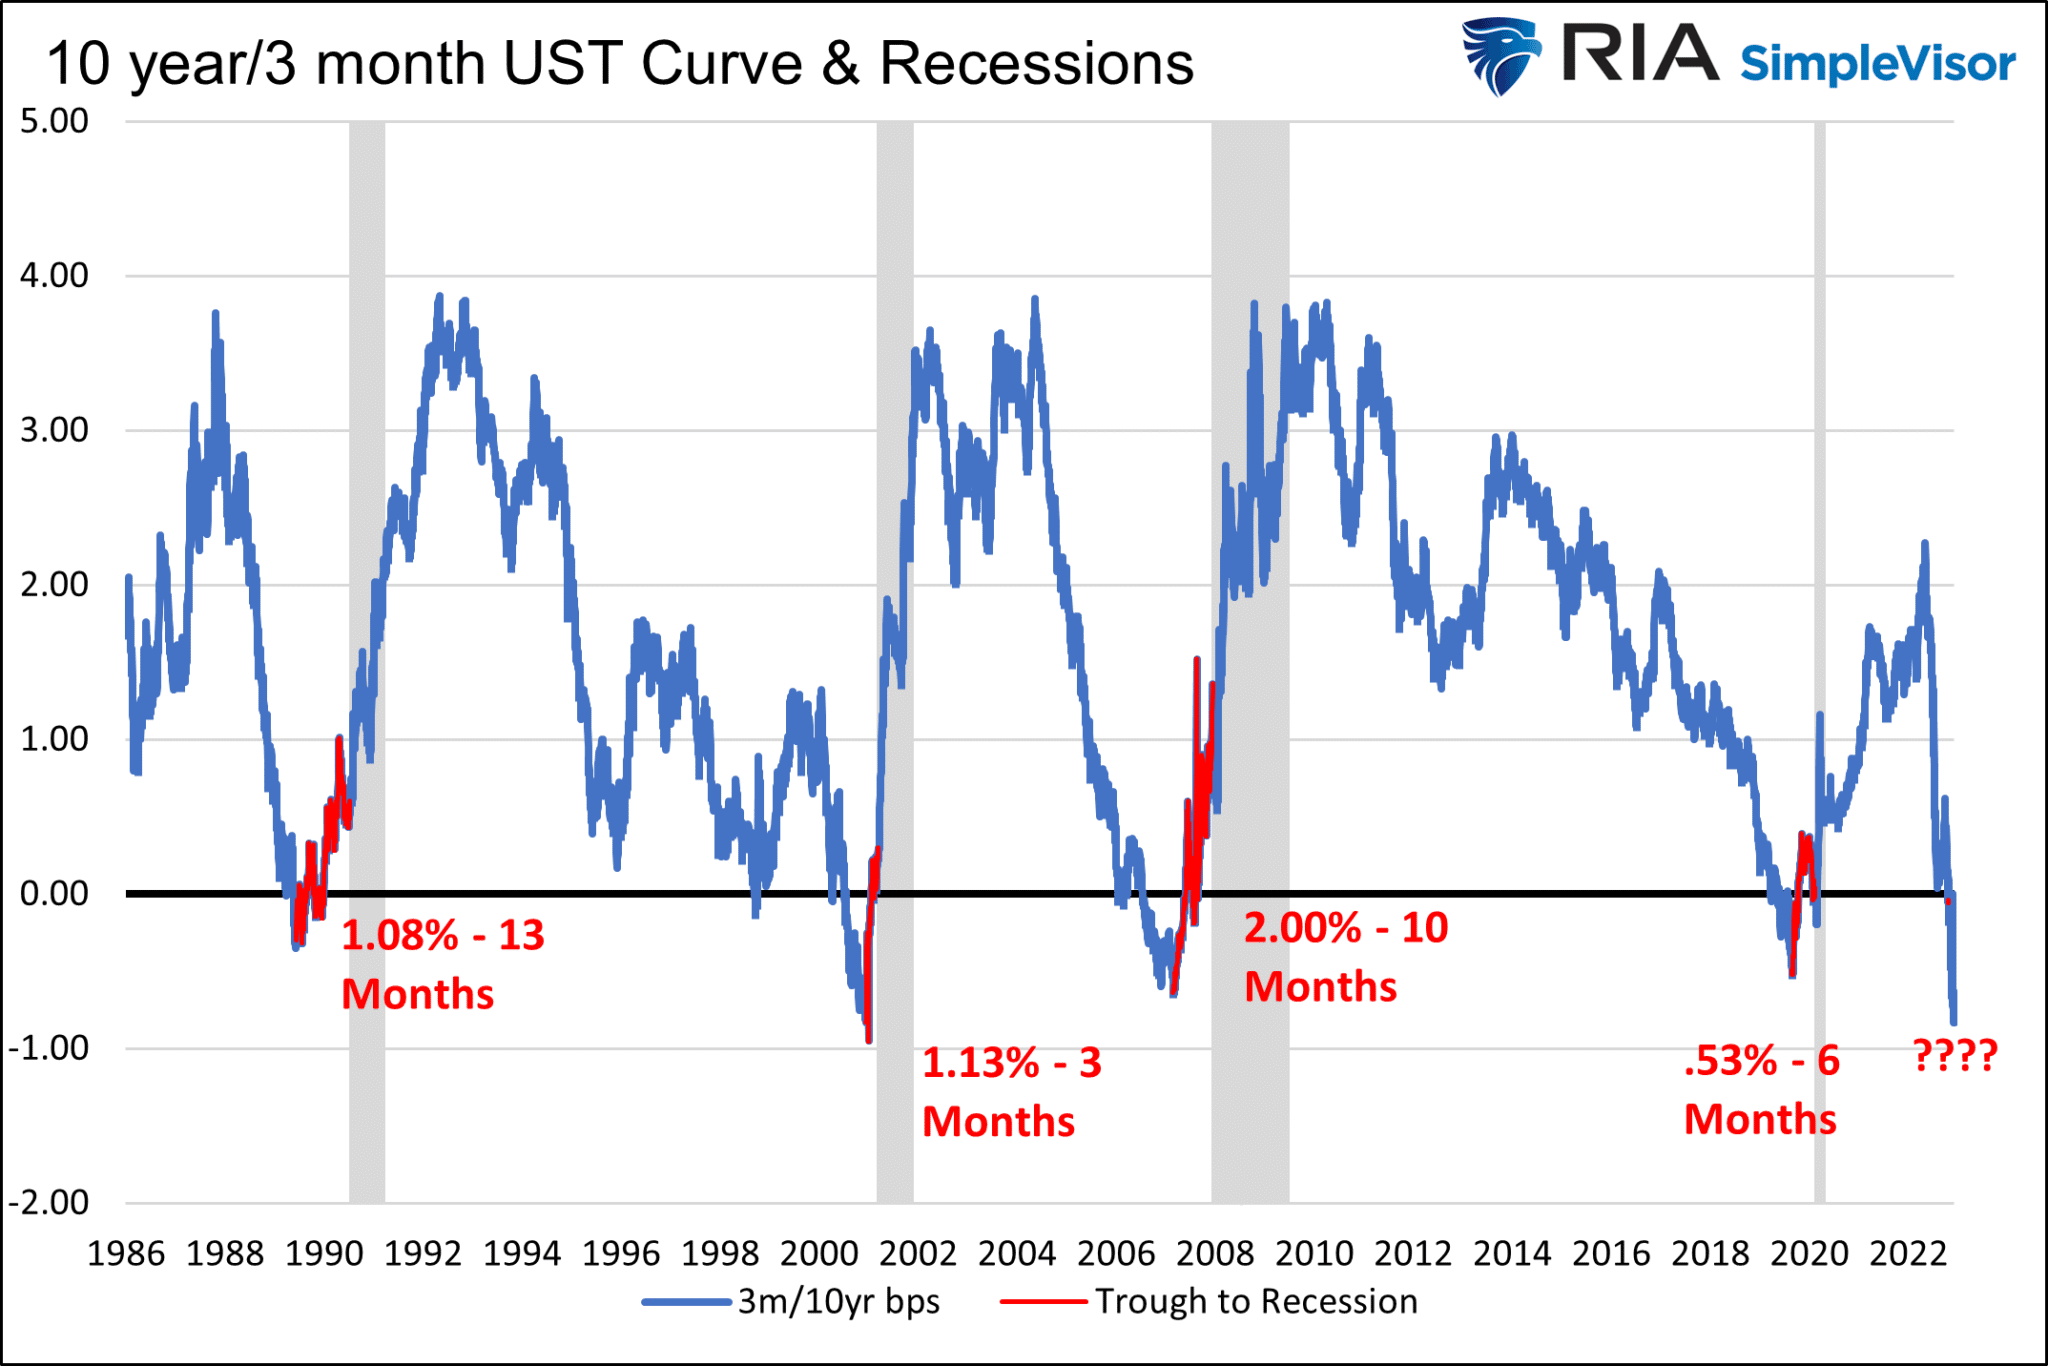
The three graphs below show why an inverted yield curve is a foghorn worth following, even if the current environment doesn’t appear too worrisome.
Since 1986 every yield curve inversion has been followed by a recession. We only show the last four inversions, but be mindful that each of the previous eight inversions led to a recession. However, and this is a common theme in the following graphs, economic and financial hardship did not occur until after the curve steepened to a positive slope. It has taken anywhere from three to thirteen months and .53% to 2% steepening until a recession began.
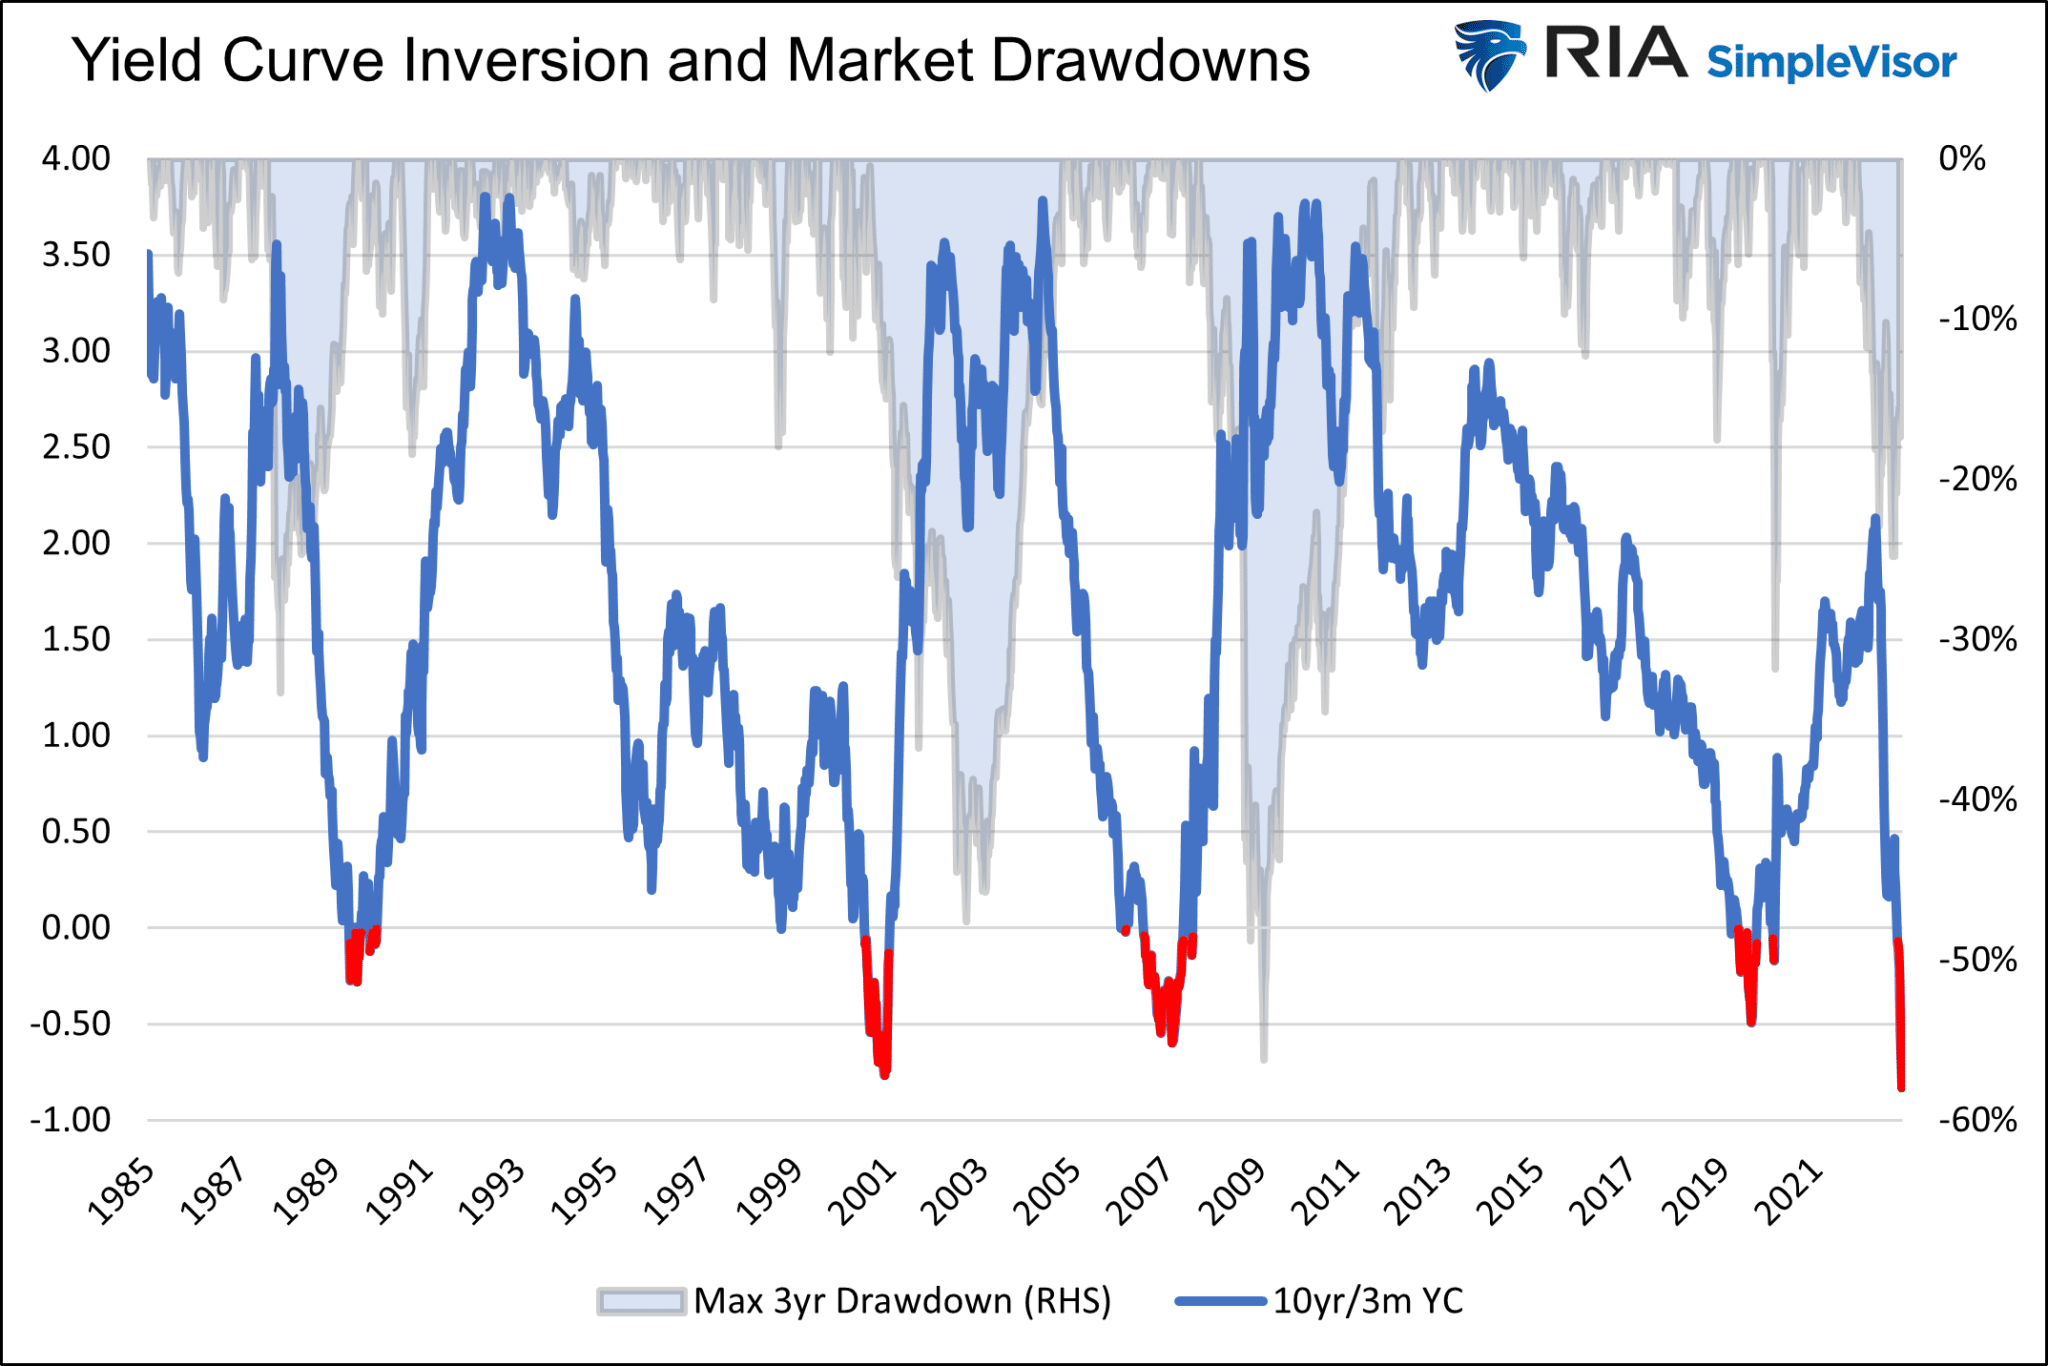
The next graph shows stock market drawdowns follow a similar pattern. In all four inversions, the maximum drawdown in the market occurred after the curve started to steepen.
Lastly, and not surprisingly, stock earnings tend to fall appreciably after the yield curve troughs and regains its positive slope.


How Do Curves Un-invert?
Quickly and in a “V” shaped pattern, as the graphs above show.
The following graph compares the three un-inversions side by side to appreciate the speed and degree to which they normalize. The black vertical lines break the data into one-year increments. We leave out the 2019 example due to the unusual circumstances surrounding the pandemic and the massive fiscal and monetary responses.
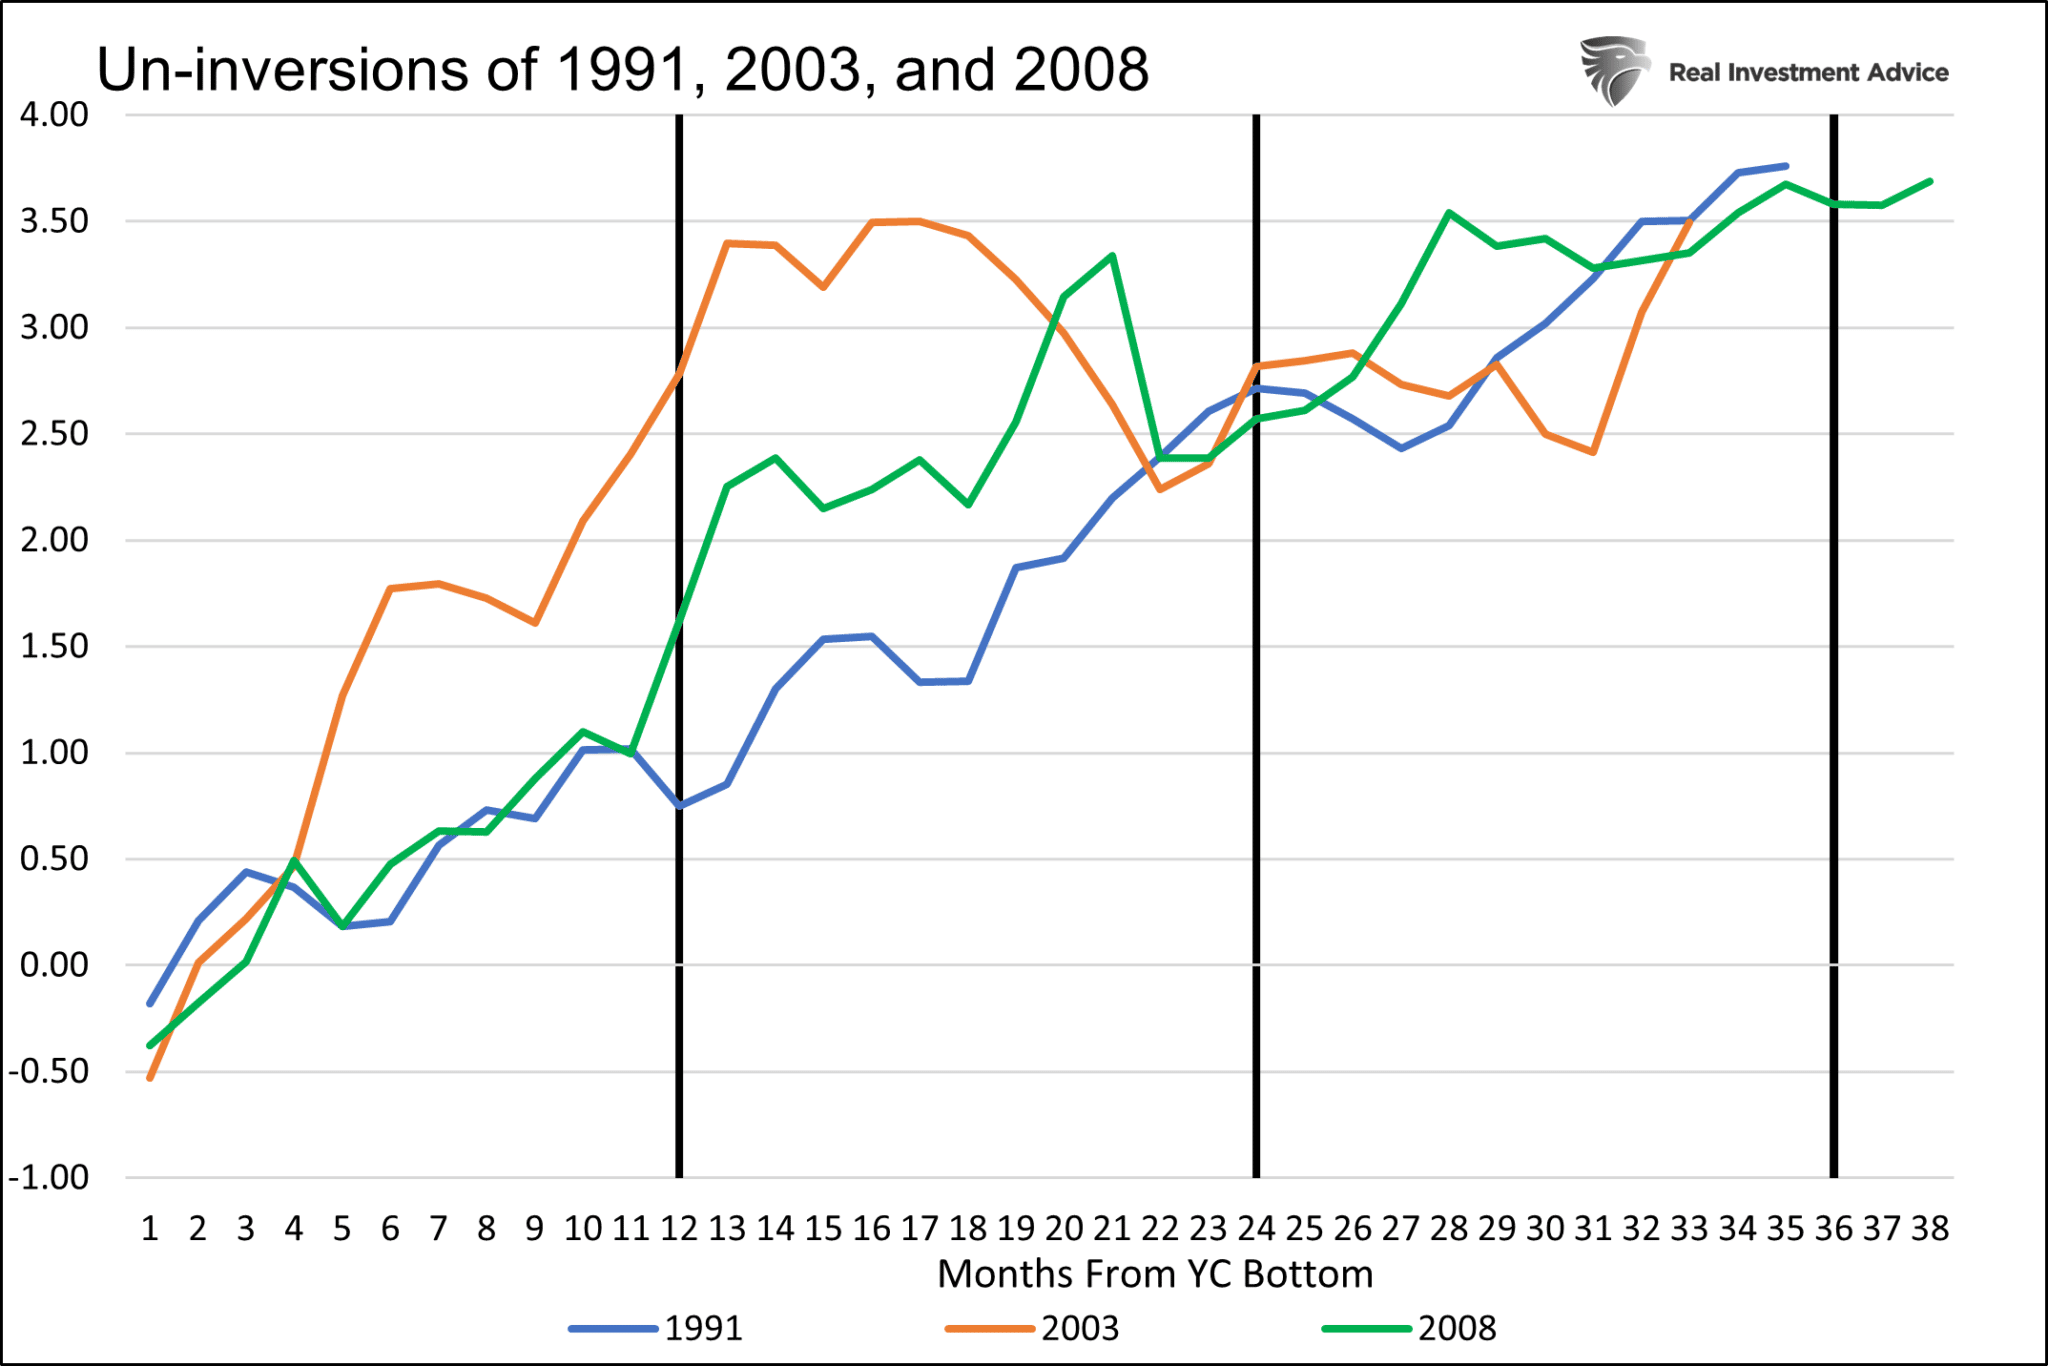
Based on the three episodes, we should expect the curve to be positive by at least 1% and as much as 2.75% within one year of the maximum inversion. Within three years, a +3.5% slope is likely.
In the three cases, the large majority of the curve steepening was due to the short three-month rate plummeting. On average, the ten-year yield fell by 61 basis points, and the 3-month yield fell by 4.62%.
How Will the Curve Un-invert This Time?
Currently, Fed Fund futures forecast a terminal Fed Funds rate near 5%. Assuming that comes to fruition and the ten-year yield stays put, the yield curve will further invert to negative 1.50%.
This is where the analysis gets both problematic and concerning. What conditions might cause the yield curve to normalize?
The following scenarios help us consider the future shape of the curve.
Soft Landing
In this scenario, the economy slows or enters a very mild and short-lived recession. At the same time, the inflation rate falls rapidly.
Assuming this plays out, which we assign a low probability, we expect the Fed to keep rates at 5% or so until inflation is much closer to 2%. In the soft-landing scenario, the 3-month yield is likely to stick around 5%, and the curve might further invert as longer-term yields fall due to weak economic growth and lower inflation. The curve would steepen when the Fed is comfortable that they have slain inflation and can lower the Fed Funds rate. The steepening would be gradual in this scenario, not “V” shaped like the prior inversions.
Something Breaks
In this outcome, which we think is most likely, liquidity reductions and sharply deteriorating economic activity cause financial instability. Under such a scenario, something breaks. It may be a market, a significant financial institution, or even a foreign country. Whatever the cause, the Fed would lower rates aggressively to stop a Lehman-like contagion.
Such would likely entail ending QT and possibly starting QE to boost liquidity in the system. Short-term yields would plummet as the Fed lowers rates. Longer-term yields would initially fall as investors seek the safety of U.S. Treasuries.
Lower inflation, weak economic growth, and a flight to quality/safety argue for much lower rates. However, the monetary and fiscal response, if aggressive like in 2020, might stoke inflationary fears. We saw in the three prior inversions that long yields might decline moderately, but short-end yields could plummet to near 0%.
Fed Forces a Steeper Curve
An inverted yield curve poses problems for banks as it shrinks their net interest margins (NIM), which makes lending less profitable. To help boost their profitability and fortify their balance sheets, the Fed might want to steepen the curve by forcing long-term yields higher.
Per Michael Kao, there is about $2.7 to $3 trillion of floating-rate corporate debt outstanding and a similar amount of floating-rate mortgages. As rates reset higher for floating-rate borrowers, bankruptcies will rise. At the same time, banks are seeing increasing losses on corporate loans and debt, their margins are severely contracting. By steepening the yield curve via higher long-term rates, the Fed could improve bank margins which may help banks better weather a credit storm.
What happens when you cut off a bank’s NIM lifeblood and saddle it with loan losses at the same time? CREDIT CONTRACTION ACROSS ALL LENDING ACTIVITIES AND POSSIBLY EVEN BANK BANKRUPTCIES. – Michael Kao

Two More Warnings
We share two graphs to provide further credence to the roaring yield curve foghorn.
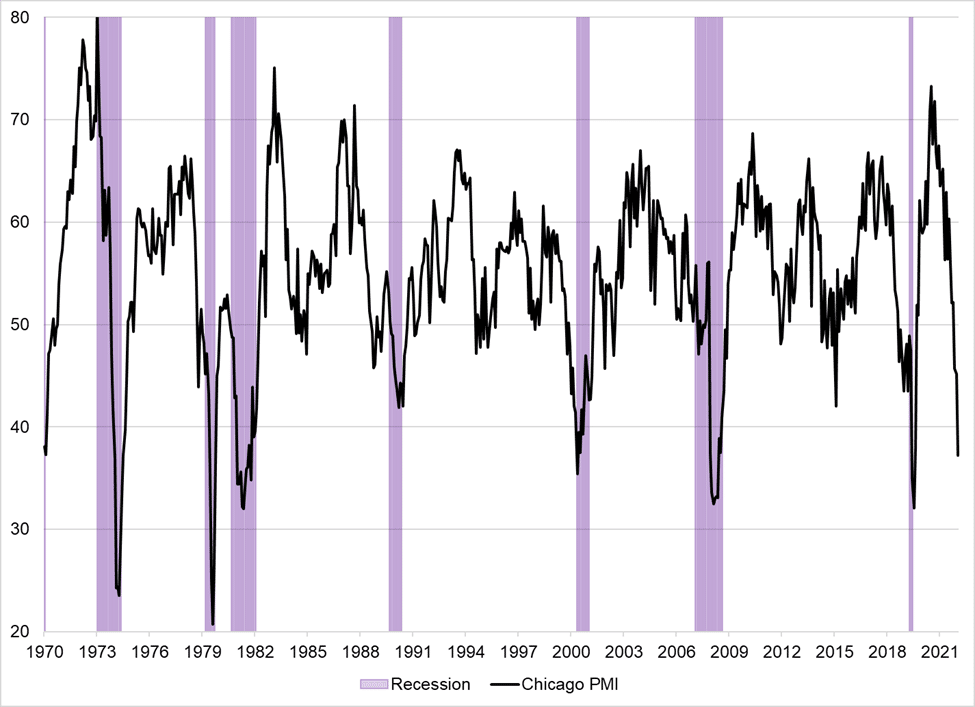
The first graph shows that the last eight times the Chicago PMI report was below 40, as it is now, a recession occurred. While the yield curve tends to precede the recession by months or even a year, this graph argues a recession may be on our doorstep.
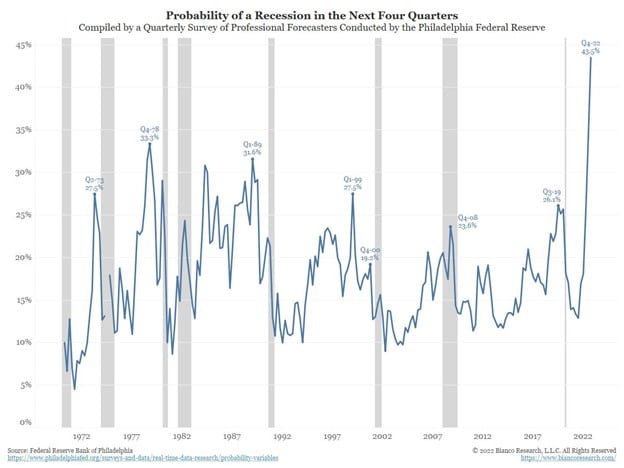
The second graph from Jim Bianco shows the recession odds in 2023 are greater than at any time since 1970.
Summary
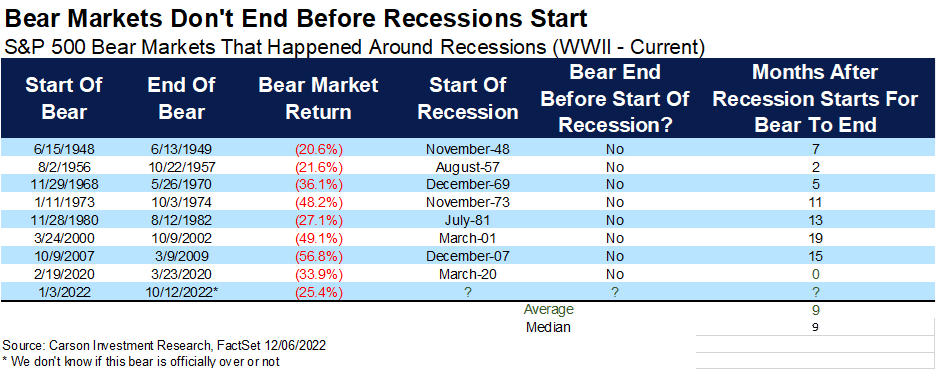
Bear markets do not end until recessions start. The yield curve, Chicago PMI, and other analyses argue it’s a matter of when but if a recession occurs. Based on what we have shared, those claiming the market has already bottomed better hope this time is different.
The financial foghorn is blowing. Historical odds greatly favor a recession, stock market drawdown, and a much lower Fed Funds rate.
As they warn in the HBO series Game of Thrones- “Winter is Coming,” the foghorn tells us so.

