


Social Security has a problem. As Democrats push to expand entitlements to include free preschool and subsidized child care, little attention is getting paid to Social Security is a financial trainwreck.
“The program’s payouts have exceeded revenue since 2010, but the recent past is nowhere near as grim as the future. According to the latest annual report by Social Security’s trustees, the gap between promised benefits and future payroll tax revenue has reached a staggering $59.8 trillion. That gap is $6.8 trillion larger than it was just one year earlier. The biggest driver of that move wasn’t Covid-19, but rather a lowering of expected fertility over the coming decades.” – Stark Realities
Note the last sentence.
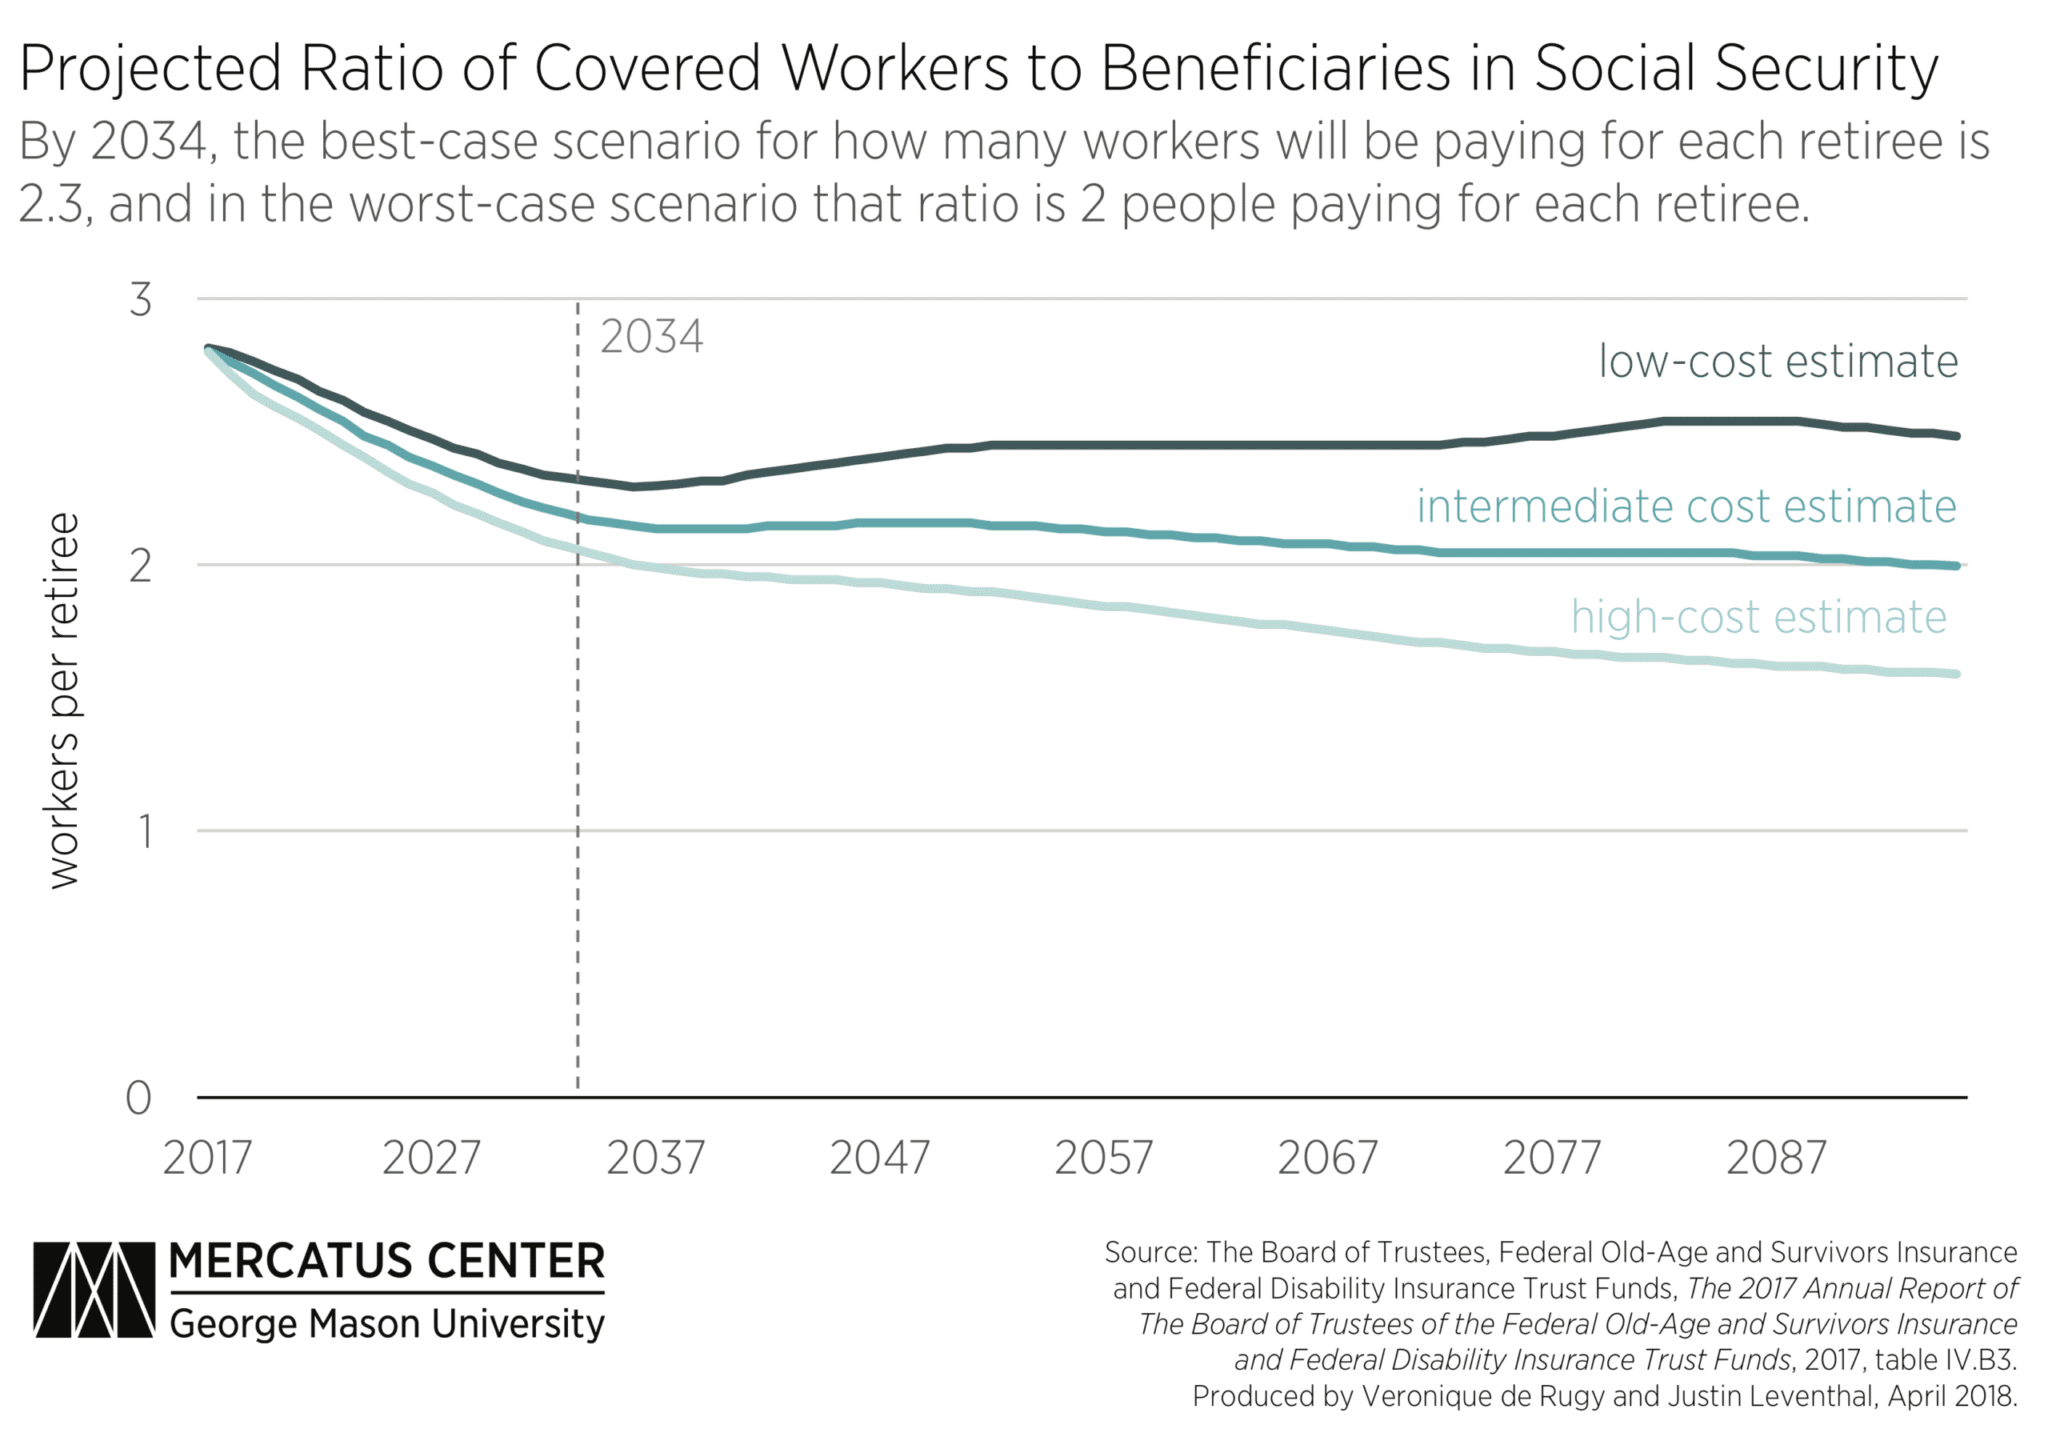
When President Roosevelt first enacted social security in 1935, the intention was to serve as a safety net for the elderly. However, at that time, life expectancy was roughly 60-years of age. Therefore, expectations were that participants would not be drawing on social security for very long from an actuarial basis. Furthermore, roughly 16-workers paid into social security for each welfare participant.
Of course, given that politicians like to use government coffers to buy votes, additional amendments got added to social security to expand the participation in the program. Such included adding domestic labor in 1950 and widows and orphans in 1956. They lowered the retirement age to 62 in 1961 and increased benefits in 1972. Then politicians added more beneficiaries, from the disabled to immigrants, farmers, railroad workers, firefighters, ministers, federal, state, and local government employees, etc.
While politicians and voters continued to add more beneficiaries to the welfare program, the number of workers steadily declined. Today, there are barely 2-workers for each beneficiary.
As we will discuss, “Demography is destiny.”

The $96 Trillion Graveyard
“Politicians promised you benefits, but never funded them. That’s according to truthinaccounting.org, which noted that there’s $96.3 trillion owed in promised but unfunded Medicare and Social Security benefits — $55.1 trillion for Medicare and $41.2 trillion for Social Security.
While Uncle Sam has $5.9 trillion in assets, the $129 trillion owed in bills — including military and civilian retirement benefits — means the U.S. is in the hole for $123 trillion. Just the unfunded liabilities in Medicare and Social Security add up to $96 trillion.
It is a stunning amount coming due over the next 75 years. The Treasury Department sticks its proverbial head in the sand and does not even list the liabilities on the balance sheet of the federal government.” – – Adam Andrzejewski
Let that soak in for a minute.
According to the Social Security Trustees’ annual report (pdf), the Social Security program will be insolvent in 13 years by 2035. At present, the program cannot guarantee full benefits to current retirees. The Social Security Old-Age & Survivors Insurance (OASI) trust fund will deplete its reserves by 2034.
The Social Security Disability Insurance (SSDI) trust fund is better financially. However, the combined trust fund will deplete by 2035 when today’s youngest retirees turn 75 and 54-year-olds enter full retirement age.
Once the program becomes insolvent, all beneficiaries will face across-the-board benefit cuts of 20 percent.
In 2022, the Trustees estimate Social Security to run a cash-flow deficit of $112 billion, which comes to 1.3 percent of taxable payroll. Over the next decade, Social Security will run deficits of almost $2.5 trillion, equivalent to 0.8 percent of GDP or 2.1 percent of taxable payroll.
By 2040, the annual deficit will grow to 3.4 percent of taxable payroll, moving even higher to 4.3 percent by 2096.
It is an insurmountable problem.
Can It Be Fixed?
Currently, most people suggest that a few minor tweaks, such as increasing the retirement age, can solve the long-term funding problem.
They could not be more wrong.
How do we know this? Because adjustments made previously to the welfare programs still fell well short of future assumptions.
For example, in 1977, Congress passed an amendment that altered the tax formulas to raise more money, increasing withholding from 2% to 6.15%. As President Carter remarked,
“Now this legislation will guarantee that from 1980 to the year 2030, the Social Security funds will be sound.”
The financial picture declined almost immediately, and by the early 1980s, the system was again in crisis. Then, In 1983, a panel investigated the long-run solvency of Social Security, and in 1983 amendments were put into place to raise social security taxes and raise the full retirement age.
Once again, these fixes failed to fix the long-term funding problem of the welfare program for the simple reason that increasing taxes and a declining number of individuals won’t cover the growing number of welfare recipients.
Today, the problem remains the same. Increasing taxes and extending retirement ages won’t solve the long-term insolvency of too many beneficiaries.
The only reality is that eventually, the benefits promised to the elderly will likely not get paid in full. Or, the younger generation, who vote for socialism, will be saddled with trillions in extra taxes with nothing in return.

Other Measures Just As Dismal
There are several other measures of the unfunded liability problem. However, they are just as dismal.
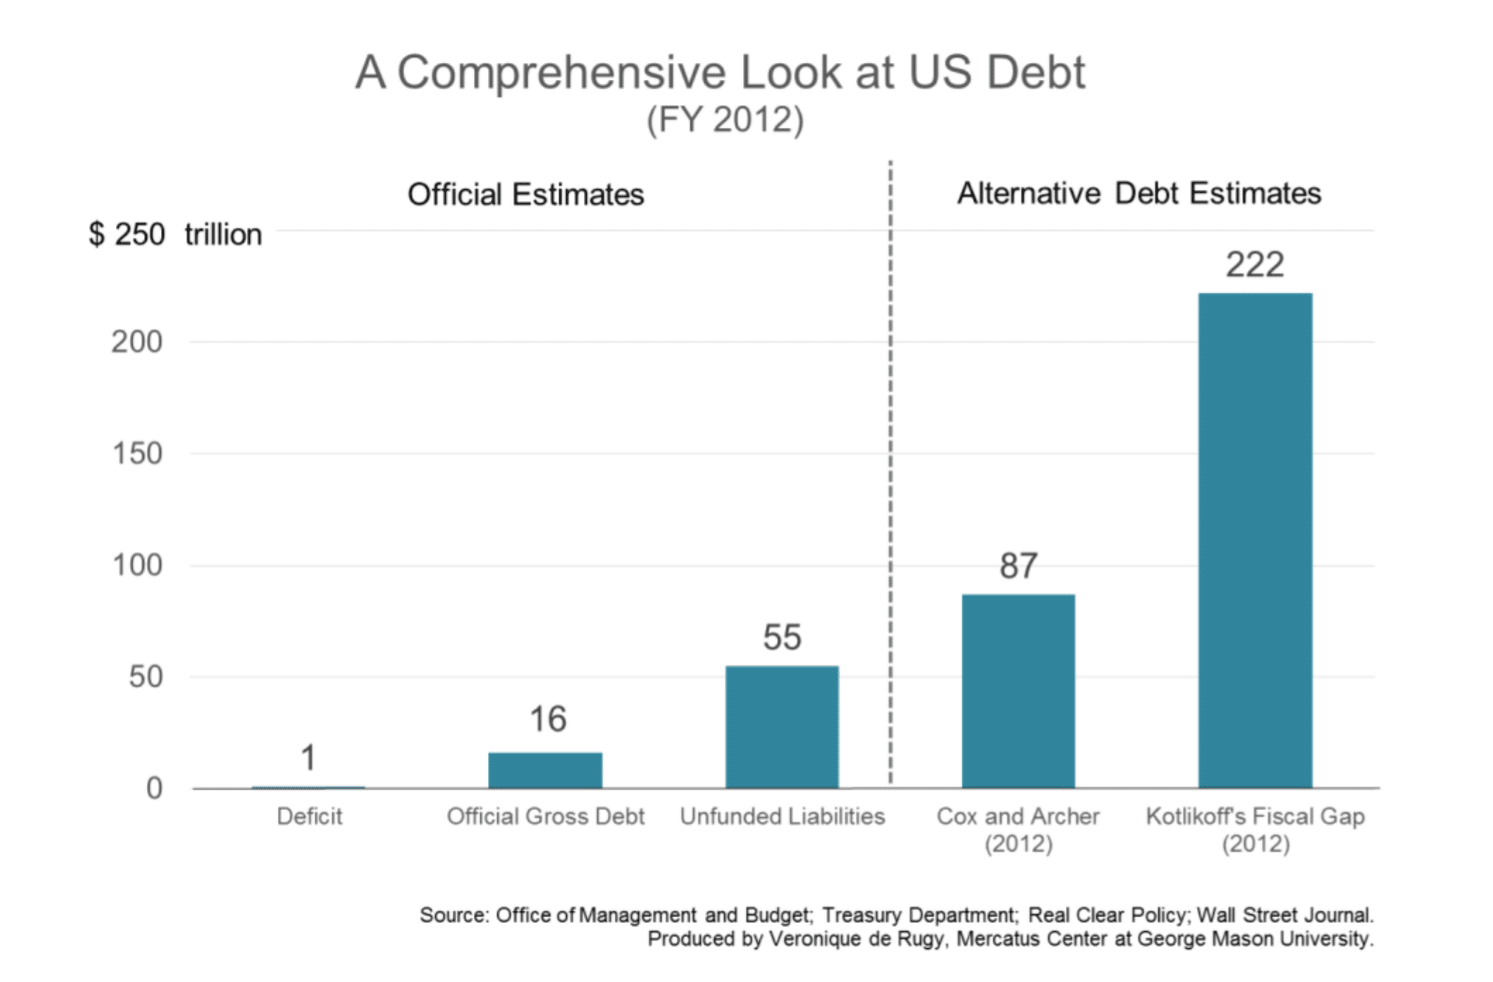
- Former chairman of the SEC, Chris Cox, and former chairman of the House Ways & Means Committee Bill Archer (2012) report roughly $87 trillion in unfunded liabilities using data from the Medicare and Social Security Trustees’ Reports. Their measures account for the unfunded liabilities—including Social Security, Medicare, and federal workers’ pensions—in addition to the official debt.
- Boston University economist Laurence Kotlikoff calculates a “fiscal gap” amount of $222 trillion using the Congressional Budget Office’s alternative long-term budget forecast. The fiscal gap measure considers the present value of all the expenditures now through the end of time (including servicing the official debt). It subtracts all the projected taxes from that amount.
- Such means the government would have to invest $87 trillion or $222 trillion right now in something that will earn a certain positive rate of return to meet its future obligations, mainly concerning entitlement programs.
- Both alternative debt figures dwarf the $16 trillion official debt figure, even when you add the $55 trillion Treasury estimate for unfunded liabilities to $71 trillion.
This money is not due in the future; it’s like a credit card bill the country owes right now. If we don’t pay interest on it, the debt will continue to accumulate. Addressing our unfunded liabilities problem requires fundamental entitlement reform and reductions in federal spending.” – Veronique de Rugy, Mercatus Center
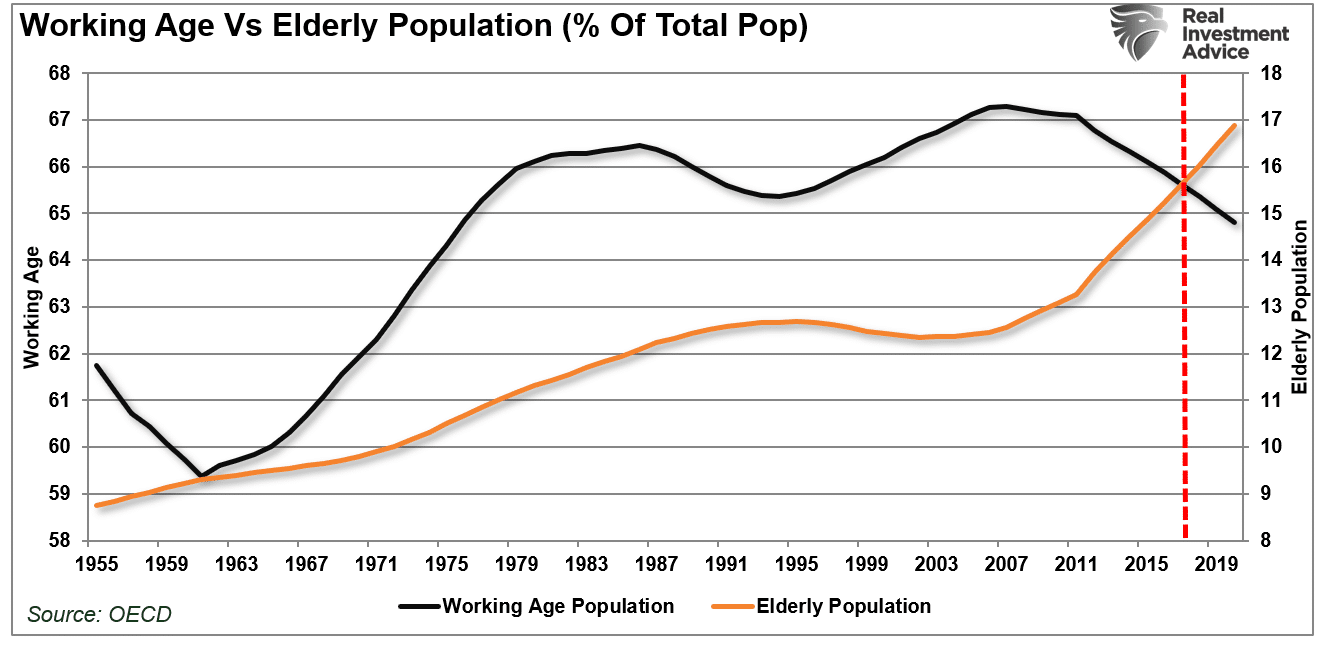
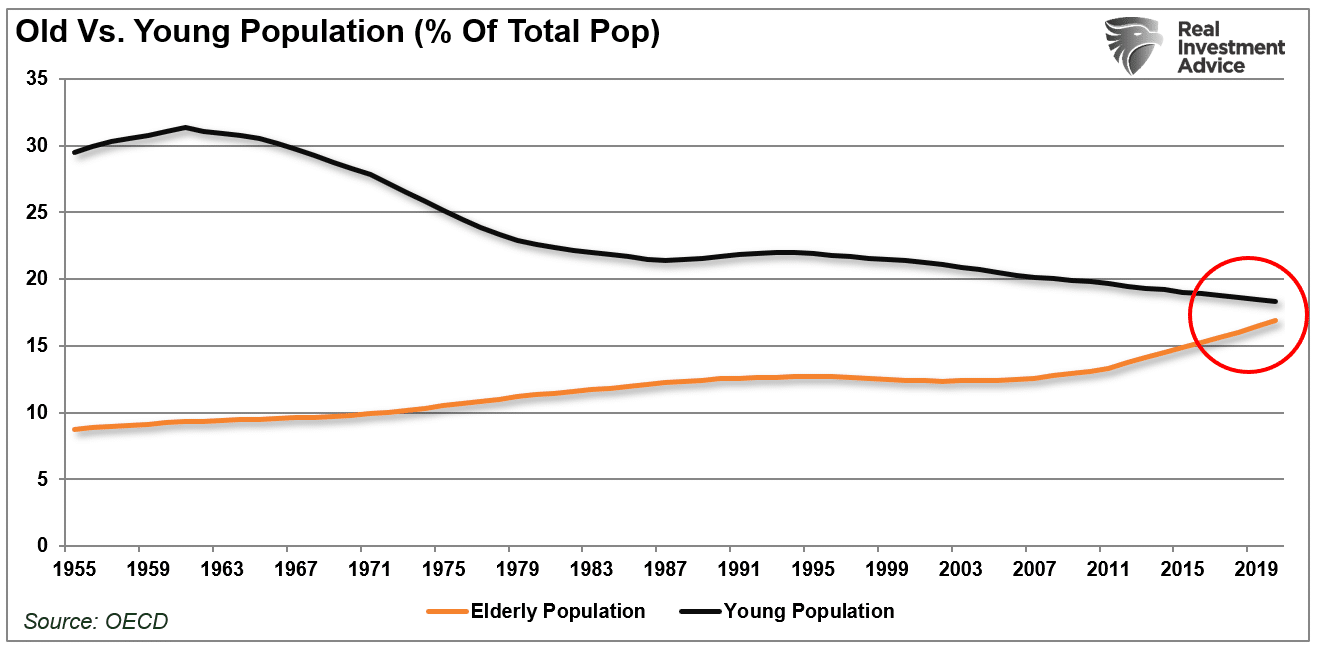
No matter how you calculate the numbers, the problem remains the same. Too many obligations and a demographic crisis. As noted by official OECD estimates, the aging of the population relative to the working-age population has already crossed the “point of no return.”

Social Media And Video Games
While politicians and financial gurus suggest that future retirees won’t face a significant shortfall, the problem comes down to fertility rates. So to solve the demographic “timebomb,” either you have to decrease the number of people drawing on the system markedly or massively increase the number paying into it.
A recent study shows the latter is not likely.
Researchers from the Center for Sexual Health Promotion at Indiana University School of Public Health showed Americans continue to have less sex. Research found that 28% of adults reported not having intercourse over the prior year in 2018. Adolescents were also increasingly abstinent, with 89% reporting not having sex over the previous 12 months in 2018.
The data also permitted the researchers to estimate how often the average American adult aged 18-49 has sex each year. In 2009, it was about 63 times. In 2018, it was about 47 times.
Interestingly, the researchers put forth some hypotheses behind the decline in sexual activity:
- Less alcohol consumption (not spending time in bars/restaurants)
- More time on social media and playing video games
- Lower wages lead to lower rates of romantic relationships
- Non-heterosexual identities
The problem with less sex, and non-heterosexual identities, are fewer births.
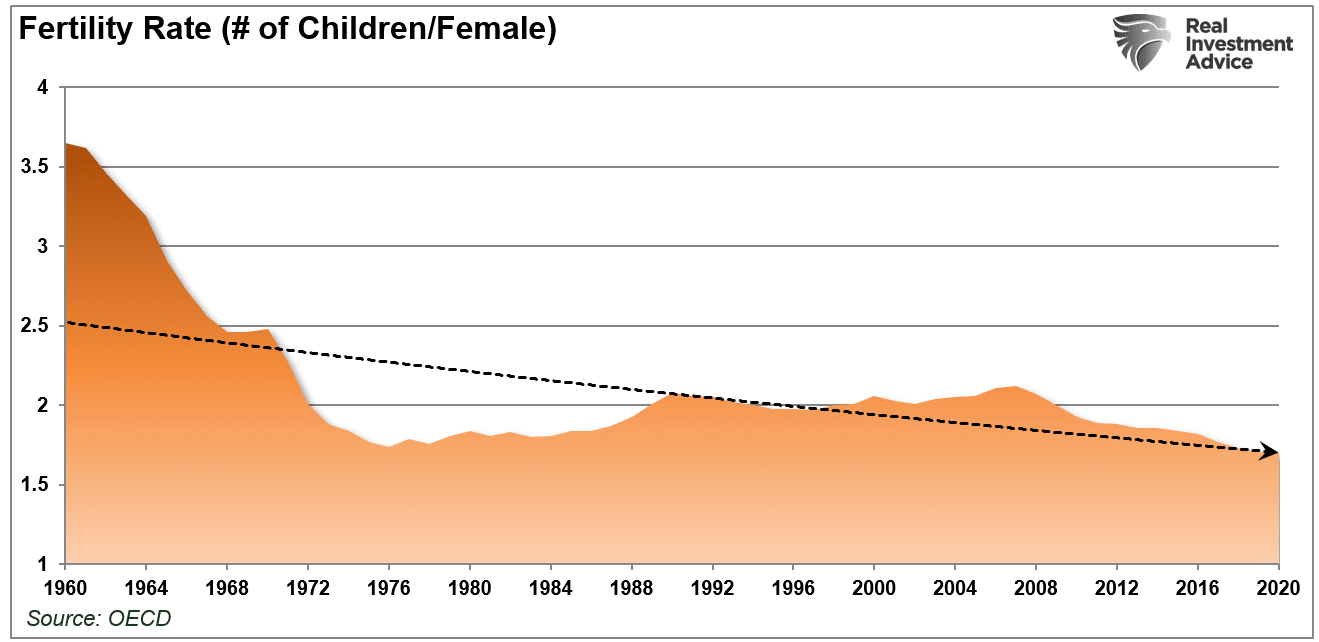
Such will exacerbate the problem of social welfare programs as the young and old populations continue to diverge.

An Insolvable Problem
As millions of baby boomers begin to retire, another problem also emerges. Demographic trends are relatively easy to forecast and predict. However, each year until 2025, we will see successive rounds of boomers reach the 62-year-old threshold.
There is a twofold problem as these successive crops of boomers heads into retirement. First, each boomer has not produced enough children to replace themselves. Such leads to a decline in the number of taxpaying workers. It takes about 25 years to grow a new taxpayer. We can estimate, with surprising accuracy, how many people born in a particular year will live to retirement. The retirees of 2070 were born in 2003, and we can see and count them today.
The second problem is the employment problem. The decline in economic prosperity discussed previously is caused by excessive debt and declining income growth due to productivity increases. Furthermore, the shift from manufacturing to a service-based society will continue to lead to reduced taxable incomes.
This employment problem is critical.
By 2025, each married couple will pay Social Security retirement benefits for one retiree and their own family’s expenses. Therefore, either taxes must rise or other government services must get cut.
Back in 1966, each employee shouldered $555 of social benefits. Today, each employee has to support more than $18,000 of benefits. The trend is unsustainable unless wages or employment increases dramatically, and based on current trends, such seems unlikely.
The entire social support framework faces an inevitable conclusion where wishful thinking will not change that outcome. The question is whether elected leaders will make needed changes now, or later when they are forced upon us.
For now, we continue to “Whistle past the $96 Trillion graveyards.”


Lance Roberts is a Chief Portfolio Strategist/Economist for RIA Advisors. He is also the host of “The Lance Roberts Podcast” and Chief Editor of the “Real Investment Advice” website and author of “Real Investment Daily” blog and “Real Investment Report“. Follow Lance on Facebook, Twitter, Linked-In and YouTube
Customer Relationship Summary (Form CRS)
Also Read


