Consumers are being squeezed by negative real wage growth and inflation at 40-year highs. As a result, consumer sentiment is declining, and personal consumption habits are changing as people struggle to help make ends meet.
With GDP running at -1.5% in the first quarter, a second consecutive quarter of negative growth will signify a recession. Personal consumption accounts for two-thirds of economic activity. As such, we must ask, will the plight of consumers drag GDP lower in the second quarter, resulting in a recession?
To help answer the critical question, let’s consider the state of the consumer and their means to consume.
Personal Consumption
Per the BEA, Personal Consumption Expenditures is “the value of the goods and services purchased by, or on the behalf of, U.S. residents.”
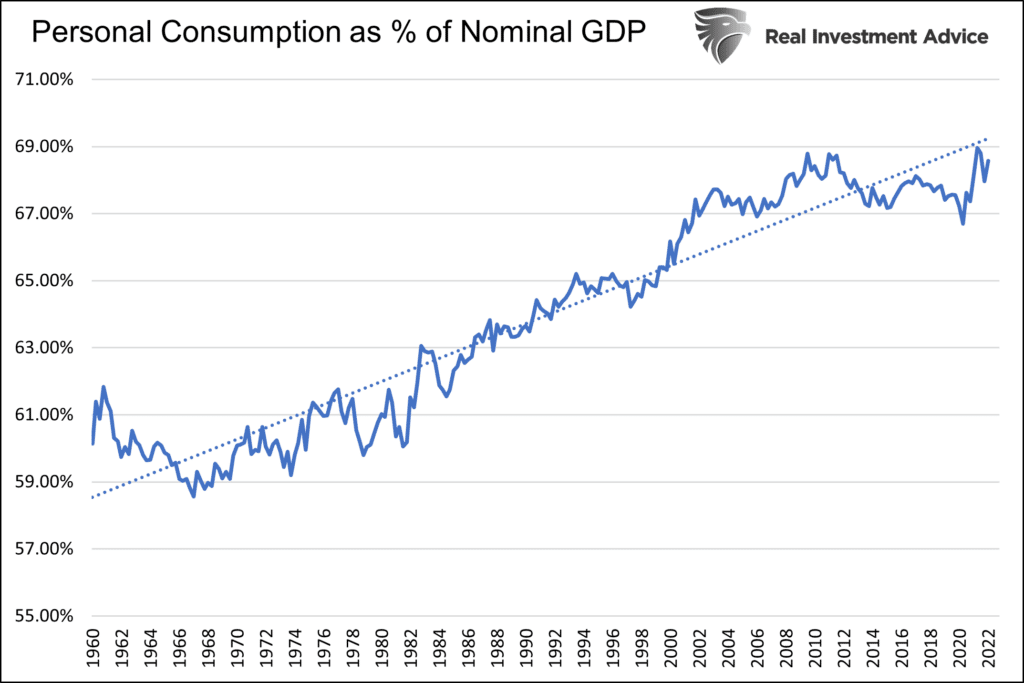
The graph below shows that over the last 60 years, PCE has slowly risen from about 60% of GDP to nearly 70%. Its contribution to GDP fluctuates very little.
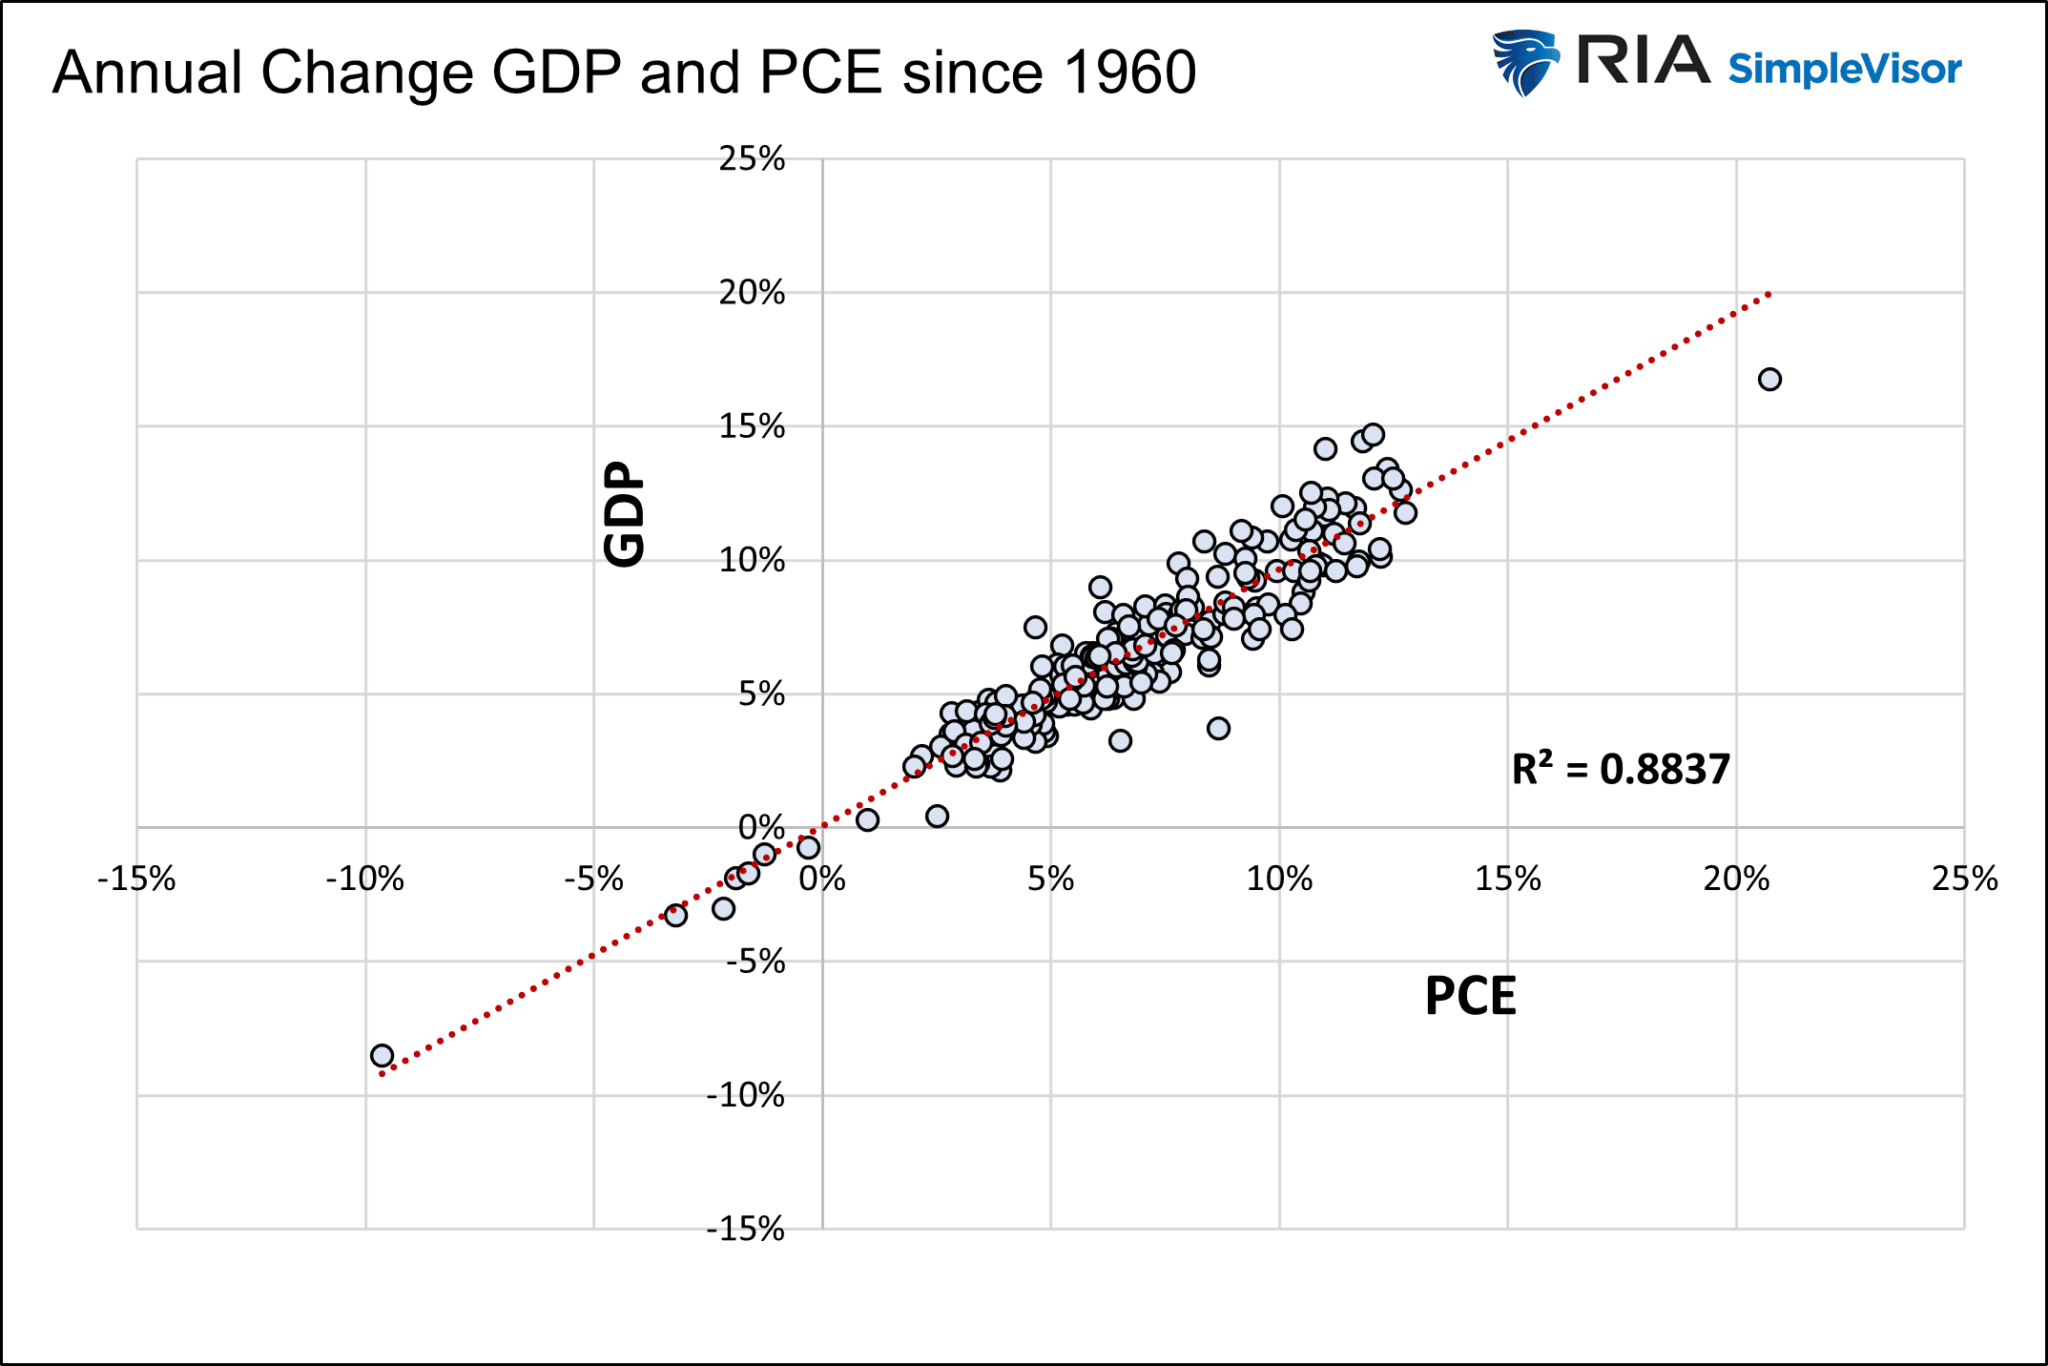
The following graph shows that annual changes in PCE and GDP are highly correlated. There has never been an instance where PCE was down for the year, and GDP rose!

Consumer Sentiment Surveys
With an appreciation for consumers’ outsized role in the economy, let’s consider their propensity to consume goods and services.
Are they confident in their financial situation and their expectations for the economy? High levels of confidence lead to high levels of consumption and vice versa.
The first graph below compares the University of Michigan Consumer Sentiment Survey and the Conference Board’s Consumer Confidence Index.
The most recent Michigan survey (orange) is well below levels from the spring of 2020, when the economy was shuttered, and unemployment rose to double digits. It is also at levels last seen around the great financial crisis. As they measure it, confidence is currently below readings from the recessions of 1991 and 2001.
The Conference Board’s Confidence Index (blue) is slipping, but it does not paint as grim a picture as the Michigan survey.
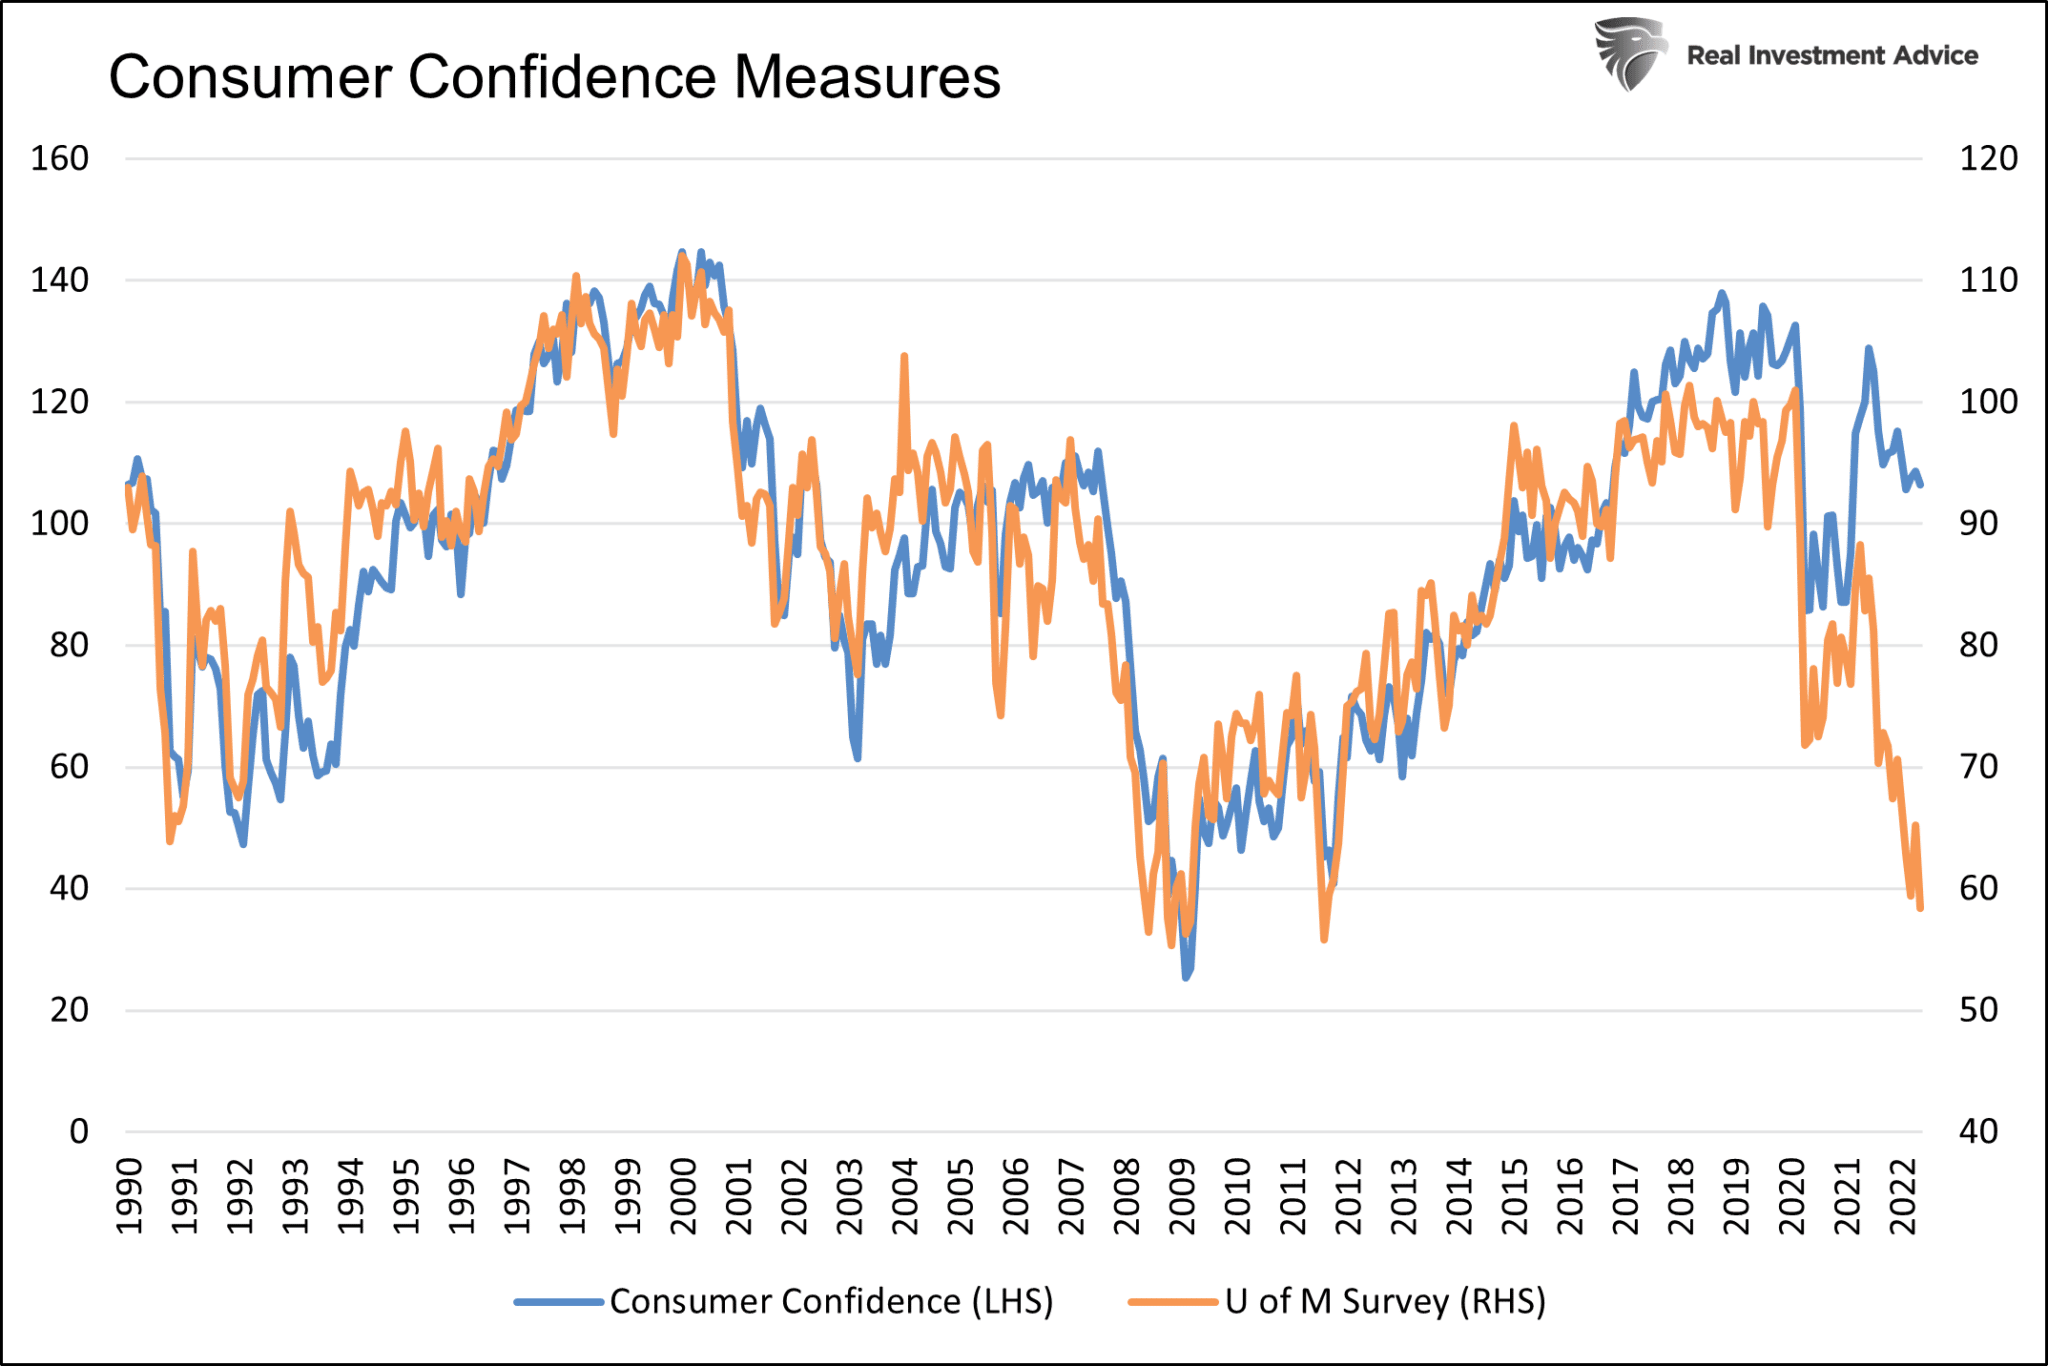

The graph above shows that the difference between the two surveys is the most extreme in at least 30 years. The circles highlight the prior three troughs and the current trough. The previous three troughs occurred right before recessions.
The surveys’ underlying data and commentary point to high inflation and rising interest rates as the primary culprit for the declining sentiment.
In its most recent report, the Conference Board notes the following: “Indeed, inflation remains top of mind for consumers.”
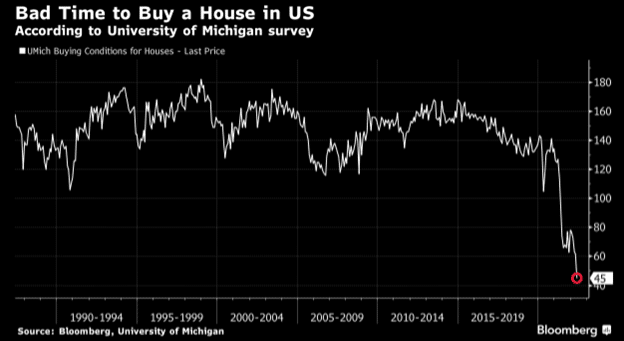
Higher interest rates and soaring house prices are crushing consumer home-buying sentiment. The graph below shows it’s currently the worst time to buy a house in the last 30+ years by a long shot.
Why does this matter?
The National Association of Home Builders (NAHB) estimates that Housing’s contribution to GDP generally averages 15-18%. Their study includes residential investment and personal consumption of housing services, including rents.
Declining Real Wages
Having established that consumer sentiment is declining, we must ask why. As we note in the prior section, inflation and higher interest rates are weighing on consumers’ purchasing power.
Inflation is not necessarily bad for consumers if their wages keep up or surpass the inflation rate. Unfortunately, that is not occurring. The graph below shows that real incomes (inflation-adjusted) have fallen for over a year. While nominal wages are increasing, its purchasing power is decreasing. As a result, many consumers can afford less today than yesterday. Consumers are essentially getting pay cuts whether they know it or not.
The two spikes in the graph result from the direct pandemic-related government payments to citizens.
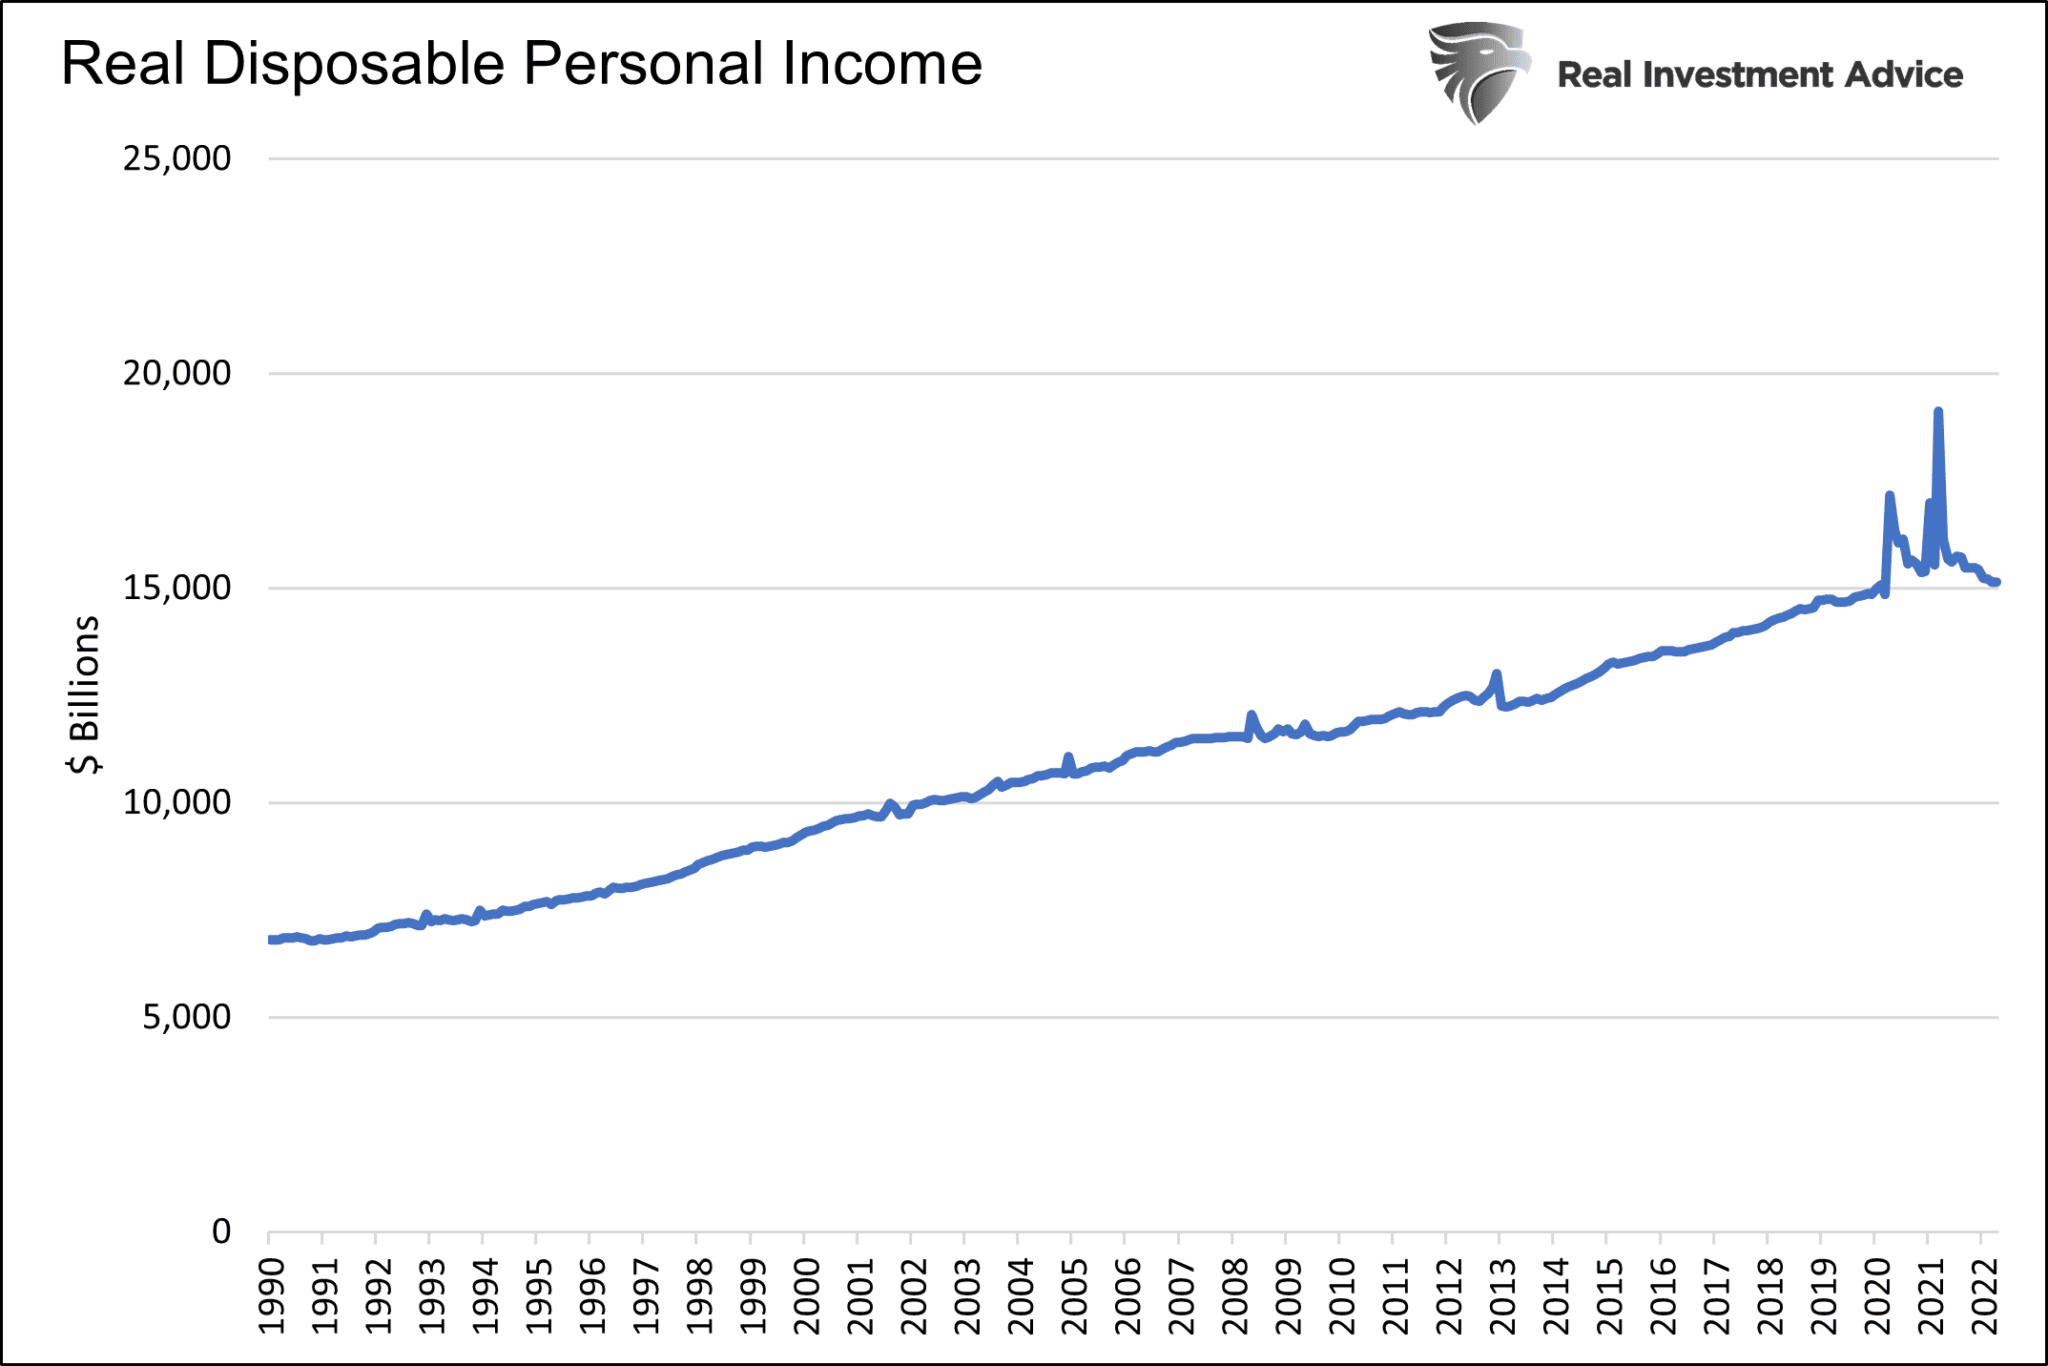
The trend in real wages does not bode well for personal consumption. With inflation remaining in the 8% range and wages growing at about 5%, many consumers are losing. The data is worse for the lower and middle classes, which spend most of their money on food, energy, and rent. The prices of which are rising faster than the inflation rate.
The table below shows the difficult choices consumers are being forced to make.


Alternative Monetary Sources for Consumption
Wages drive personal consumption, but other sources of money also contribute to spending.
Savings
When in need, people draw down on their savings to help. The graph below shows that is exactly what is occurring today. Personal savings are down to eight-year lows as consumers become increasingly reliant on additional sources of funds. Now consider the graph below is not inflation-adjusted. A dollar of savings indeed went a lot further in 2014 than today!
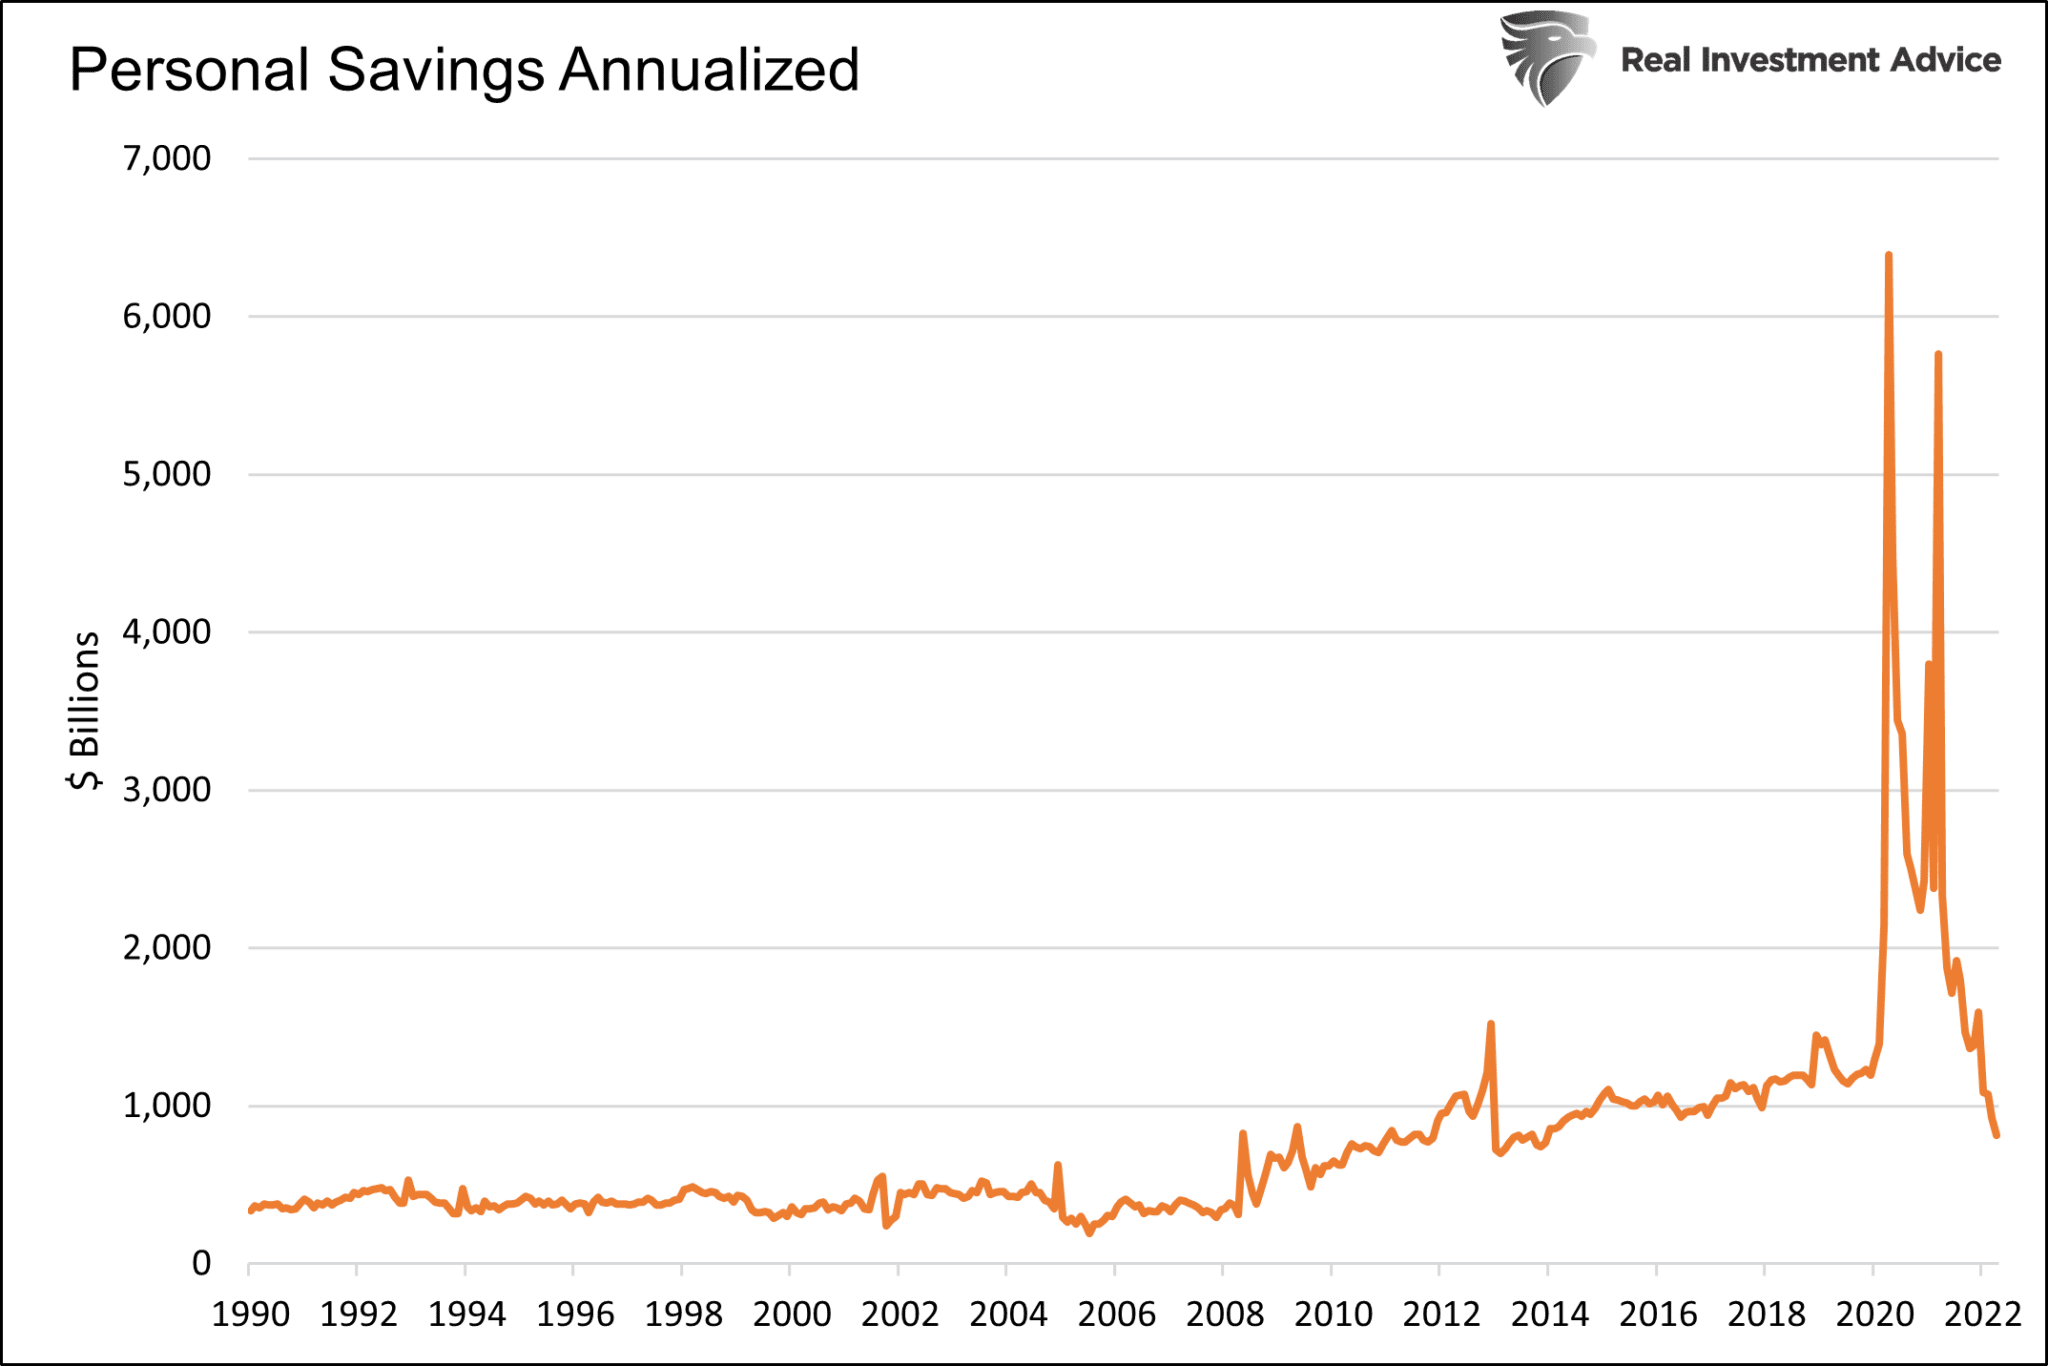
Drawing down savings has supported consumption, but many consumers are running out of savings, resulting in less future spending or more debt.
Going into Debt
Over the last thirty years, consumers have increased their use of credit cards and mortgage refinancing to consume more than they otherwise could have. These two sources of funds may be greatly limited in the future.
The graph below shows the annual change in consumer credit card debt is at a 20-year high. Consumers can continue to borrow, but higher credit card interest rates and larger debt balances will limit future usage.

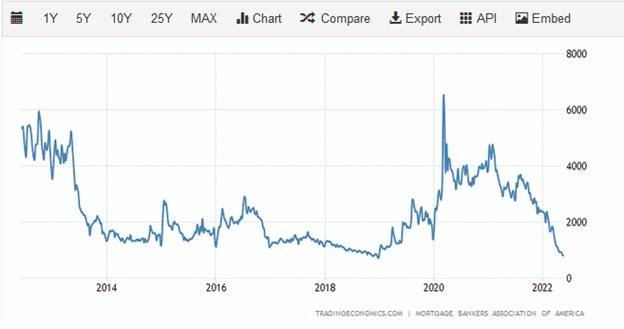
The following graph shows that the MBA Refinance Index is at its lowest level in over ten years. This is not surprising, given that mortgage rates are around 5.50%. Unless mortgage rates come down appreciably, we should not expect mortgage cash-out refinancing to be a significant source of funds for consumers.
Help from Uncle Sam
The graph below charts government transfer payments. Transfer payments are direct payments from the government to citizens. The two pandemic-related direct checks to citizens in 2020 and 2021 stand out like a sore thumb.

If the consumer struggles continue, can the government support them? The answer is unlikely.
For starters, the political climate in Washington makes fiscal stimulus unlikely. While the Democrats control the House and Senate, their slim one-vote majority in the Senate has already been problematic for stimulus bills. Given the upcoming mid-term elections it becomes more unlikely as we march toward November.
It appears the Republicans may take the House and possibly the Senate in November. Barring a much larger economic crunch, such a split between the President and Congress will further hamper the odds of substantial fiscal stimulus in 2023.

Summary
- Falling consumer sentiment.
- Crushing inflation.
- Declining real wages.
- Savings are being drawn down rapidly.
- Credit card usage is soaring.
- Mortgage cash-out refinancing is not economical.
- Fiscal stimulus is unlikely.
Excepting a sharp decline in inflation or a gap higher in wages, it appears the consumer is in a bind. 70% of the economy is tied to the fate of the consumer. Such does not mean a recession is probable, but given the consumer’s predicament, we must assume it’s a distinct possibility.


Michael Lebowitz, CFA is an Investment Analyst and Portfolio Manager for RIA Advisors. specializing in macroeconomic research, valuations, asset allocation, and risk management. RIA Contributing Editor and Research Director. CFA is an Investment Analyst and Portfolio Manager; Co-founder of 720 Global Research.
Follow Michael on Twitter or go to 720global.com for more research and analysis.
Customer Relationship Summary (Form CRS)
Also Read