


The Magnificent Seven (Apple, Amazon, Google, NVIDIA, Meta, Tesla, and Microsoft) have been on a tear this year. At the same time, market breadth was horrendous as most other stocks were not following their lead. For example, the market-weighted S&P 500 is up more than 10% versus the equal-weighed S&P 500. Recently, the market’s breadth has been improving. The non-mega-cap stock factors like value, high dividend, small cap, mid-cap, and others are starting to catch up to the Magnificent Seven stocks.
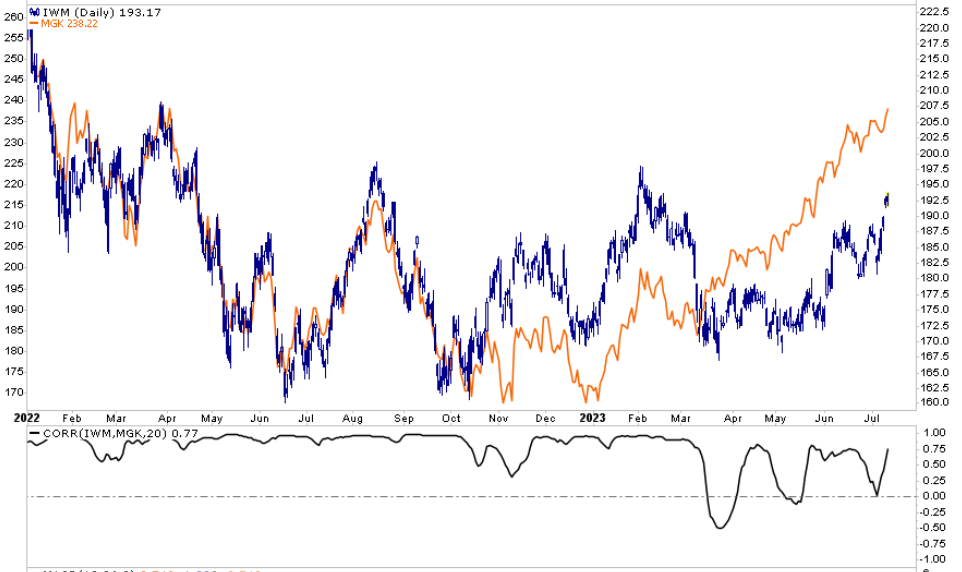
The graph below compares the small cap ETF (IWM) to the mega cap ETF (MGK) and their near-perfect correlation throughout 2022. In 2023, the robust correlation faded as performance differed markedly. For instance, small cap stocks were flat from May to June, while mega cap stocks rose sharply. Since, small cap stocks have been doing better but are about 5% below their late January 2023 peak, while mega cap stocks are 15% higher. Small cap stocks are still in their trading range of the last year. Mega cap stocks and the S&P 500 have clearly broken their ranges. If the stock markets keep rising, it will most likely occur with better breadth. The beneficiaries may likely be the first half laggards. A break above January highs would signal that small cap stocks are on a similar path as mega cap stocks.
Disclaimer: We recently added IWM to our portfolios and may likely add to the position in the near future.
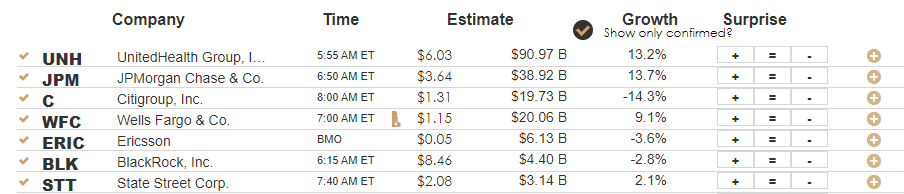
What To Watch Today
Earnings
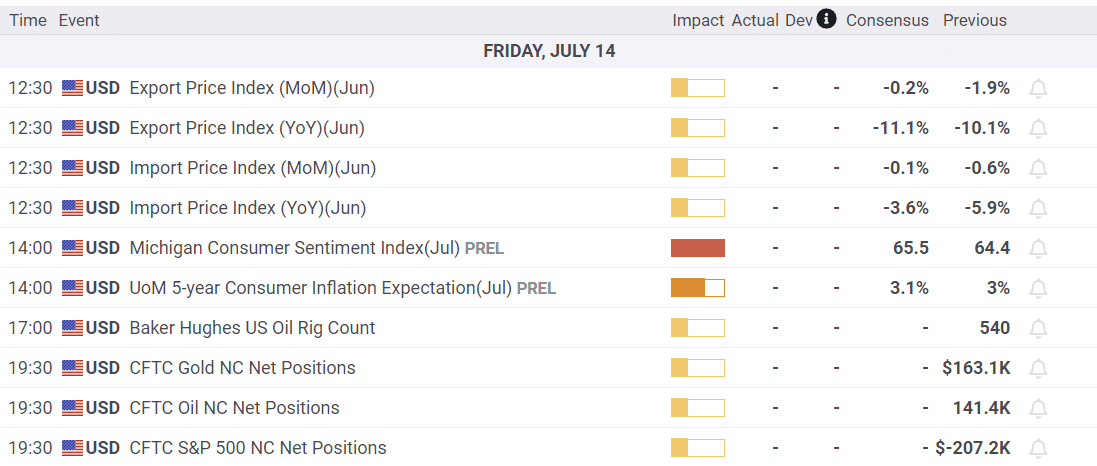
Economy
Market Trading Update
This morning is the official start to the Q2 earnings season, with companies set to beat substantially lowered guidance from last year.
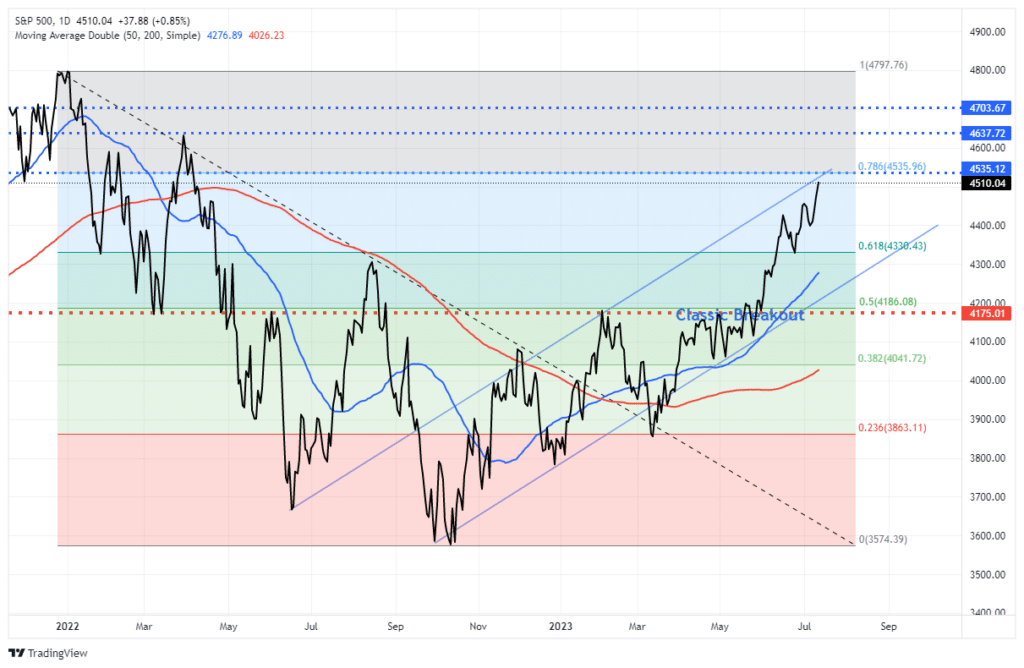
This morning we will start with some of the major money center banks. We will be looking for increased loan loss reverses and other signs of potential economic stress showing up in the earnings report. With both the CPI and PPI reports showing continued signs of disinflation, the market is now pricing in a “one and done” scenario for Fed rate hikes at this month’s FOMC meeting. With the market breakout from the recent consolidation and the triggering of a “buy signal,” the market continues to move higher. We have added exposure to portfolios but are still seeking corrective action to get portfolios to full target weights. With markets like this, patience is very difficult. However, we suspect we will be better off in the future by playing the waiting game for now.
Technically, the market is now approaching its 78.6% retracement level and the top of the bullish trend channel from the October lows. A break above that last Fibonocci level will signal that the market will complete its retracement to all-time highs completing the correction process that began last January. The deviations from long-term means are rather extreme, so, as noted, a pullback to reset the rally should be expected and used as an opportunity to increase equity exposures.

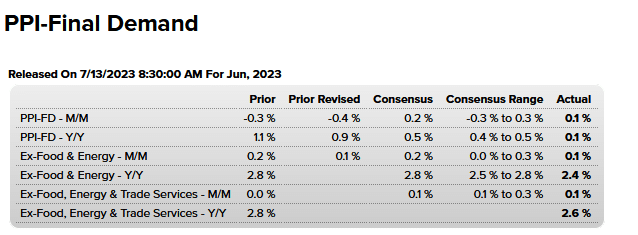
PPI
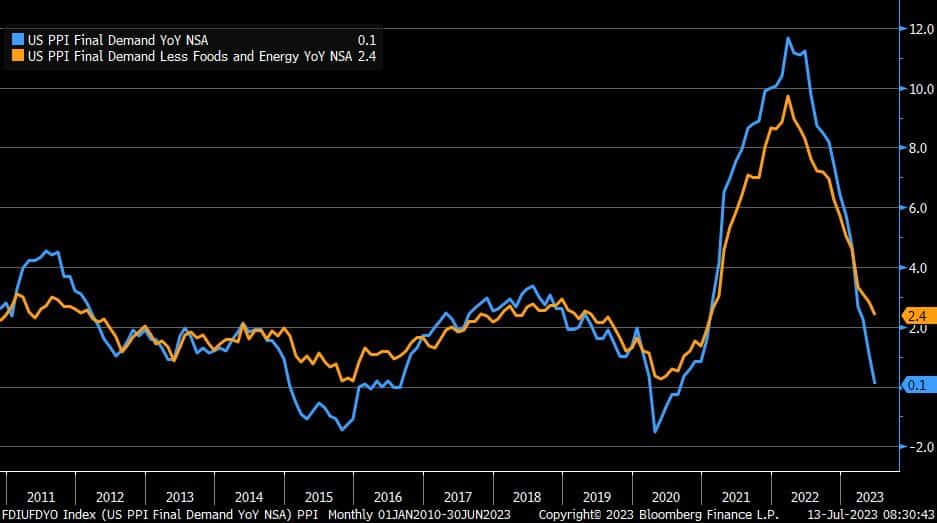
PPI, like CPI, surprised expectations to the downside. The headline and core data were all below estimates. Further, last month’s headline and core PPI figures were revised 0.1% lower. Year over year, PPI is now running at 0.1% and has declined for 12 straight months. As shown in the graph, PPI is now below the average of the ten years leading to the pandemic, while the core PPI is still about half a percent higher.
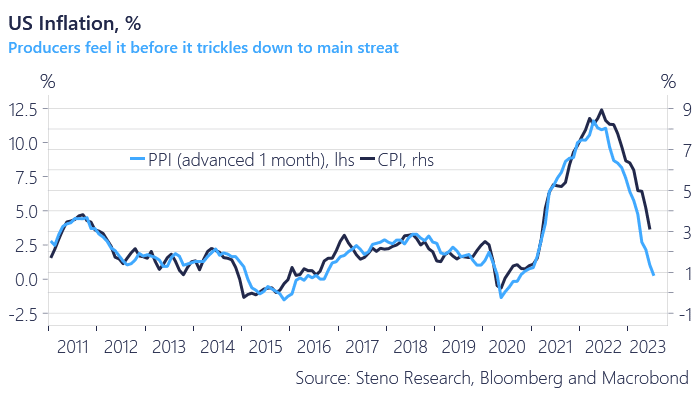
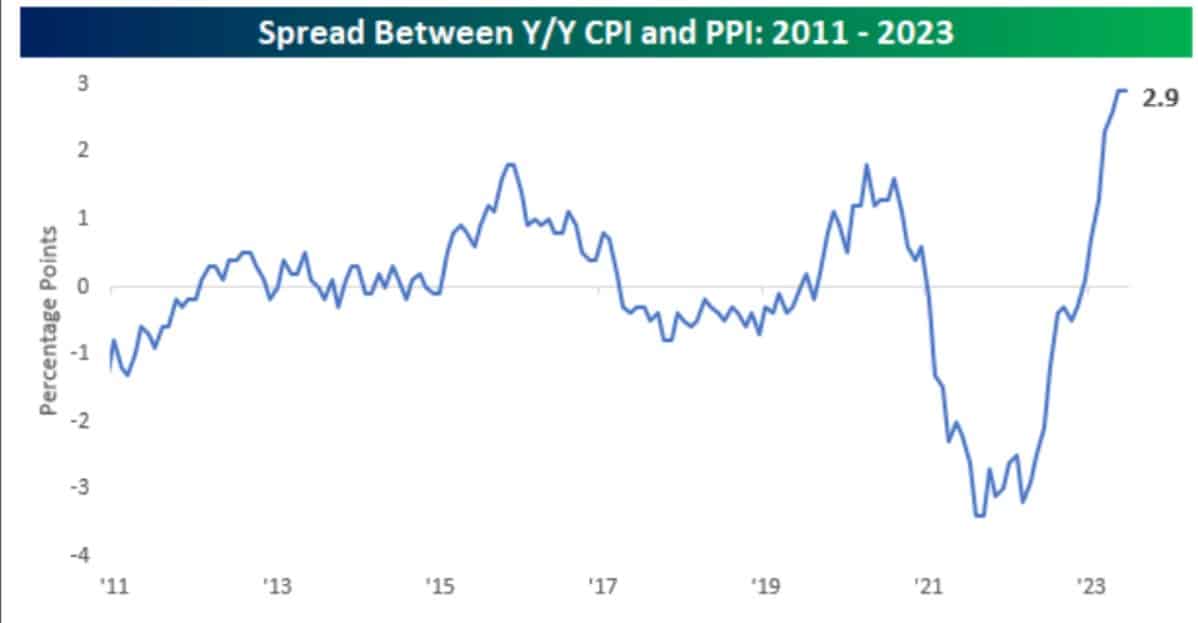
It’s worth noting that PPI tends to lead CPI by a month or two. The second graph below shows the strong correlation between CPI and PPI, courtesy of Steno Research. Assuming the relationship holds up, CPI could reach the Fed’s 2% target within a few months. The current difference between CPI and PPI, at 2.9%, is the highest spread since at least 2011, as shown in the last graph. The wider-than-normal spread helps corporate profit margin generally as their input costs are rising less than the prices they charge customers. However, the spread is unlikely to continue, likely weighing on pressure margins in the third and fourth quarters.
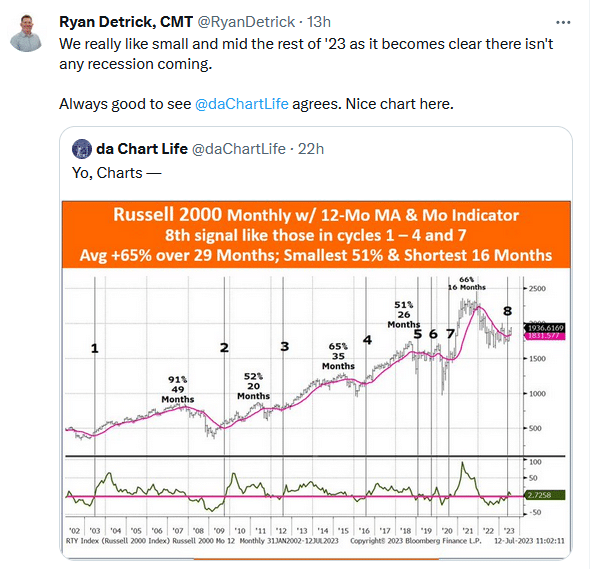
Small Cap Stocks and Market Mentality
The tweet below helps better explain why the stocks are doing well. Ryan Detrick writes, “as it becomes clear there isn’t any recession coming.”
Ryan and most investors are betting against a recession. If they are correct, and a recession is not in the cards, then the graph shows that the small cap stocks may benefit nicely. We don’t necessarily agree with Ryan, nor do we see an imminent recession. But we find it hard to believe that this time is different. That much higher interest rates and inverted yield curves, which have preceded every recession, will not result in a recession this time. However, and this is important, market sentiment, not our economic forecast, drives markets. As long as the markets believe a recession is not likely, stocks will probably go higher. Sentiment can change quickly, as can the economy, but for now, Ryan and many others see smooth sailing ahead.
Tweet of the Day
Please subscribe to the daily commentary to receive these updates every morning before the opening bell.
If you found this blog useful, please send it to someone else, share it on social media, or contact us to set up a meeting.
Also Read


