


There is currently much hope for another fiscal stimulus package to be delivered to the economy from Congress. While President Trump recently doused hopes of a quick passage, there a demand for more stimulus by both parties. While most hope more stimulus will cure the economy’s ills, it will likely disappoint due to the “2nd derivative effect.”
Let me explain.
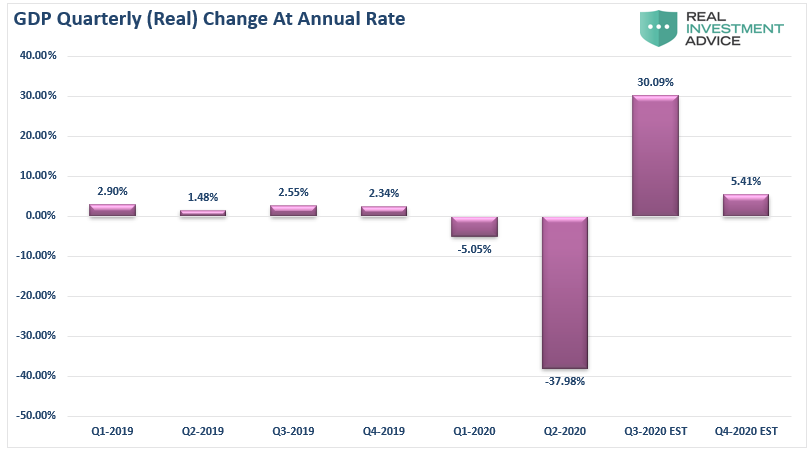
In March, as the economy shut down due to the pandemic, the Federal Reserve leaped into action to flood the system with liquidity. At the same time, Congress passed a massive fiscal stimulus bill that expanded Unemployment Benefits and sent checks directly to households. As shown in the chart below of the upcoming expected GDP report, it worked. (We estimated GDP to increase by 30% from the previous quarter.)
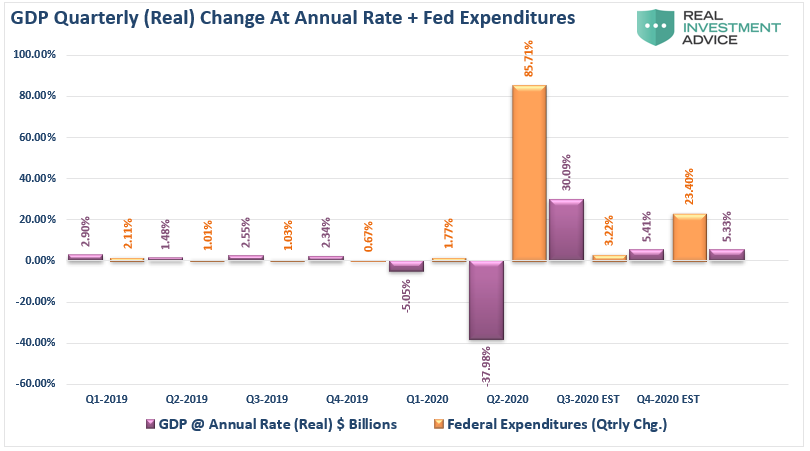
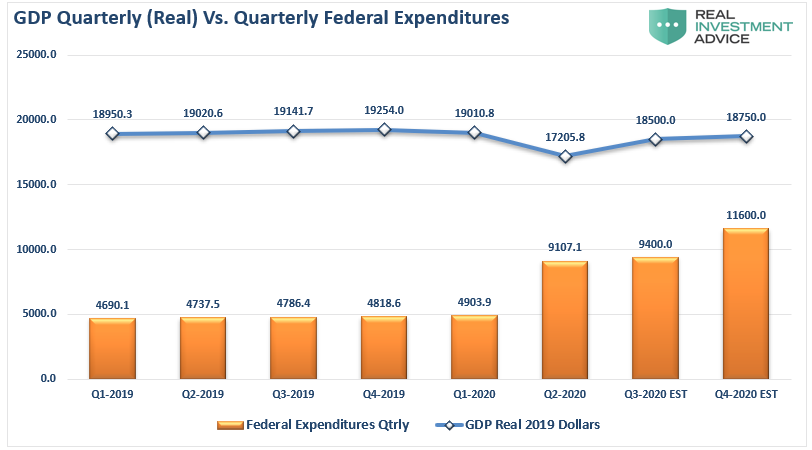
That expected 30% surge in the third quarter, and surging stock market to boot, directly responded to both the fiscal and monetary stimulus supplied. The chart below adds the percentage change in Federal expenditures to the chart for comparison.
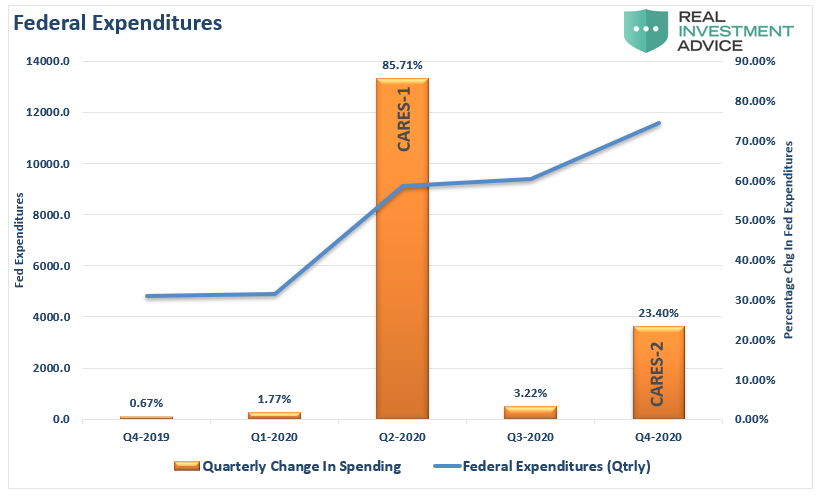
The spike in Q2 in Federal Expenditure was from the initial CARES Act. In Q1-2020, the Government spent $4.9 Trillion in total, which was up $85.3 Billion from Q4-2019. In Q2-2020, it increased sharply, including the passage of the CARES Act. Spending for Q2 jumped to $9.1 Trillion, which as a $4.2 Trillion increase over Q1-2020.
Those are the facts as published by the Federal Reserve. From this point forward, we have to start making some estimates and assumptions.

Assuming CARES-2
During Q3-2020, not much happened as the Government was fighting over the next round of stimulus. As such, spending fell back to a more normal level of increase. However, if we assume that a second CARES Act is passed some time in Q4, and we apply a price tag of $2 Trillion to the package, it would represent a roughly 25% increase in Government spending over Q3-2020.
Such is the “second derivative” effect we mentioned previously.
“In calculus, the second derivative, or the second-order derivative, of a function f is the derivative of the derivative of f.” – Wikipedia
In English, the “second derivative” measures how the rate of change of a quantity is itself changing.
I know, still confusing.
Let’s run an example:
As Government spending grows sequentially larger, each additional round of spending will have less and less impact on the total. Going back to 2016, not including the CARES Act, the Government increased spending by roughly $50 billion each quarter on average. If we run a hypothetical model of Government expenditures at $50 billion per quarter, you can see the issue of the “second derivative.”
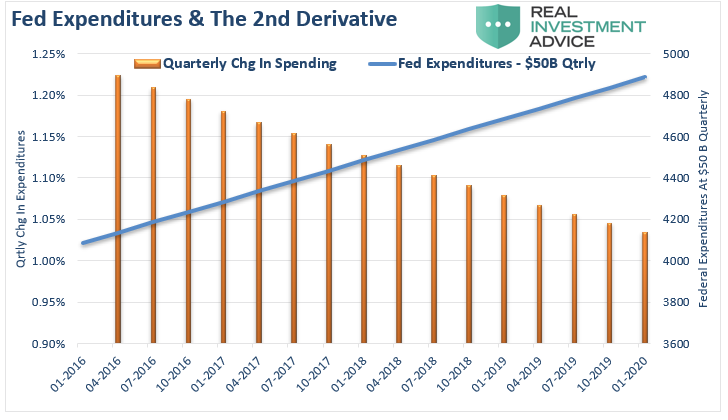
In this case, even though Federal expenditures are increasing at $50 Billion per quarter, the rate of change declines as the total spending increase.
More Leads To Less
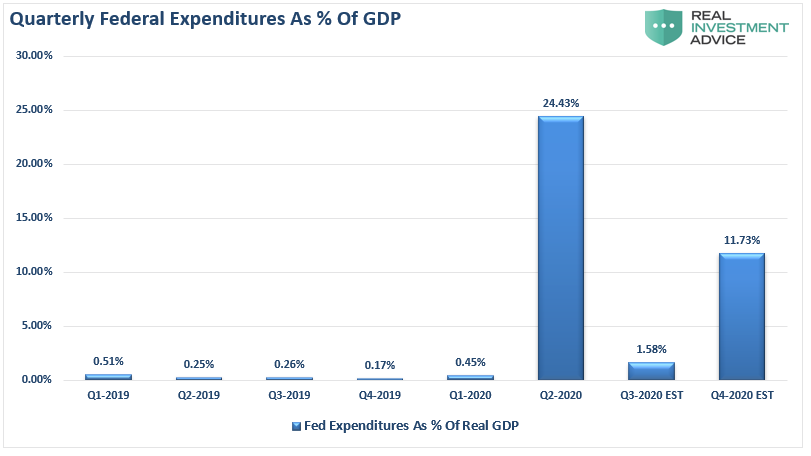
The next chart shows how the “second derivative” is already undermining both fiscal and monetary stimulus. Using actual data going back to the Q1-2019, Federal Expenditures remained relatively stable through Q1-2020, along with real economic growth. However, in Q2-2020, with our estimates for Q3 and Q4, Federal Expenditures will almost double. However, the economy will not return to positive growth.
The chart below shows the inherent problem. While the additional fiscal stimulus may help stave off a more in-depth economic contraction, its impact becomes less over time.
However, this is ultimately the problem with all debt-supported fiscal and monetary programs.

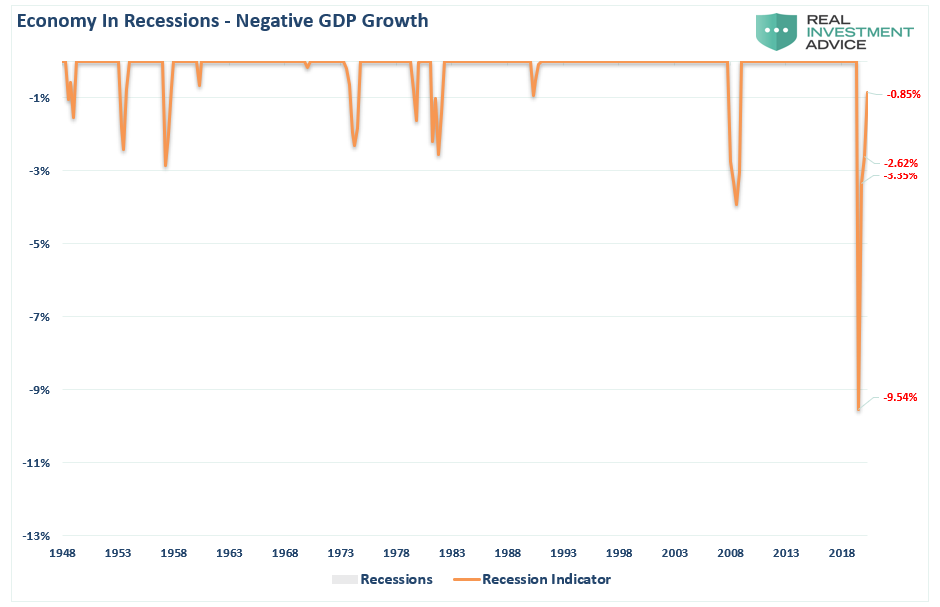
Still In A Recession
As I stated above, even assuming a $2 Trillion fiscal relief package by the end of October, which I suspect may not come, the relative impact on GDP growth will fall short of expectations.
Take a look at the next chart. These are our current estimates for GDP growth over the next 3-quarters. These estimates dovetail reasonably nicely with mainstream consensus.
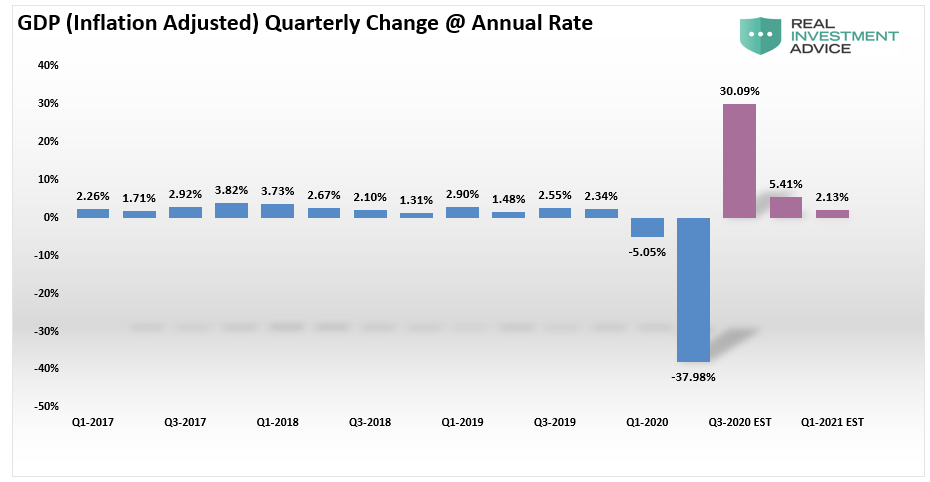
At first glance, it appears that after one negative quarter of GDP, the economy is well back on track to normalcy. However, such an assumption would be incorrect. Given that we measure economic growth on an annualized basis, the three-quarters of positive change following such a steep decline still leaves the economy in a recession.
Yes, add a couple of more quarters of economic growth, and you will eventually be back into positive territory. However, therein lies an even bigger problem.
Dollars Of Growth Deteriorate
As noted above, it requires increasing levels of debt to generate lower rates of economic growth. The chart below shows the previous and estimated CARES Acts and their impact on GDP growth.
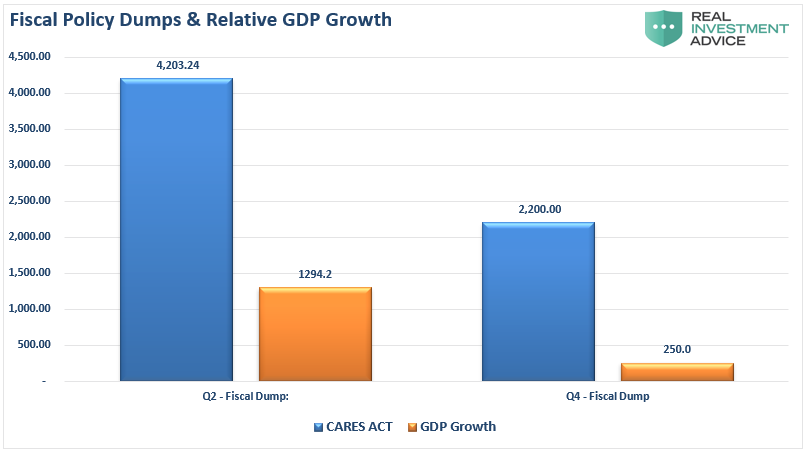
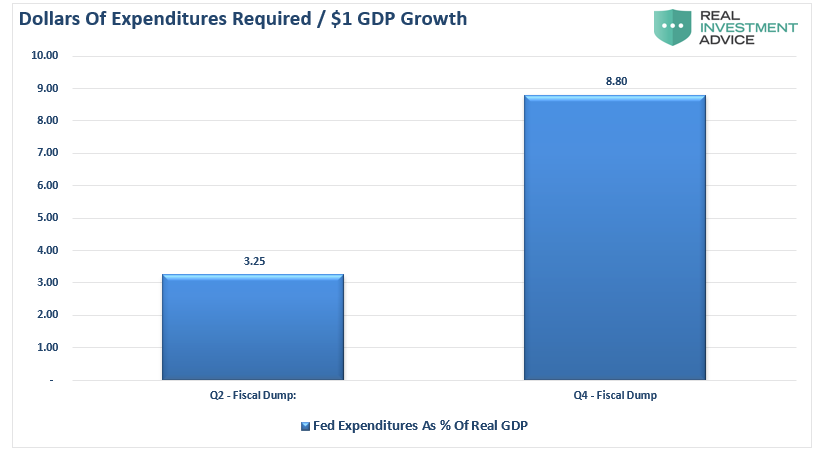
To understand this better, we can view it from the perspective of how many dollars does it require to generate $1 of economic growth. Following the economic shutdown, when economic activity went to zero, each dollar of input had a more considerable impact as the economy restarted. However, in Q4, economic activity has already recovered and begun to stabilize at a slightly lower level than seen previously.
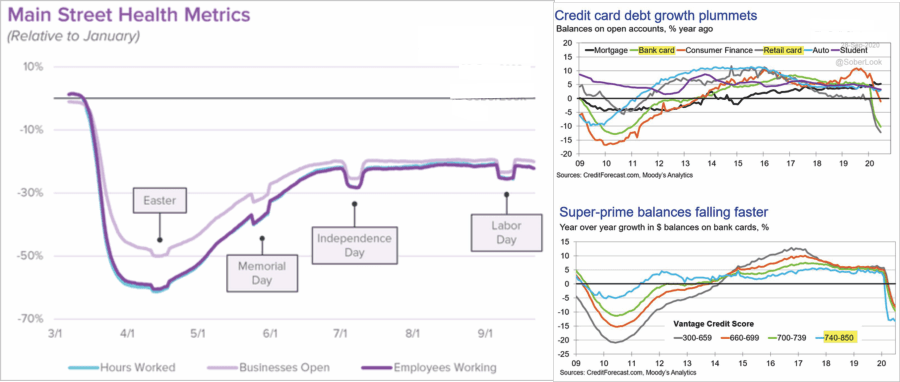
High-frequency data like credit card spending and main-street activity indicators tell us this is the case.
Given that stabilization of activity, it will require more dollars to generate economic growth in the future. As shown, it will require $8.80 of debt-supported expenditures to create $1 of economic growth.
Here is the exciting part. That is NOT a new thing. As I discussed just recently “The One-Way Trip Of American Debt:”
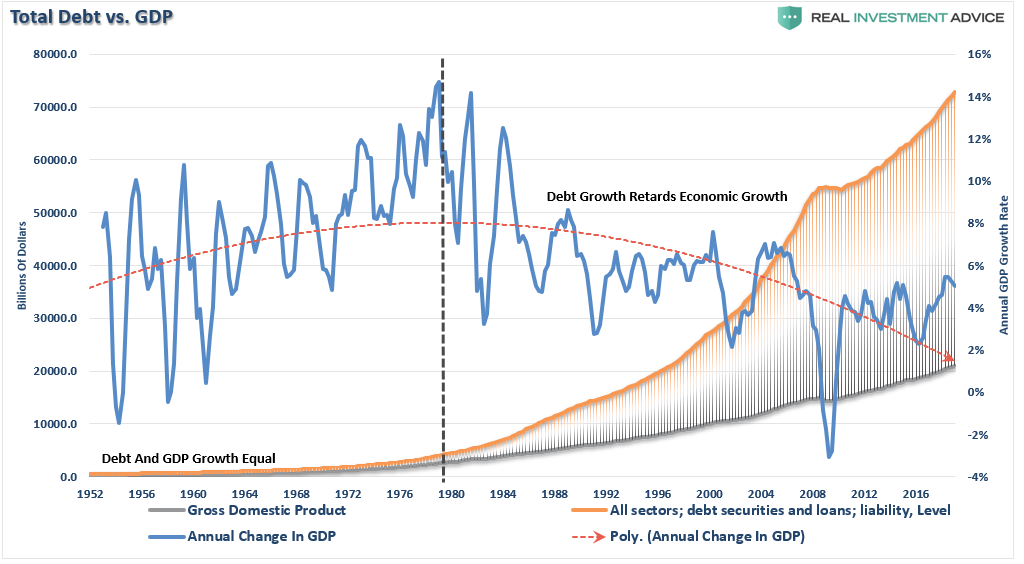
The “COVID-19″ crisis led to a debt surge to new highs. Such will result in a retardation of economic growth to 1.5% or less, as discussed recently.Simultaneously, the stock market may rise due to massive Fed liquidity, but only the 10% of the population owning 88% of the market benefits. In the future, the economic bifurcation will deepen to the point where 5% of the population owns virtually all of it.
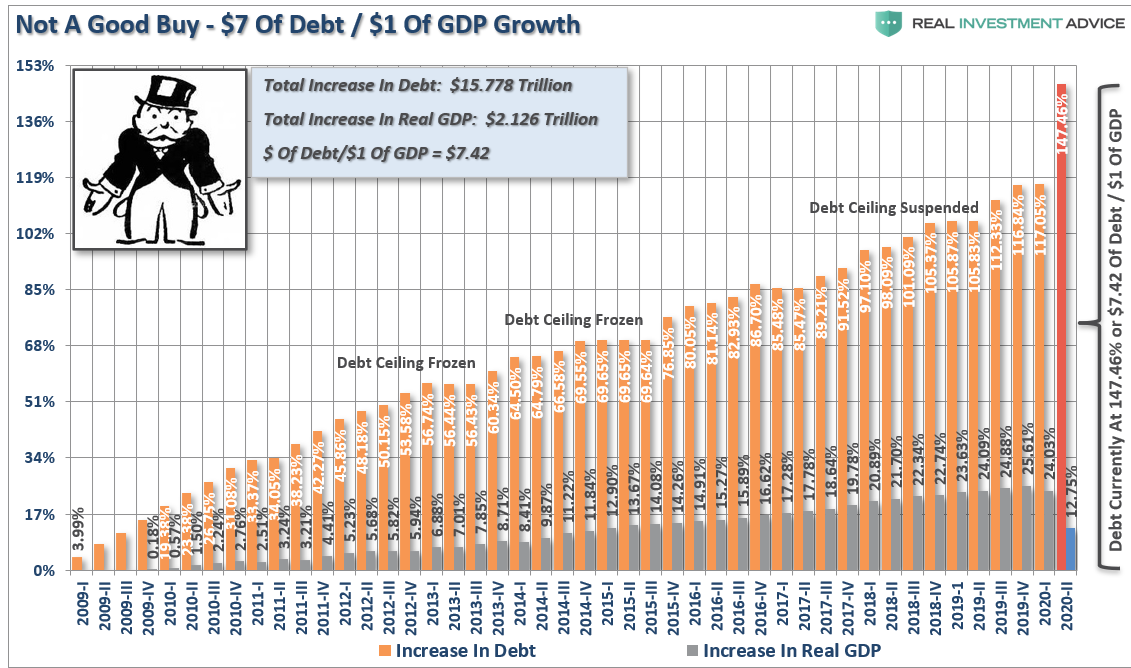
As I noted previously, it now requires $7.42 of debt to create $1 of economic growth, which will only worsen as the debt continues to expand at the expense of more robust rates of growth.

You Can’t Use Debt To Create Growth
As noted above, more debt doesn’t lead to stronger rates of economic growth or prosperity. Since 1980, the overall increase in debt has surged to levels that currently usurp the entirety of economic growth. With economic growth rates now at the lowest levels on record, the change in debt continues to divert more tax dollars away from productive investments into the service of debt and social welfare.
Another way to view the impact of debt on the economy is to look at what “debt-free” economic growth would be. In other words, without debt, there has actually been no organic economic growth.
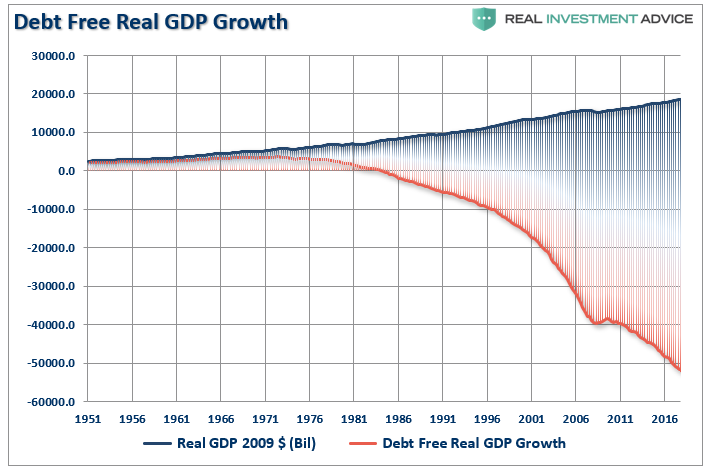
The economic deficit has never been greater. For the 30 years from 1952 to 1982, the economic surplus fostered a rising economic growth rate, which averaged roughly 8% during that period. Such is why the Federal Reserve has found itself in a “liquidity trap.”
Interest rates MUST remain low, and debt MUST grow faster than the economy, just to keep the economy from stalling out.
The deterioration of economic growth is seen more clearly in the chart below.
From 1947 to 2008, the U.S. economy had real, inflation-adjusted economic growth than had a linear growth trend of 3.2%.
However, following the 2008 recession, the growth rate dropped to the exponential growth trend of roughly 2.2%. Unfortunately, instead of reducing outstanding debt problems, the Federal Reserve provided policies that fostered even greater levels of unproductive debt and leverage.
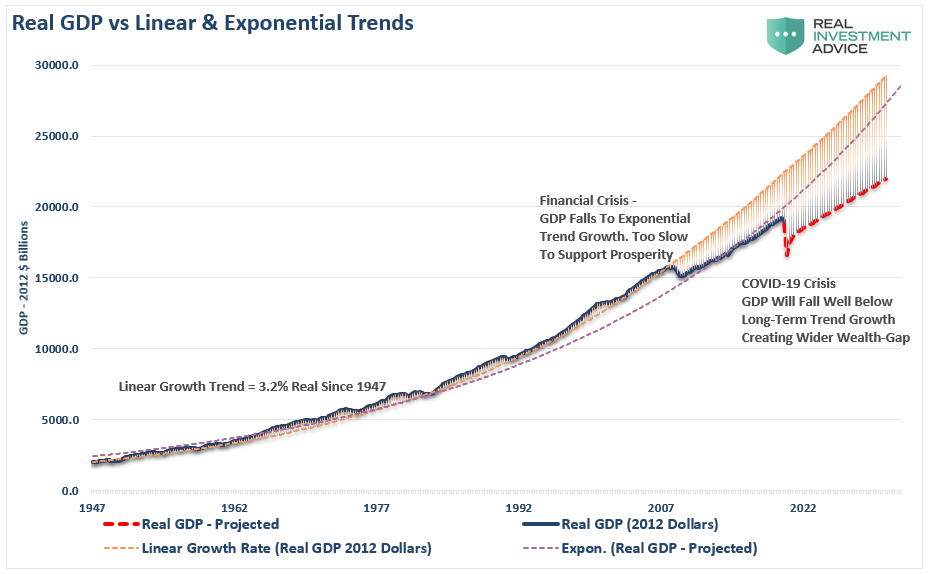
Coming out of the 2020 recession, the economic trend of growth will be somewhere between 1.5% and 1.75%. Given the amount of debt added to the overall system, the ongoing debt service will continue to retard economic growth.
A Permanent Loss
As noted by Zerohedge, the permanent loss in output in the U.S. was shown by BofA previously. The bank laid out the pre-COVID trend growth and compared it to is base case recovery.
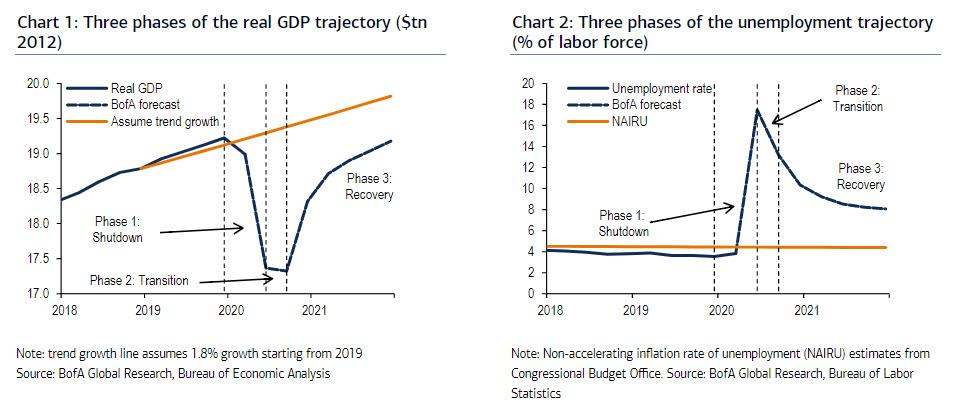
Such aligns closely with our analysis shown above. Given the permanent loss in output and rising unproductive debt levels, the recovery will be slower and more protracted than those hoping for a “V-shaped” recovery. The “Nike Swoosh,” while more realistic, might be overly optimistic as well.
However, this is the most critical point.
The U.S. economy will never return to either its long-term linear or exponential growth trends.
Read that again.

Spit-Balled Solutions
If you read between the lines, policymakers are “spit-balling” solutions and making potentially erroneous monetary policy decisions on unreliable data. However, given Central Banks’ only policy tool is more liquidity, it is a “shoot first, ask questions later” response.
The problem is those policy measures continue to erode economic prosperity. Such is evident when the CBO’s own long-term economic growth potential projections fall below 2%.
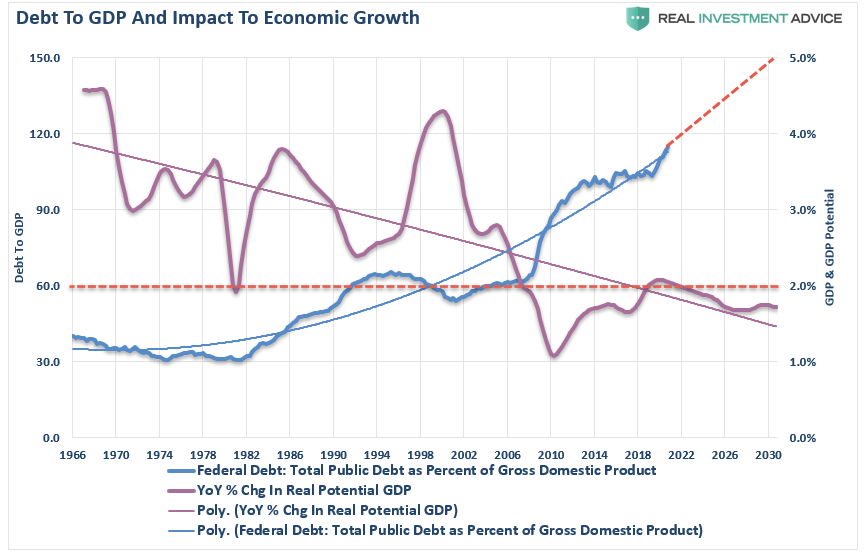
Due to the debt, demographics, and monetary and fiscal policy failures, the long-term economic growth rate will run well below long-term trends. Such will ensure the widening of the wealth gap, increases in welfare dependency, and capitalism giving way to socialism.
“So for the Federal Reserve to intervene and support those asset prices, is creating a little bit of moral hazard in a sense you’re encouraging people to take on more debt.” – Bill Dudley
What policymakers haven’t come to grip with is the “second derivative” effects of more debt.
At some point, you have to realize that you can’t get out of a “debt hole” by piling on more debt.
Eventually, you have to stop digging.


Lance Roberts is a Chief Portfolio Strategist/Economist for RIA Advisors. He is also the host of “The Lance Roberts Podcast” and Chief Editor of the “Real Investment Advice” website and author of “Real Investment Daily” blog and “Real Investment Report“. Follow Lance on Facebook, Twitter, Linked-In and YouTube
Customer Relationship Summary (Form CRS)
Also Read


