
“It’s a ‘New Bull Market’!” Over the past few days, the call of a new bull market has plastered headlines and media commentary. To wit:
“The S&P 500 rallied Thursday to end the day in a bull market, marking a 20% surge since its most recent low, reached on October 12, 2022. That brings to end the bear market that began in January 2022.” – We’re In A New Bull Market, CNN
Or this:
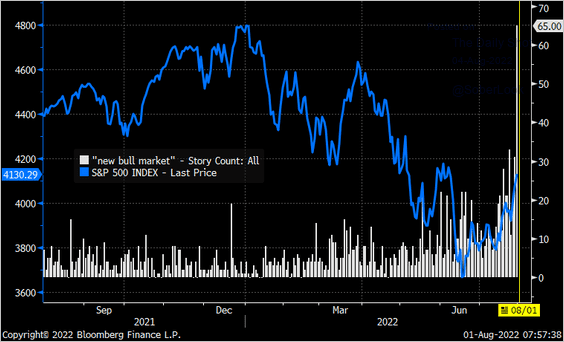
“Despite the Fed hiking rates, shrinking their balance sheet, and inflation at 9%, much of the financial media and market gurus have determined that the bear market is over and a new bull market has started. As shown, as the market surged, so did the number of articles discussing a new bull market.”
Here is the issue.
That second quote was from our weekly newsletter on August 6th, 2022.
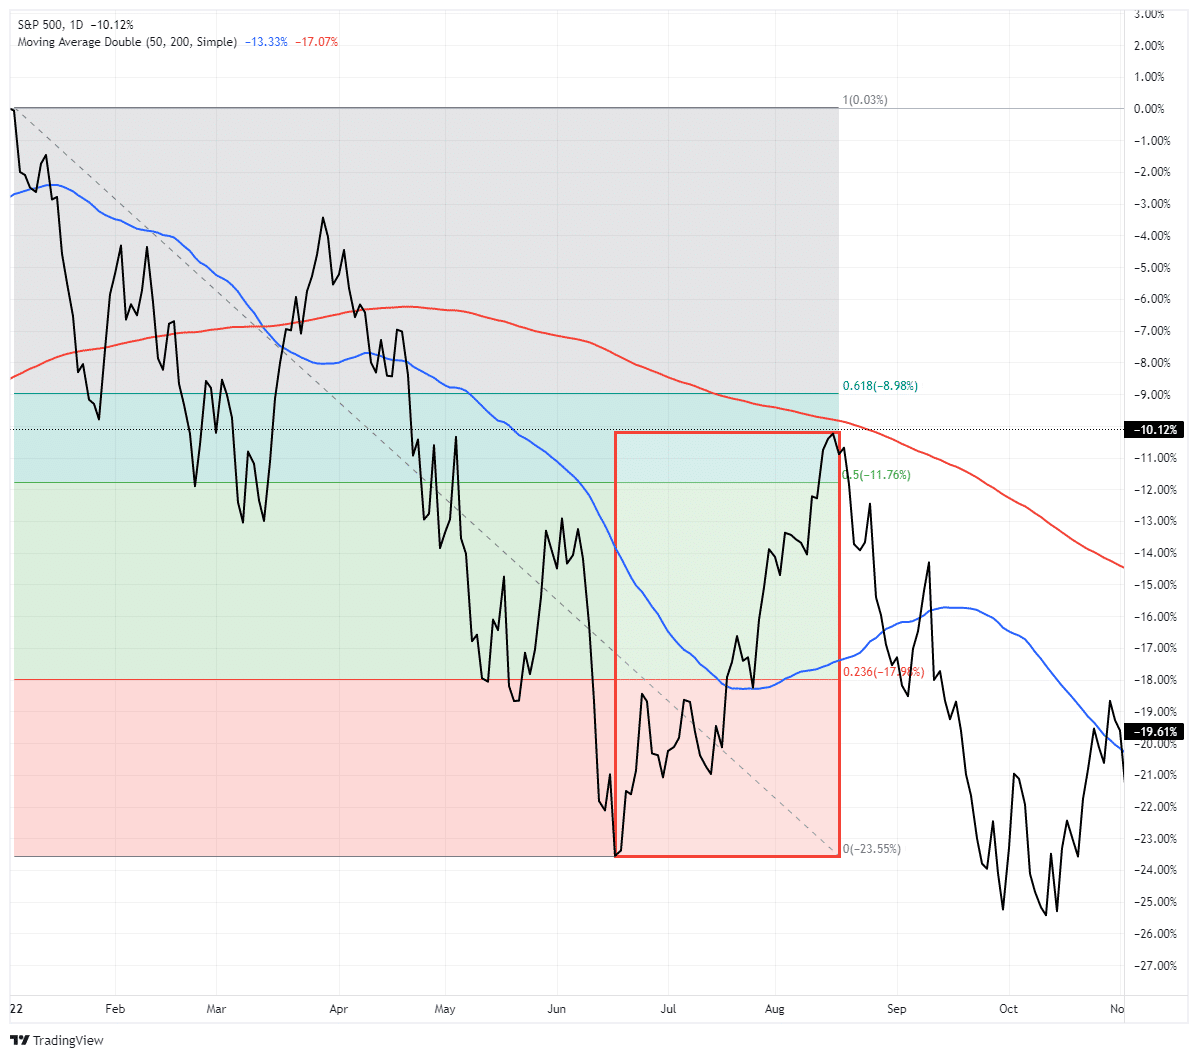
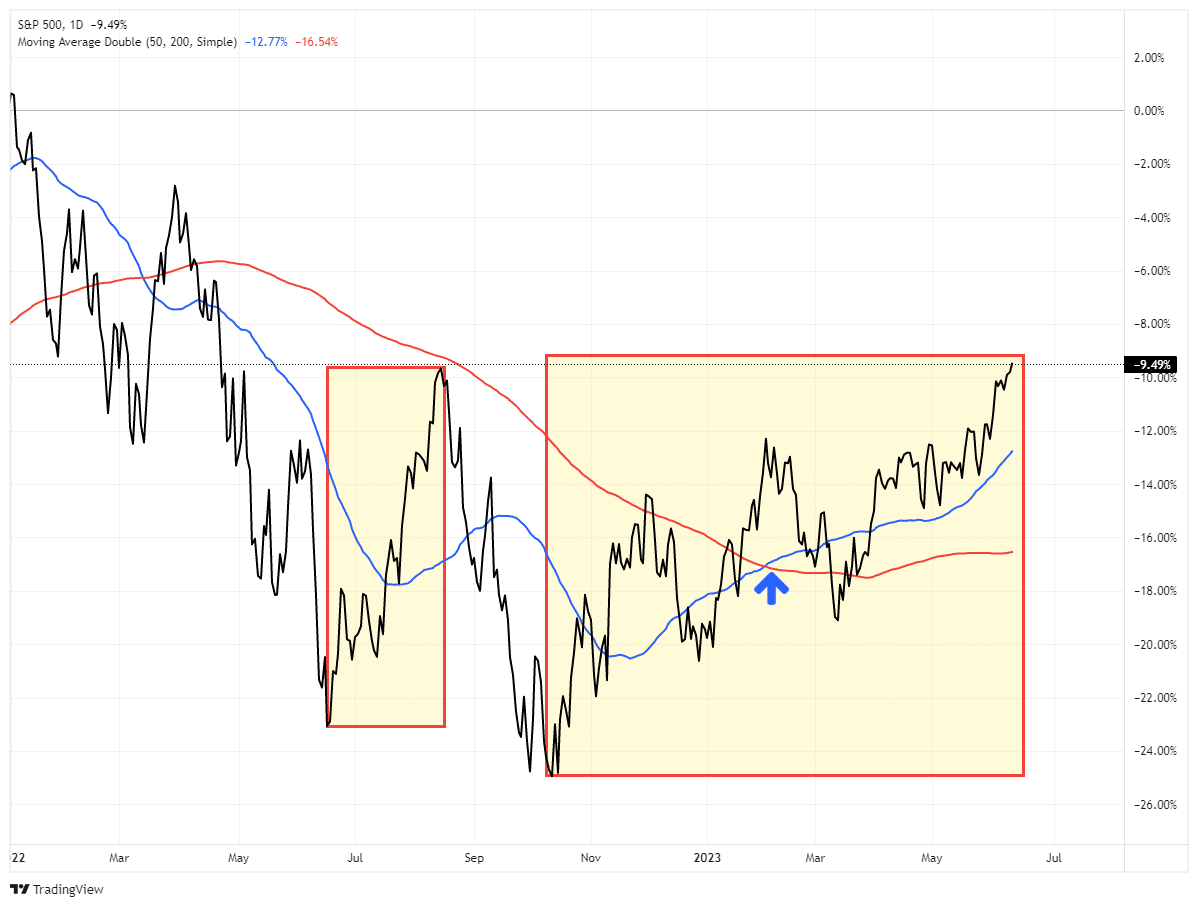
At that time, the market had surged more than 20% from the June lows, triggering a bull market’s arbitrary level. The media quickly jumped on board to proclaim the bear market dead. Furthermore, that market completed a 50% Fibonacci retracement from the lows (it retraced half of the previous decline), historically suggesting markets perform better over the next 12 months.
“Since WWII, every time the S&P recovered 50% of the bear market price decline, while the 500 may have re-tested the prior low, it never set a lower low,” Sam Stovall, Chief Investment Strategist at CFRA Research
The problem, then, is the bear market was not over, and during the next couple of months, as shown, the market set new lows.
The lesson here is that just because the technical indicators suggest a new bull market has started does not necessarily mean it has. However, there is an essential difference between then and now.
As shown, the market rallied more than 20% from the lows and completed the 50% retracement, but the market was trading BELOW the 200-day moving average. Such suggested that the market was in a bear market, and rallies to the 200-DMA were potential opportunities to reduce exposure rather than increase it.
Currently, it is a different technical setup.

Bear Markets Versus Corrections
We previously discussed that the 2020 and 2022 declines were not “bear markets.”
Instead, they were “corrections” within an ongoing bull market. To wit:
“What defines a bear market? To answer that question, let’s agree on a basic definition.“
- A bull market is when the market price trends higher over a long-term period.
- A bear market is when the previous positive trend breaks and prices trend lower.
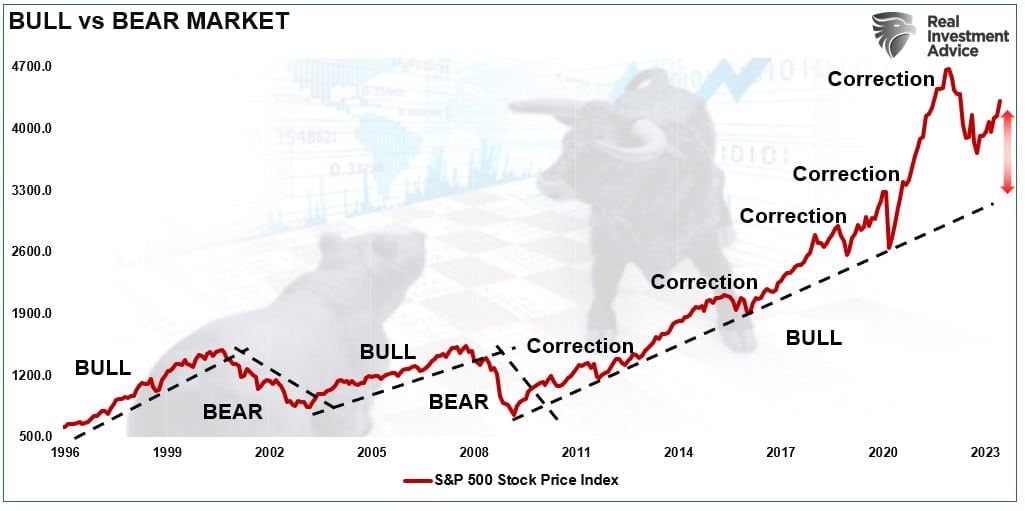
“The chart below provides a visual of the distinction. When looking at price “trends,” the difference becomes apparent and valuable.“
This distinction is essential to understanding the difference between “corrections” and “bear markets.”
- “Corrections” occur over short time frames, do not break the prevailing trends, and quickly resolve by reversing to new highs.
- “Bear Markets” are long-term affairs where prices grind sideways or lower over long periods as valuations revert.
The price decline in March 2020 was unusually swift using monthly closing data. However, that decline did not break the long-term bullish trend. It also quickly reversed to new highs, suggesting it was a “correction.”
Likewise, the decline in 2022 did not significantly test the long-term uptrend or revert valuations. Such also suggests it was a correction and not a bear market.
In both cases, the market was so stretched above the long-term bullish uptrend those 20% plus corrections were needed to reverse those deviations. The decline was not significant enough to break the bullish rising price trends.
Another way to view bear markets, corrections, or new bull markets, is by utilizing longer-term moving averages. The 40- and 200-week moving average provides a better view of price trends. When the market trades above the 40-week moving average (WMA), markets tend to be bullish. Breaks of the 40-WMA often set up a test of the longer-term bullish market trend defined by the 200-WMA. Breaks of the 200-WMA, as in 2008, represent a bear market.
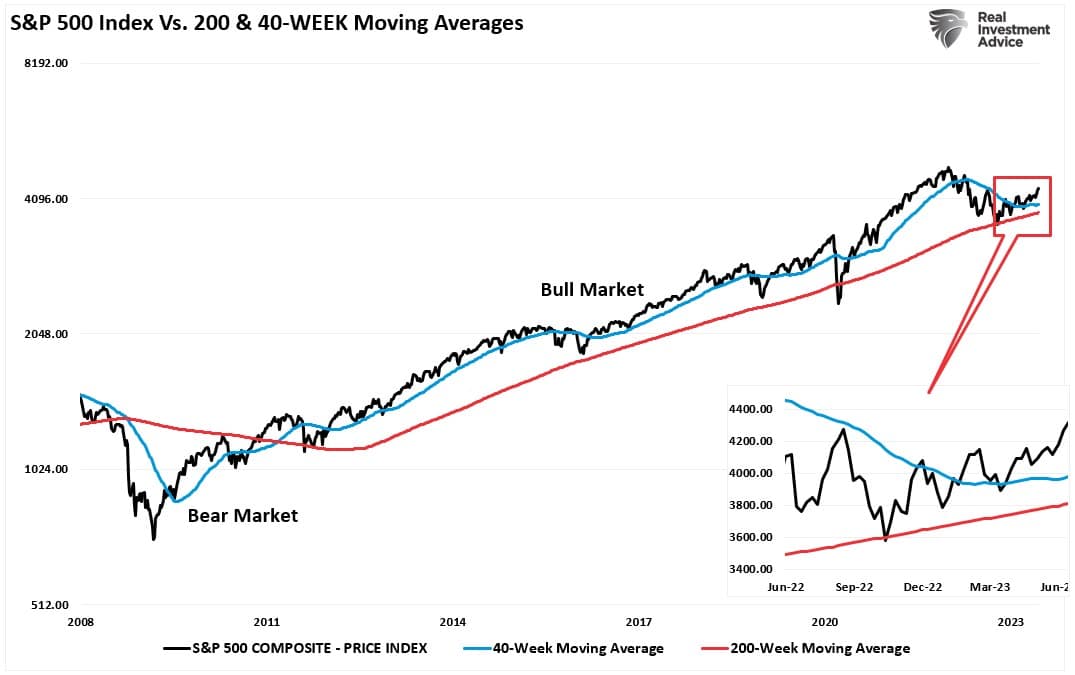
It is hard to suggest that we are in a “new bull market” when the bullish price trend from the 2009 lows remains intact. However, there is a difference between the 20% rally in 2022 and the current rally in 2023.

It’s Different This Time
While we are not in a new bull market, there is a difference between the current bullish rally and 2022. As noted, the 20% rally in 2022 rallied to the 200-DMA and failed at that resistance. The difference currently is that the market is trading well above the 200-DMA with a “bullish golden cross” of the 50-DMA above the 200-DMA. The technical backdrop is significantly different than that of 2022 and suggests that stocks will likely continue to trade higher in the coming months.
However, that does NOT mean we won’t have corrections along the way.
While markets are certainly in a more bullish trend, the recent surge in exuberance, as noted on Tuesday, is noteworthy.
“The current chase for stocks related to “artificial intelligence” has undoubtedly grabbed everyone’s attention. Retail investors are jumping back into the markets with both feet for the first time since last year.” – Is A.I. The New Dot.com?
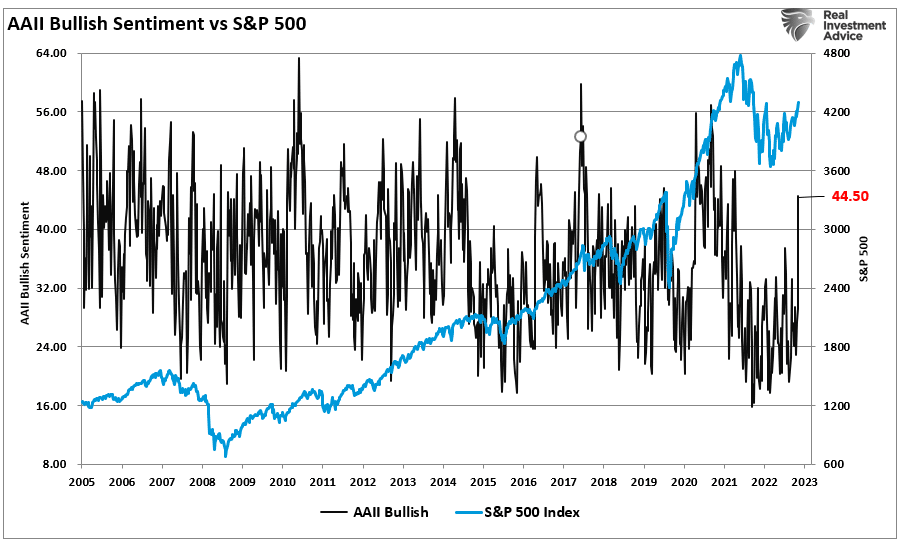
“The shift from bearish to bullish sentiment has been steady since the beginning of March. However, recently, there was an apparent capitulation as bearish investors turned bullish. As the market climbed, the “Net Bullish Ratio” (bullish, less bearish investors) of retail and professional investors turned sharply higher in recent weeks. While not at levels usually associated with market peaks, the sharp turn higher suggests a capitulation by the bears. “
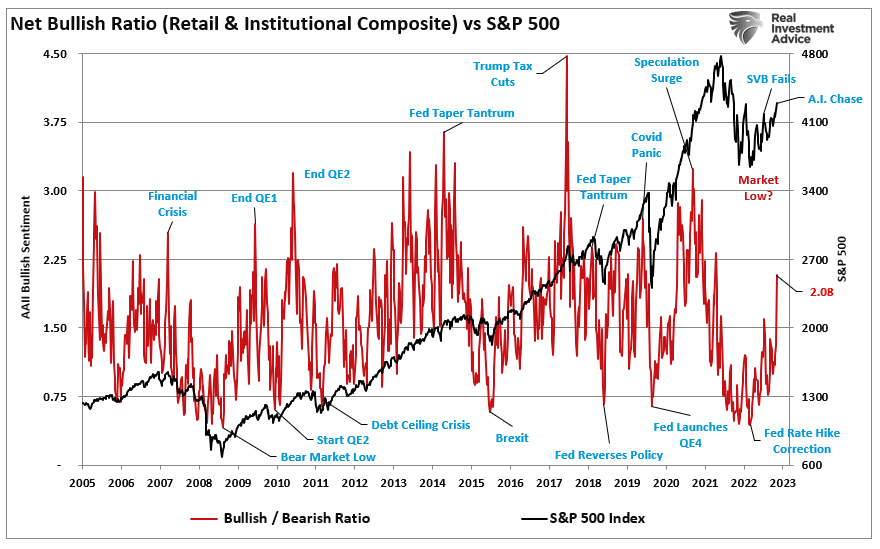
The critical point of that turn in exuberance is this:
“However, while that turn in bullish sentiment is not yet to more extreme levels, it is often the sign of the end of a rally rather than the beginning of one.“
Getting A Bit Extended
Another indication we may be closer to a correction in the market is the deviation from the longer-term moving averages. Corrections occur when the market begins to climb more than 10% above its long-term mean. Such is logical given that the “mean,” or average, price over a long period suggests that prices trade above and below that level. Therefore, moving averages provide a “gravitational pull” on prices. The more deviated from that longer-term mean, the stronger the pull on prices to correct back to that mean.
Currently, the S&P 500 is trading 10% above its 200-DMA.
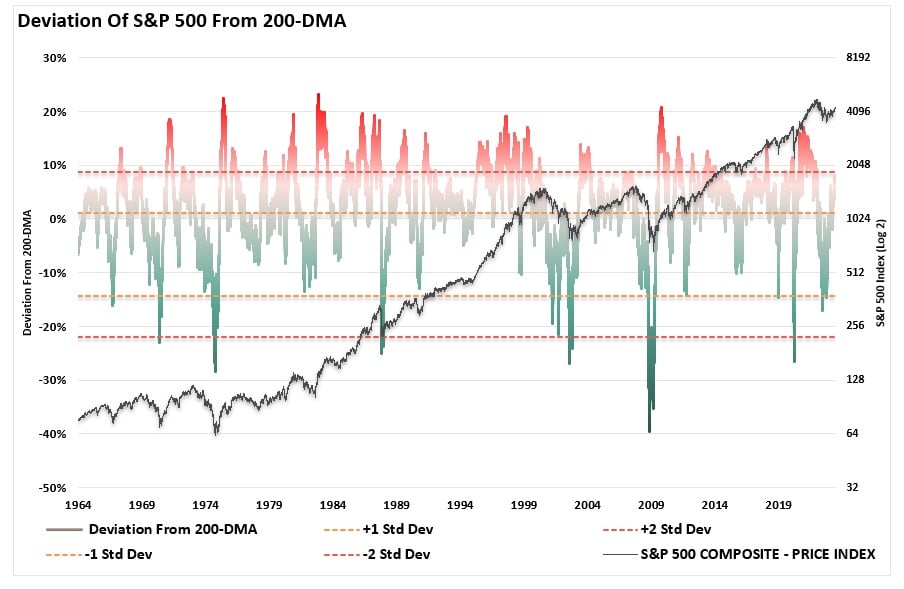
Because of the chase of technology stocks this year, the Nasdaq is more egregiously stretched and is nearing a 20% deviation.
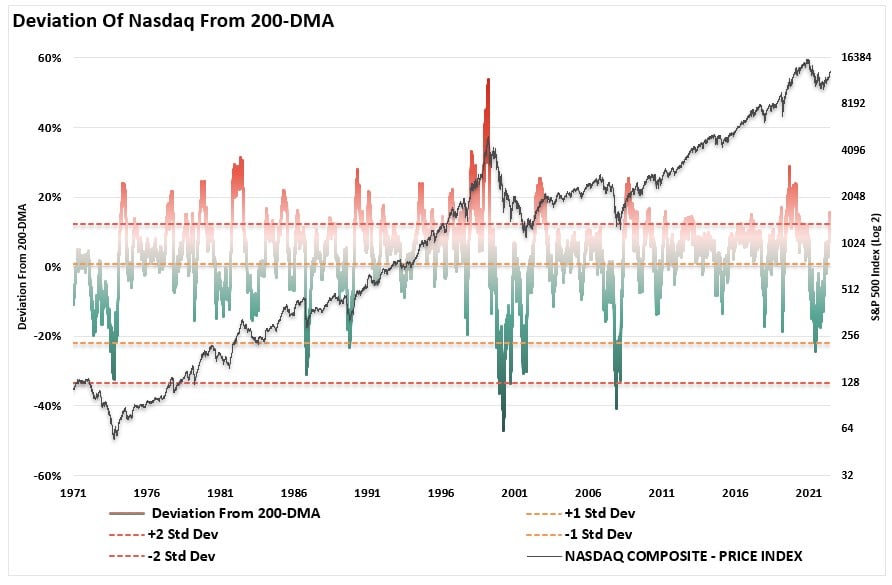
While such does not mean that markets won’t eventually move higher, in the near term, these deviations, combined with rising exuberance, suggest a near-term correction is likely.
Given that the market is clearly in a bullish trend, the 50-DMA has crossed above the 200-DMA, and the sentiment is improving, any support pullback will be a buying opportunity for investors to gain further exposure. While this is not a new bull market, the continuation of the existing bull market remains intact currently.
Can something change? Absolutely.
If it does, markets will begin to break support, the bullish price action and sentiment will reverse, and it will suggest that investors become more defensive again.
But for now, the bulls control the narrative, and the bears are being forced back into the market.
It is different this time.

