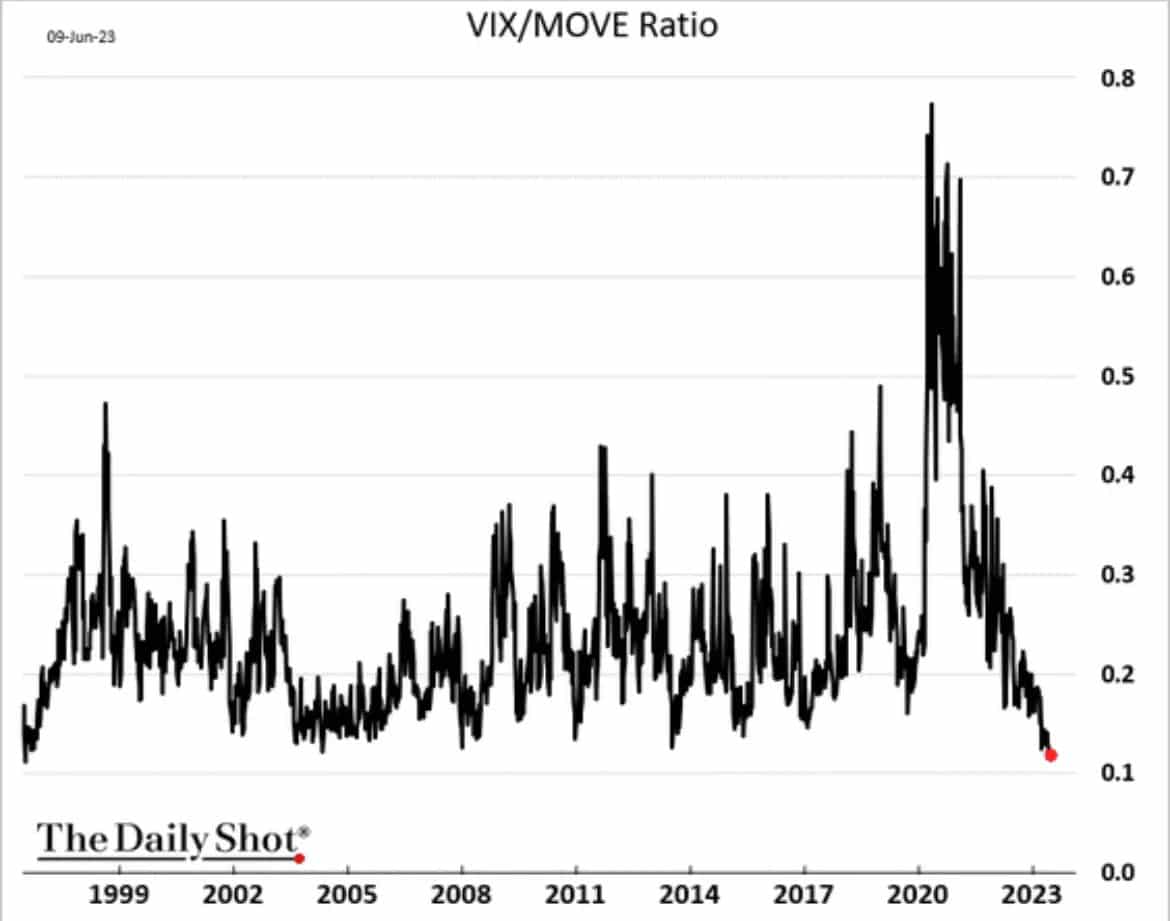
Implied volatility in the stock (VIX) and bond markets (MOVE) tell an unusual tale of investor sentiment. Implied volatility uses options contracts to measure the expected price movement of a security or index. The ratio of the VIX to the MOVE index is at its lowest level in 27 years. Such tells us that bond traders expect significant volatility in the future in bond yields, while stock investors are relatively complacent. The VIX, currently at 14, is well below its 30+ year average of 19.7. It is also below levels preceding the pandemic. Unlike the complacent VIX, the MOVE index is at 116, about 15% above the recent average and nearly double its longer-term average.
So why does the MOVE index voice concern that interest rates will be volatile, while the VIX shows investors don’t seem to care? For starters, the MOVE tends to run about 3x higher than the VIX as yield changes on a percentage basis are more volatile than stock prices. Further, realized, or actual volatility, has been much higher in bonds than stocks. Stock and bond investors may believe the status quo in both markets will continue. However, given the economy is powered by debt, the level of interest rates is a crucial factor in determining economic activity. When yields are unpredictable, as the MOVE alludes, the ability to forecast stock earnings, debt costs, and valuations is more complicated. The VIX/MOVE ratio will likely converge back to normal levels. Will the VIX catch up to MOVE, or will the Fed calm bond markets this Wednesday, allowing MOVE to normalize?
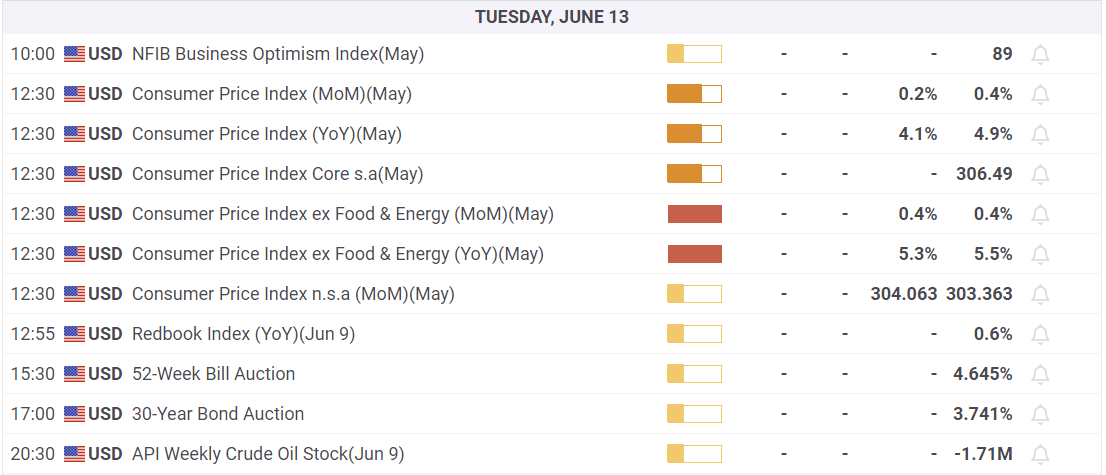
What To Watch Today
Earnings
- No notable earnings releases today
Economy
The Market Is Starting To Get A Bit Stretched
Whether or not we are in a new bull market will be a point of hot debate over the next few months. However, there is a difference between the current bullish rally and 2022. The 20% rally in 2022 rallied to the 200-DMA and failed at that resistance. The difference currently is that the market is trading well above the 200-DMA with a “bullish golden cross” of the 50-DMA above the 200-DMA. The technical backdrop is significantly different than that of 2022 and suggests that stocks will likely continue to trade higher in the coming months.
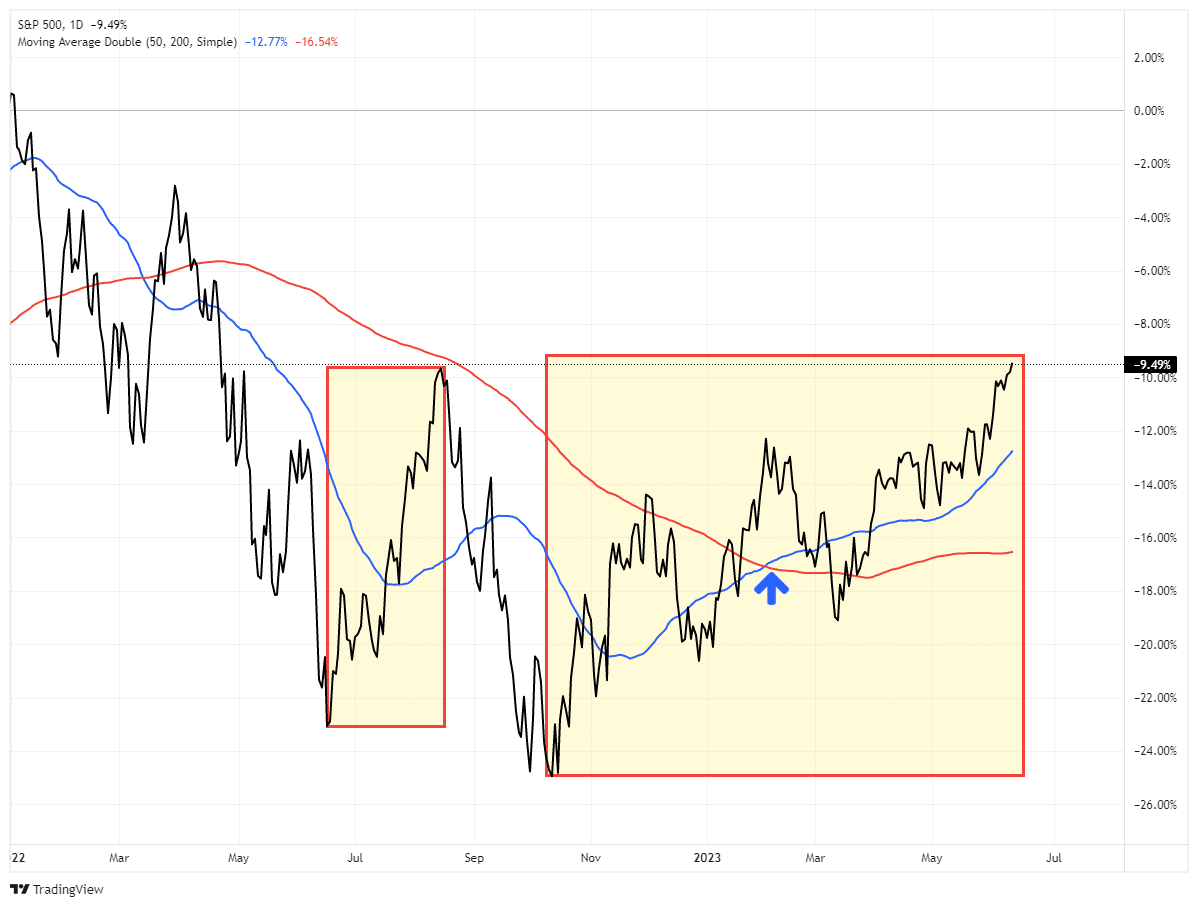
However, that does NOT mean we won’t have corrections along the way.
While markets are certainly in a more bullish trend, the recent surge in exuberance is noteworthy.
“The current chase for stocks related to “artificial intelligence” has undoubtedly grabbed everyone’s attention. Retail investors are jumping back into the markets with both feet for the first time since last year.” – Is A.I. The New Dot.com?
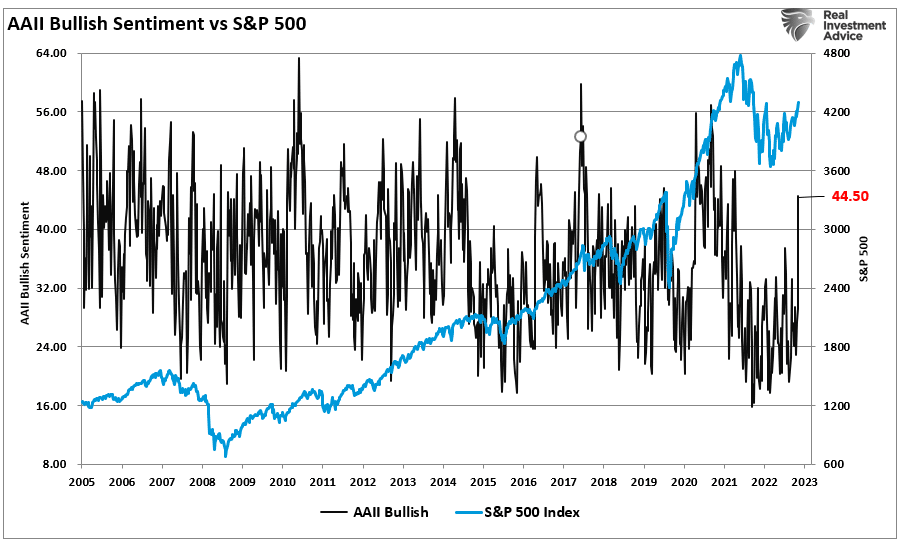
“The shift from bearish to bullish sentiment has been steady since the beginning of March. However, recently, there was an apparent capitulation as bearish investors turned bullish. As the market climbed, the “Net Bullish Ratio” (bullish, less bearish investors) of retail and professional investors turned sharply higher in recent weeks. While not at levels usually associated with market peaks, the sharp turn higher suggests a capitulation by the bears. “
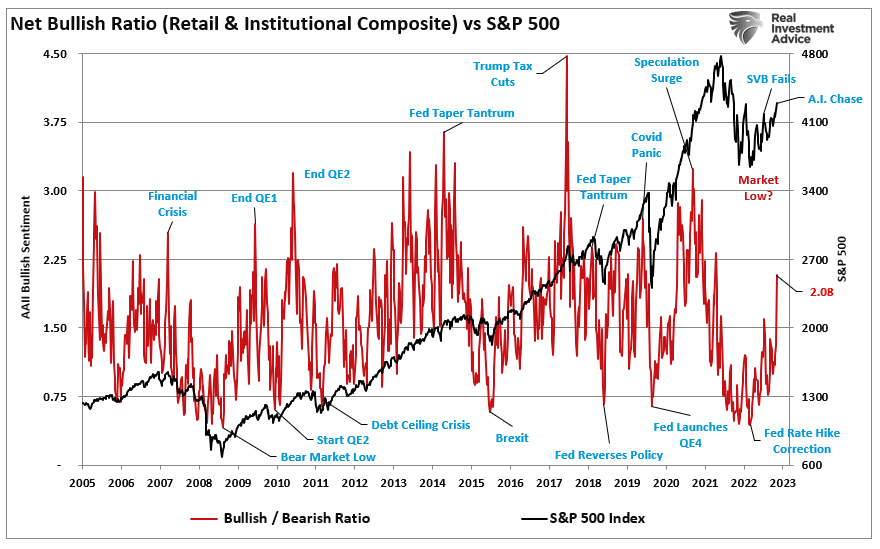
The critical point of that turn in exuberance is this:
“However, while that turn in bullish sentiment is not yet to more extreme levels, it is often the sign of the end of a rally rather than the beginning of one.“
Getting A Bit Extended
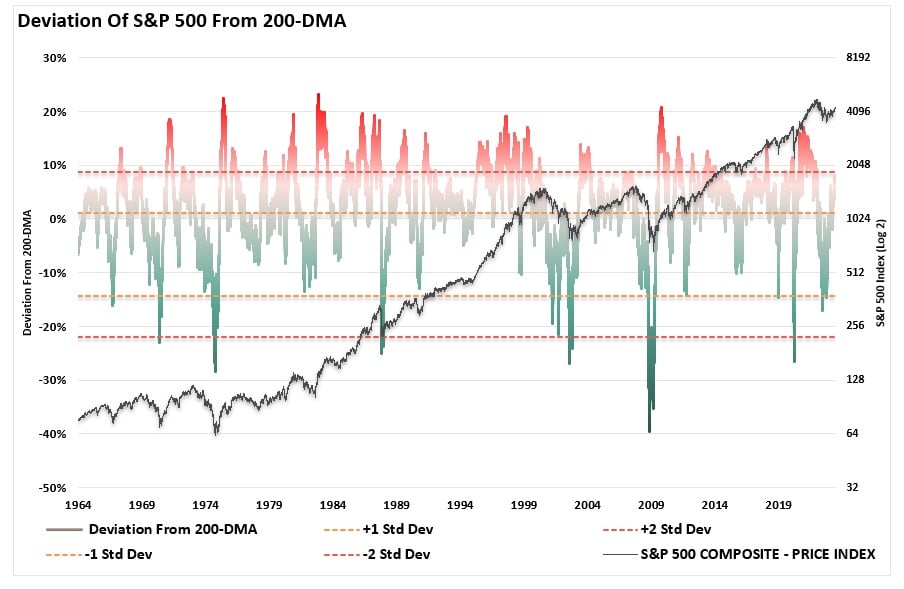
Another indication we may be closer to a correction in the market is the deviation from the longer-term moving averages. Corrections tend to occur when the market begins to climb more than 10% above its long-term mean. Such is logical given that the “mean,” or average, price over a long period suggests that prices trade above and below that level. Therefore, moving averages provide a “gravitational pull” on prices. The more deviated from that longer-term mean, the stronger the pull on prices to correct back to that mean.
Currently, the S&P 500 is trading 10% above its 200-DMA.
Because of the chase of technology stocks this year, the Nasdaq is more egregiously stretched and is nearing a 20% deviation.
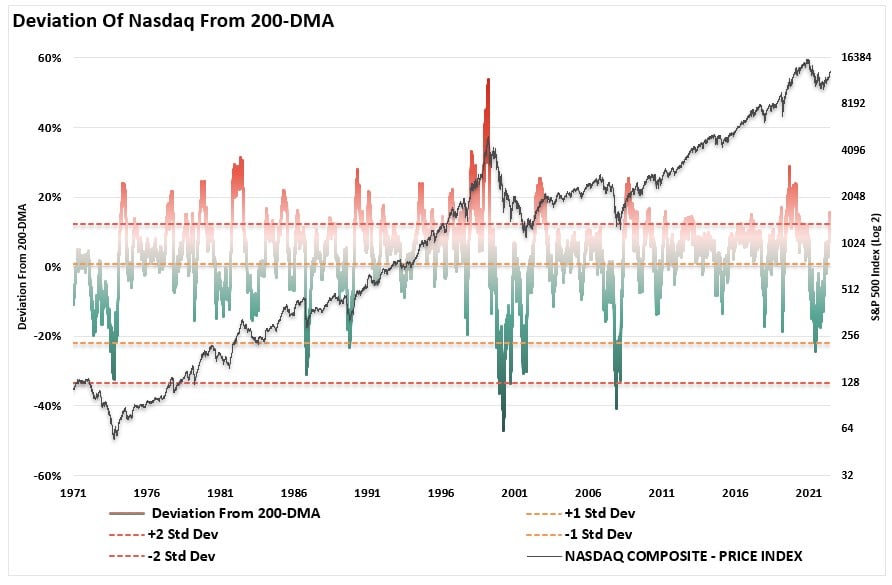
While such does not mean that markets won’t eventually move higher, in the near term, these deviations, combined with rising exuberance, suggest a near-term correction is likely.
Given that the market is clearly in a bullish trend, the 50-DMA has crossed above the 200-DMA, and the sentiment is improving, any support pullback will be a buying opportunity for investors to gain further exposure. While this is not a new bull market, the continuation of the existing bull market remains intact currently.
Can something change? Absolutely.
If it does, markets will begin to break support, the bullish price action and sentiment will reverse, and it will suggest that investors become more defensive again.
But for now, the bulls control the narrative, and the bears are being forced back into the market.
It is different this time.

Leading vs. Lagging Employment Data
While many sectors of the economy languish, the labor market remains red-hot. Until the unemployment rate increases markedly, a recession is not probable. That said, employment is often the last economic indicator to turn down before a recession. Ergo, if you are waiting on employment to turn to forecast a recession, you may be late to the game. As such, leading employment indicators are important to help predict what may happen to the labor market.
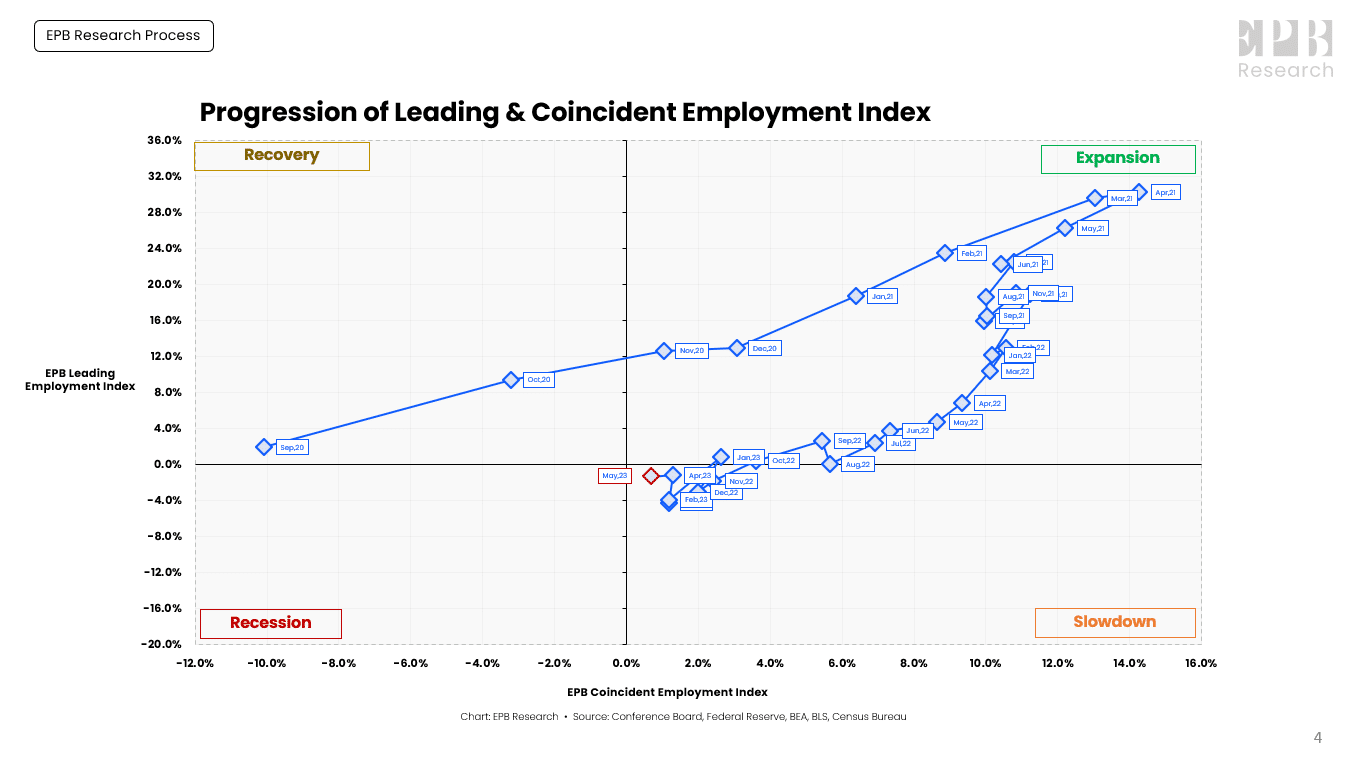
The graph below from EPB Research shows the employment cycle starting with the pandemic recovery in September 2020. As shown, from September to April 2021, leading employment indicators grew faster than coincident indicators. Afterward, the growth rates of both measures declined but were still growing. Over the last four months, leading indicators declined while coincident indicators remain positive, albeit nearing zero growth. The cycle of employment growth appears to be moving from slowdown to recession.
What are some key leading indicators of employment?
- Average weekly hours worked.
- Initial jobless claims and continued claims.
- The ratio of voluntary to involuntary part-time labor.
- Employment gauges with the manufacturing and service sector surveys.
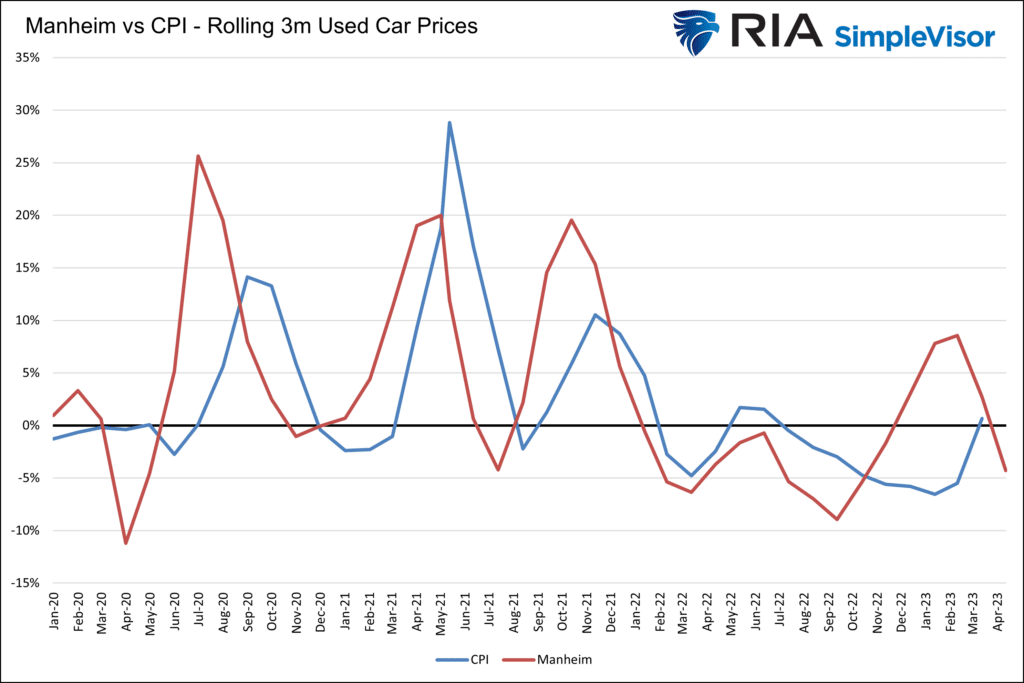
Used Car Prices Should Reduce the CPI
The graph below shows that the Manheim Used Car Index leads CPI-used car prices by two to three months. After used car prices surged in 2020 and 2021, they stabilized and declined in 2022. However, they started rising again later that year and in early 2023. Higher used car prices during the first quarter led many to believe another round of high inflation was coming. The gains were not sustained.
Used cars make up about 4.50% of the CPI index. If the CPI-used car prices index catches down to the Manheim index, CPI will be .35% lower. As we have discussed with rental prices, CPI often uses lagging indicators. While they may prove to be accurate, they are less timely.
Overbought and Ready for a “Reset“
In Monday’s Commentary, we wrote;
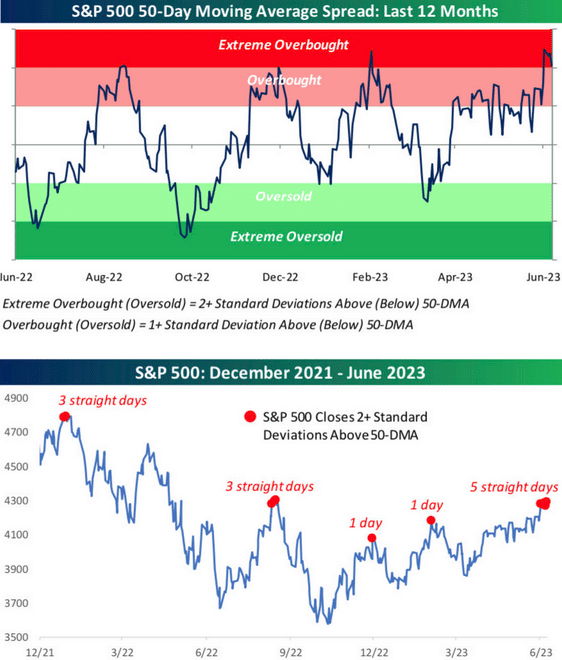
The consequence, of course, is a market that is pushing more extreme overbought levels than we have witnessed in quite some time. While it is possible for these extremes to last longer than logic would predict, it does suggest that without a correction to “reset” the markets, the upside will likely be limited near term.
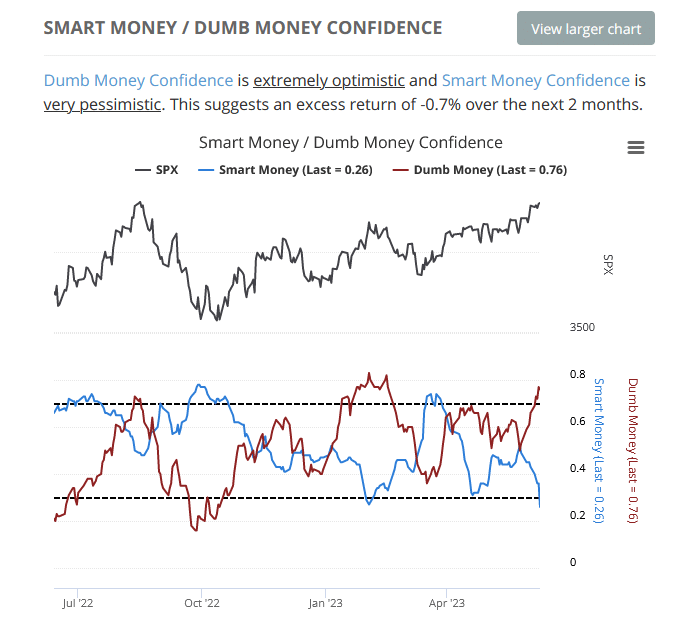
The graphs below, courtesy of Sentimentrader, further highlight that markets are extended and could use a rest. The first graph shows that the S&P 500 is over two standard deviations above its 50-day moving average, the highest extremity in at least a year. Prior instances of extreme overbought levels were met with declines. Further collaborating the evidence, the second graph shows that Sentimentrader’s “dumb money confidence” level is high while “smart money confidence” is low.
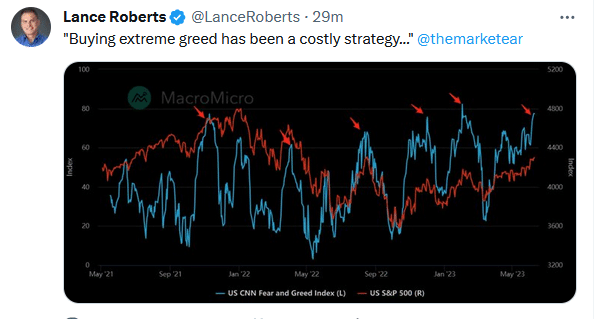
Tweet of the Day
Please subscribe to the daily commentary to receive these updates every morning before the opening bell.
If you found this blog useful, please send it to someone else, share it on social media, or contact us to set up a meeting.

