In September 2021, I discussed how the markets had set its sights on the S&P 500 index hitting 5000. To wit.
“Yes, the rally off the COVID-19 bottom in March 2020 has been extraordinary, but we think there are further gains ahead. Solid economic and corporate profit growth, in conjunction with a still-accommodative Fed, means that the environment for stocks remains favorable. As a result of our higher EPS estimates, we raise our targets for the S&P 500 for December 2021 by 100 points to 4,600 and June 2022 by 150 points to 4,800. We initiate our December 2022 target of 5,000, representing about 13% price appreciation from current levels.’” – David Lefkowitz, UBS.
Of course, the market peaked in January 2022, just four months later, at 4796.56. Fast forward 2-full years of returning investors to breakeven, and the market is again approaching that magical round number of 5000.
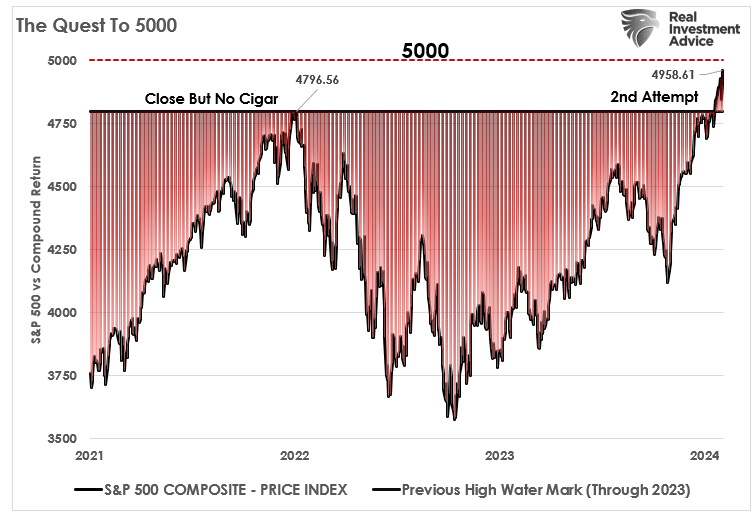
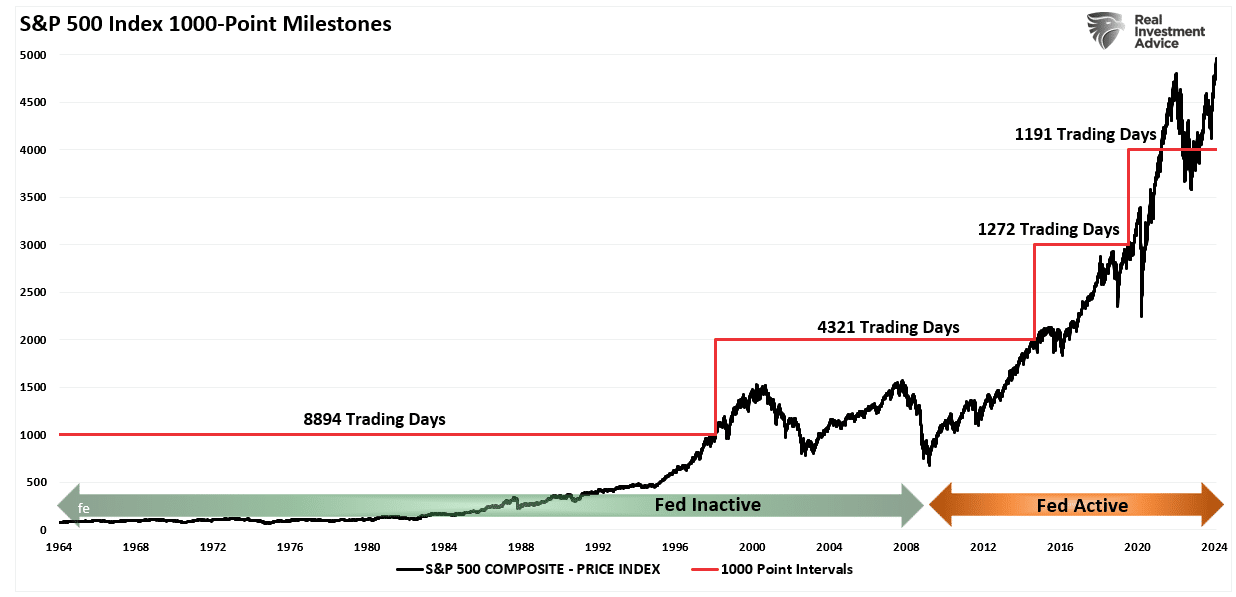
Nonetheless, with the market surging higher since the beginning of the year, bullish investors are drooling over the next significant milestone for the market – S&P Index 5000. These milestones have a gravitational pull as investors become fixated on them. Interestingly, the time to reach these milestones continues to shrink, particularly after the Federal Reserve became hyperactive with monetary policy changes.
These milestones have very little meaning other than being psychological markers or having the ability to put on an “S&P 5000” hat if you’re in the media. Nonetheless, the bullish backdrop suggests the market will likely hit that psychological level soon, if not already.
But the question we should be asking ourselves is what most likely will happen next.

Things Are Always The Same
Just a few months ago, in October, with the market down 10% from its peak, investors were very negative about the S&P Index.
More than once, I received emails asking me if “the selling is ever going to stop.”
Then I wrote an article explaining why “October Weakness Would Lead To A Year-End Run.” To wit:
“A reasonable backdrop between the summer selloff, sentiment, positioning, and buybacks suggests a push higher by year-end. Add to that the performance chase by portfolio managers as they buy stocks for year-end reporting purposes.”
Since then, there has been a stunning reversal of bearish sentiment. Investors once again believe that “nothing can stop this bull rally.”
Funny enough, that was the same sentiment discussed in the July 2022 report “Trading An Unstoppable Bull Market.”
“The S&P Index is set to close out its fifth straight month of gains. In addition to being up six out of the seven months this year, returns are unusually high, with the S&P advancing 18% year-to-date. There is little doubting the incredibly bullish tailwind for the US equities despite the Fed hiking interest rates and reducing its balance sheet.”
That was just before the 10% decline into October.
The history lesson is that investors again believe we are in an unstoppable bull market. With the S&P index set to set a historical record by hitting 5000, it seems nothing can derail the bulls. But such is always the sentiment just before it changes. The only question is, what causes the change in sentiment? Unfortunately, we will never know with certainty until after the fact.
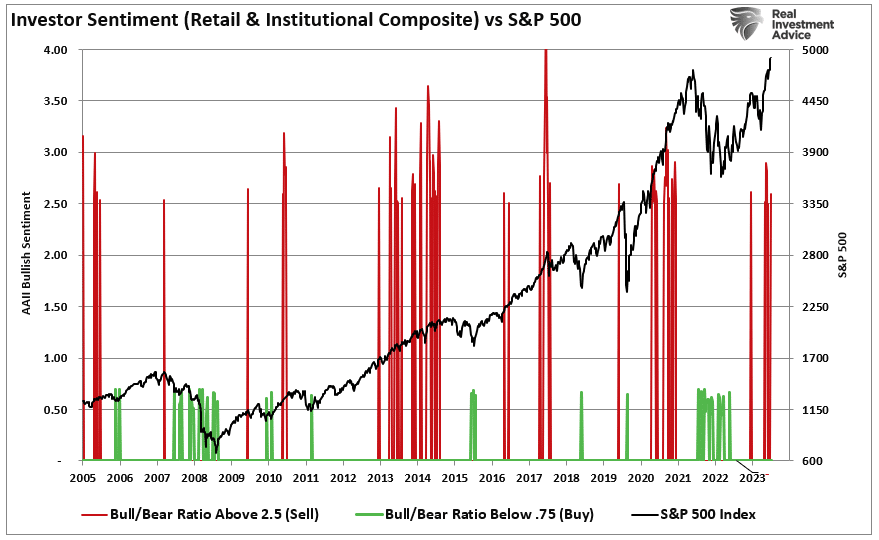
We do know that the market currently has all the ingredients needed for a period of price correction. For example, retail and professional investor sentiment is at levels usually associated with short- to intermediate-term market peaks. The chart below marks when the investor sentiment ratio is above 2.5. Those levels have previously marked short-term market peaks. Ratios below 0.75 have correlated with market bottoms.
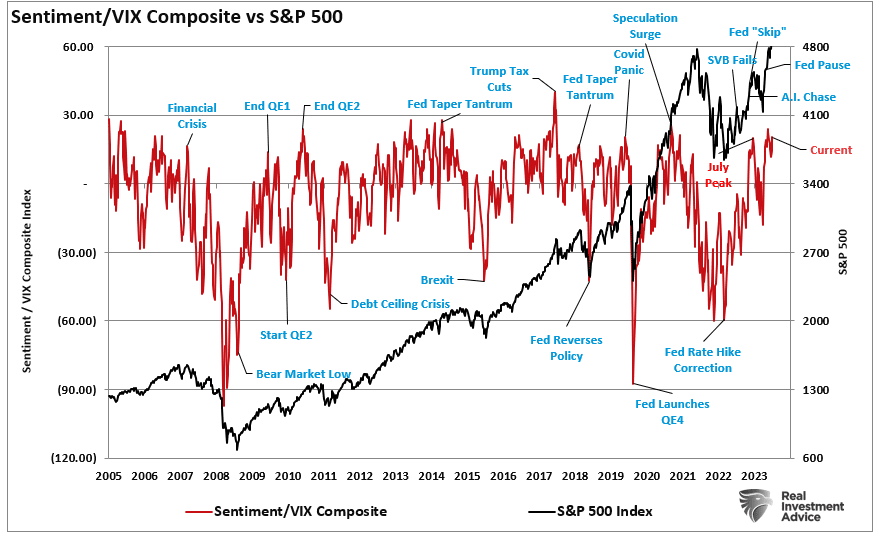
Another measure of bullish sentiment is comparing investor sentiment to the volatility index. Low levels of volatility exist when there is little concern about a market correction. Low volatility and bullish sentiment are often cozy roommates. The chart below compares the VIX/Sentiment ratio to the S&P Index. Once again, this measure suggests that markets are at risk of a short-term price correction.
Furthermore, our composite gauge of weekly technical indicators has already reached more extreme levels. Historically, we are close to a peak when this gauge exceeds 90 (scale is 0 to 100).
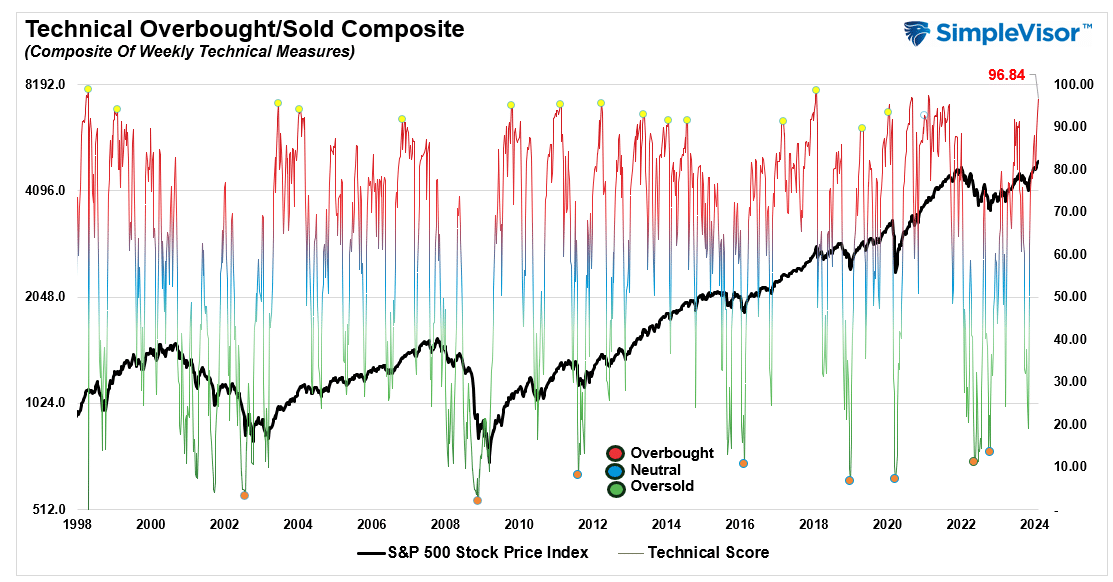
As is always the case, the resolution of more extreme bullish sentiment and technical price extensions is through a short-term reversal. However, such does not mean that the market won’t hit 5000 first, as we suspect it will.

S&P Index At 5000, Most Stocks Aren’t
Another interesting facet about the current market is that as the S&P Index approaches a psychological 5000 level, that advance continues to be a function of a relatively small number of stocks doing most of the lifting. As we discussed previously, given the weight of the top-10 “Market-Capitalization” companies in the S&P index, which currently comprises 35% of the index, as shown.
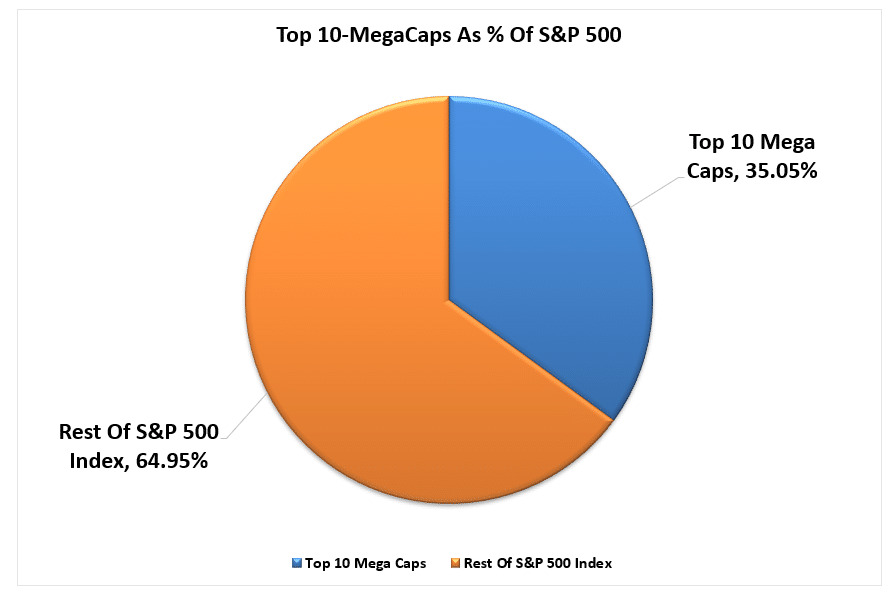
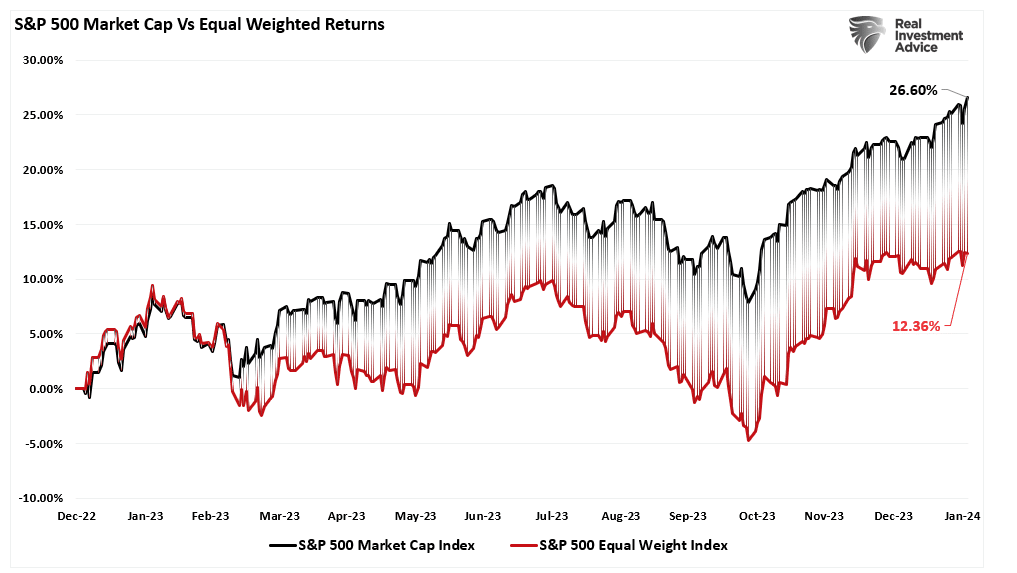
Those stocks disproportionately impact the performance of the index. That impact is represented by the comparison to the S&P 500 “Equal-Weight” index, which removes that effect.
This narrowness of winners and losers is better represented by comparing the major market’s relative performance since 2014. Other than the Nasdaq, which is heavily weighted in Technology, all other major markets have lagged the S&P Index.
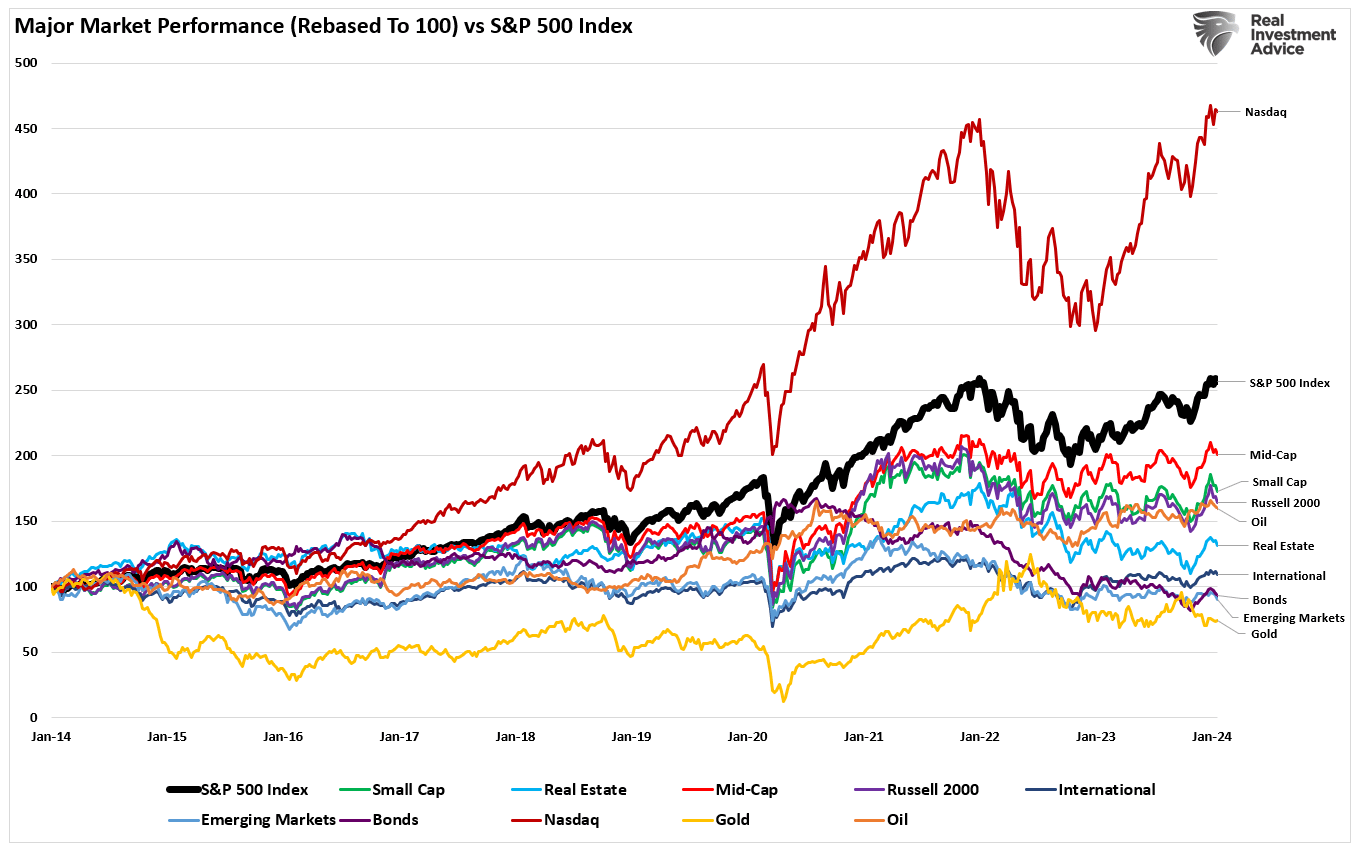
Even within the S&P index itself, except for Technology, all other sectors have underperformed the index since 2020.
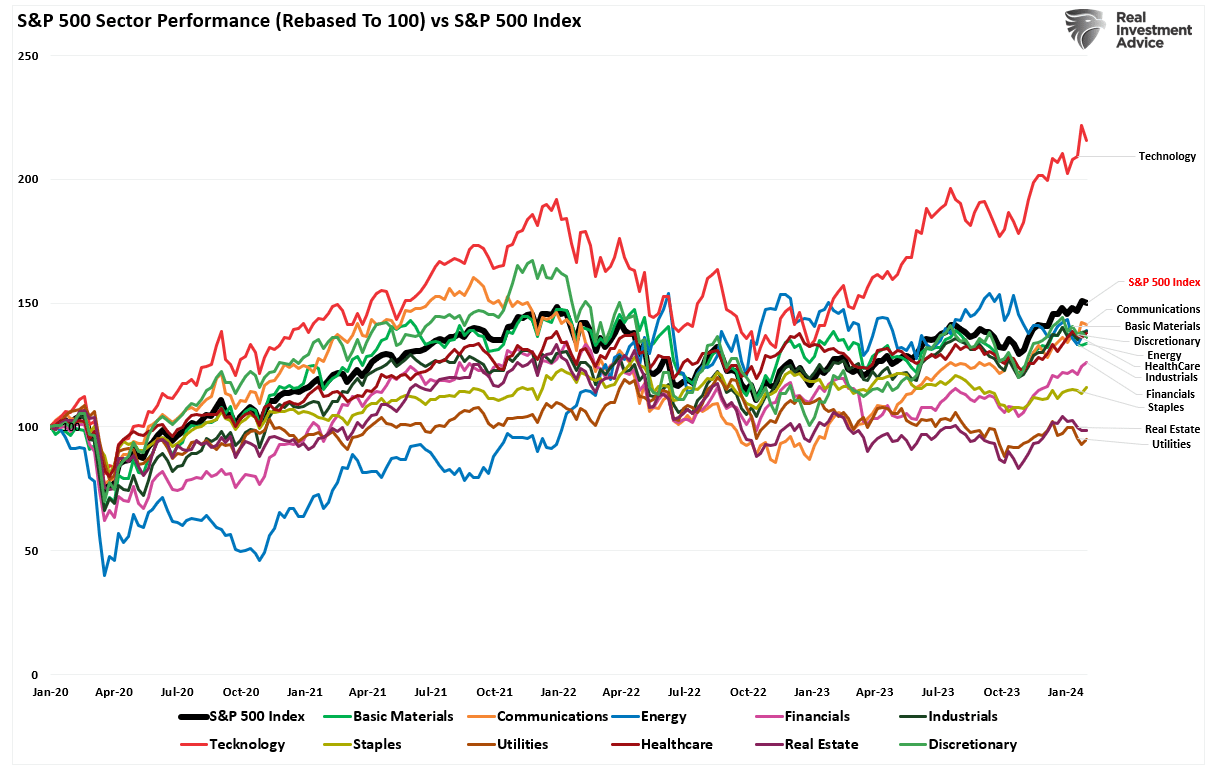
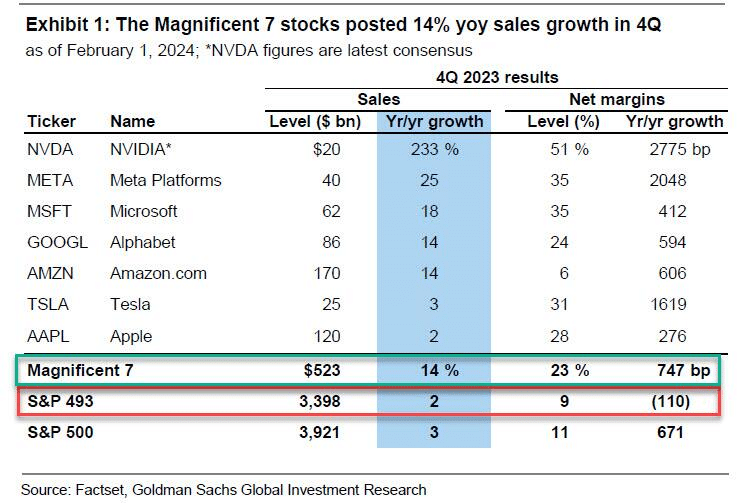
Critically, while the S&P index is hitting “all-time” highs and hitting the psychological level of 5000, it remains a story of the “haves” and the “have nots.” While Mega-capitalization companies have earnings, and investors are bidding up the market in anticipation of future earnings growth, earnings are declining for everyone else.
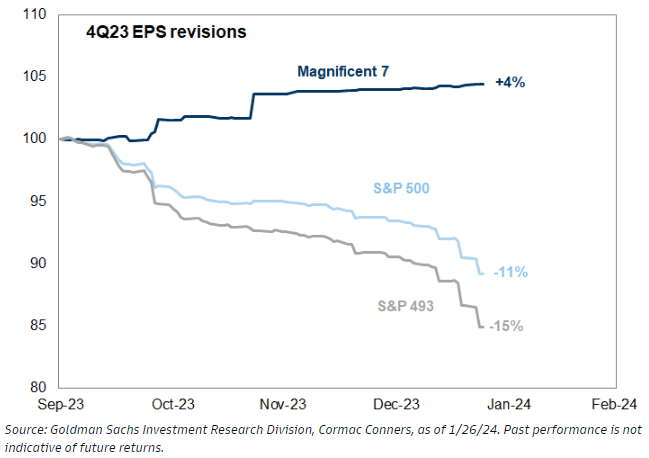
Here is the data numerically to better visualize the problem.
With markets technically stretched, sentiment bullish, and still weak fundamental underpinnings, the index hitting 5000 as a measure of market health is a bit of a mirage.
At some point, earnings for the broad market will need to accelerate, requiring more substantial economic growth rates, or a more meaningful correction will occur to realign valuations. Historically, it has been the latter.
Notably, such reversions in price have often occurred just after the market hits a psychological milestone.


Lance Roberts is a Chief Portfolio Strategist/Economist for RIA Advisors. He is also the host of “The Lance Roberts Podcast” and Chief Editor of the “Real Investment Advice” website and author of “Real Investment Daily” blog and “Real Investment Report“. Follow Lance on Facebook, Twitter, Linked-In and YouTube
Customer Relationship Summary (Form CRS)
Also Read