


While the bulls remain entirely in control of the market narrative, divergences and other technical warnings suggest becoming more cautious may be prudent.
In January 2020, we discussed why we were taking profits and reducing risk in our portfolios. At the time, the market was surging, and there was no reason for concern. However, just over a month later, the markets fell sharply as the “pandemic” set in. While there was no evidence at the time that such an event would occur, the markets were so exuberant that only a trigger was needed to spark a correction.
“When you sit down with your portfolio management team, and the first comment made is ‘this is nuts,’ it’s probably time to think about your overall portfolio risk. On Friday, that was how the investment committee both started and ended – ‘this is nuts.'” – January 11th, 2020.
As the S&P 500 index approaches another psychological milestone of 5000, we again see numerous warning signs emerging that suggest the risk of a correction is elevated. Does that mean a correction will ensue tomorrow? Of course not. As the old saying goes, “Markets can remain irrational longer than you can remain solvent.” However, just as in 2020, it took more than a month before the warnings became reality.
While discussing the risk of a correction, it was just last October that we discussed why a rally was likely. The reasons at that time were almost precisely the opposite of what we see today. There was extremely bearish investor sentiment combined with negative divergences of technical indicators, and analysts could not cut year-end price targets fast enough.
What happened next was the longest win streak in 52 years that pushed the market to new all-time highs.
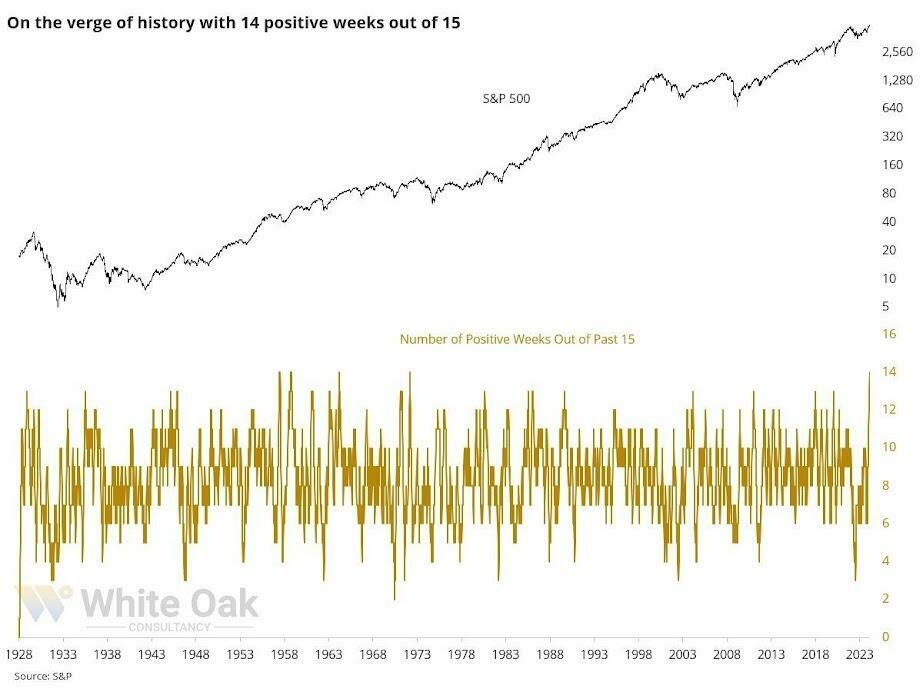
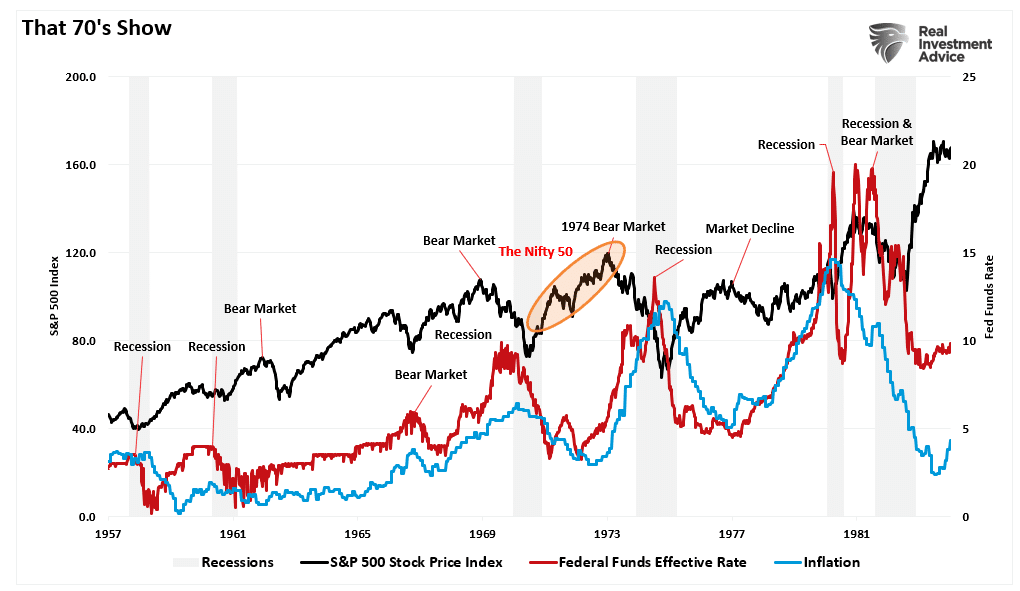
The last time we saw such a rally was between November 1971 and February 1972. Of course, the “Nifty Fifty” rally preceded the 1973-74 bear market. Then, like today, a handful of stocks were driving the markets higher as interest rates were elevated along with inflation.
While there are many differences today versus then, there are reasons for concern.

The “New Nifty 50”
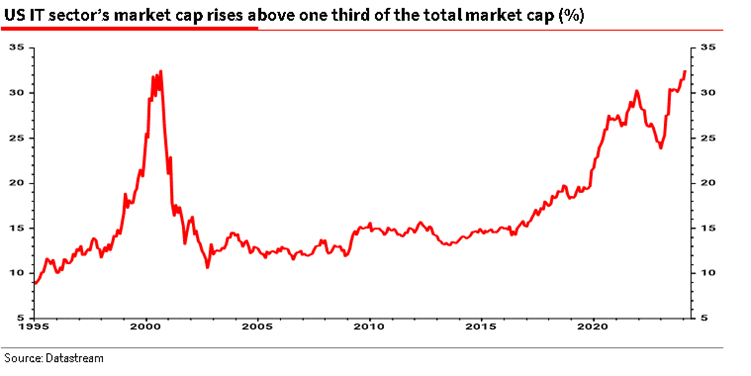
My colleague Albert Edwards at Societe Generale recently discussed the rising capitalization of the technology market.
“I never thought we would get back to the point where the value of the US tech sector once again comprised an incredible one third of the US equity market. This just pips the previous all-time peak seen on 17 July 2000 at the height of the Nasdaq tech bubble.
What’s more, this high has been reached with only three of the ‘Magnificant-7’ internet stocks actually being in the tech sector (Apple, Microsoft, and Nvidia)! If you add in the market cap of Amazon, Meta, Alphabet (Google) and Tesla, then the IT and ‘internet’ stocks dominate like never before.”
Of course, there are undoubtedly important differences between today and the “Dot.com” era. The most obvious is that, unlike then, technology companies generate enormous revenues and profits. However, this was the same with the “Nifty-50” in the early 70s. The problem is always two-fold: 1) the sustainability of those earnings and growth rates and 2) the valuations paid for them. If something occurs that slows earnings growth, the valuation multiples will get revised lower.
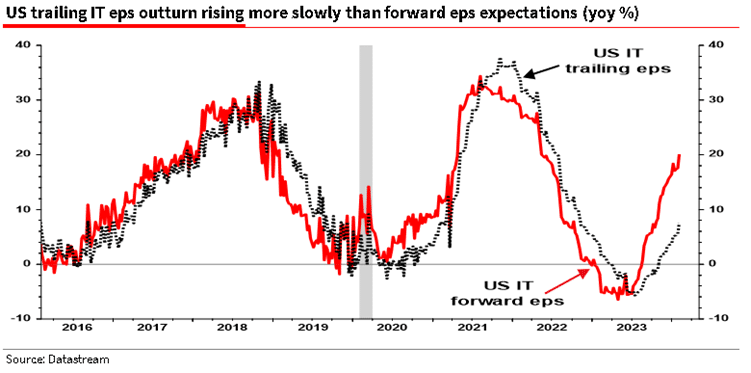
While the economic backdrop has seemingly not caught up with technology companies yet, the divergence of corporate profits between the Technology sector and the rest of the market is likely unsustainable.
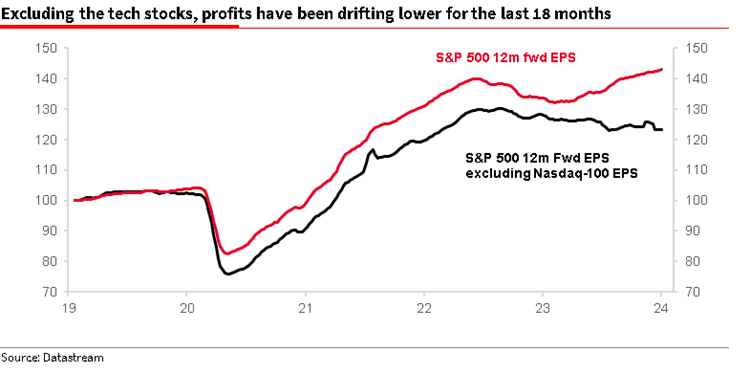
That inability to match the pace of expectations is already occurring. That divergence poses a substantial risk to investors.
Again, while the risk is somewhat evident, the “bullishness” of the market can last much longer than logic would predict. Valuations, as always, are a terrible market timing device; however, they tell you a lot about long-term returns from markets. Currently, the valuations paid for technology stocks are alarming and hard to justify.
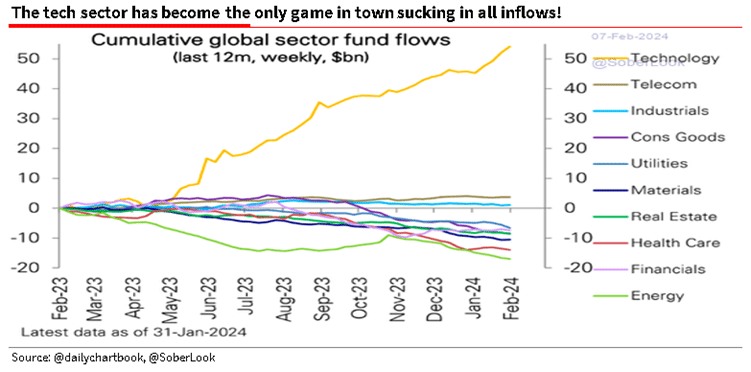
However, despite valuations, those stocks can keep ramping higher in the short term (6-18 months) as the speculative flows continue.
However, over the next few months, some divergences and indicators suggest caution is advisable.

Technical Divergences Add To The Risk
Each weekend in the BullBearReport, investor sentiment is something that we track closely. The reason is that when investor sentiment is extremely bullish or bearish, such is the point where reversals have occurred. As Sam Stovall, the investment strategist for Standard & Poor’s, once stated:
“If everybody’s optimistic, who is left to buy? If everybody’s pessimistic, who’s left to sell?”
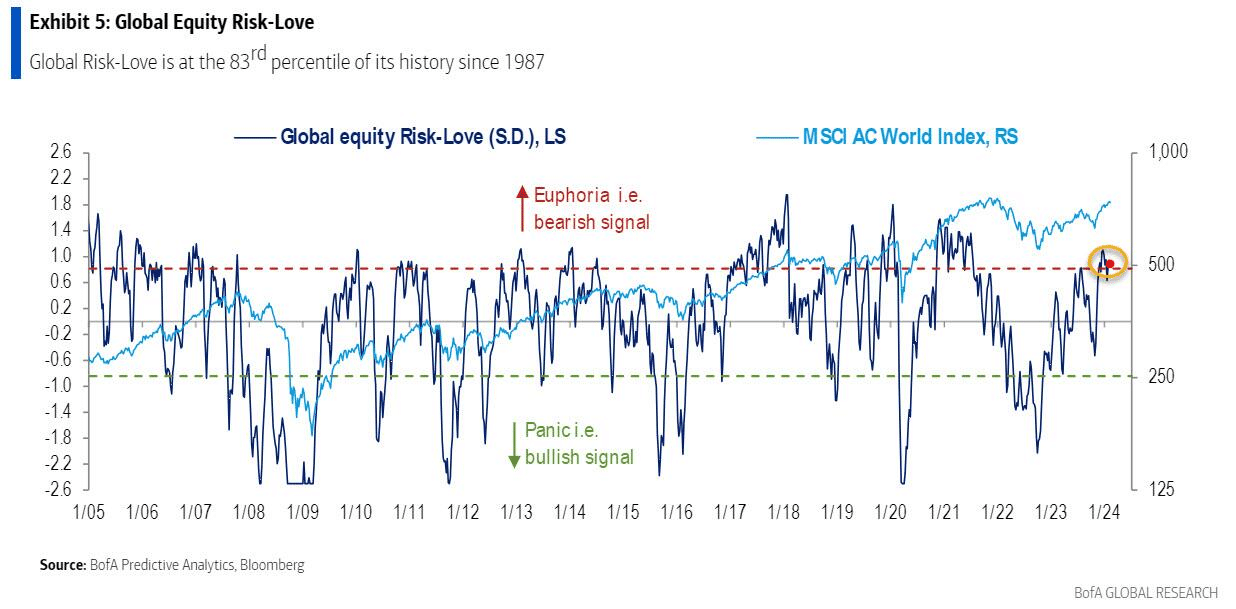
Currently, everyone is very optimistic about the market. Bank of America, one of the world’s largest asset custodians, monitors risk positioning across equities. Currently, “risk love” is in the 83rd percentile and at levels that have generally preceded short-term corrective actions.
At the same time, retail and professional investors are also exuberant, as noted on Tuesday.
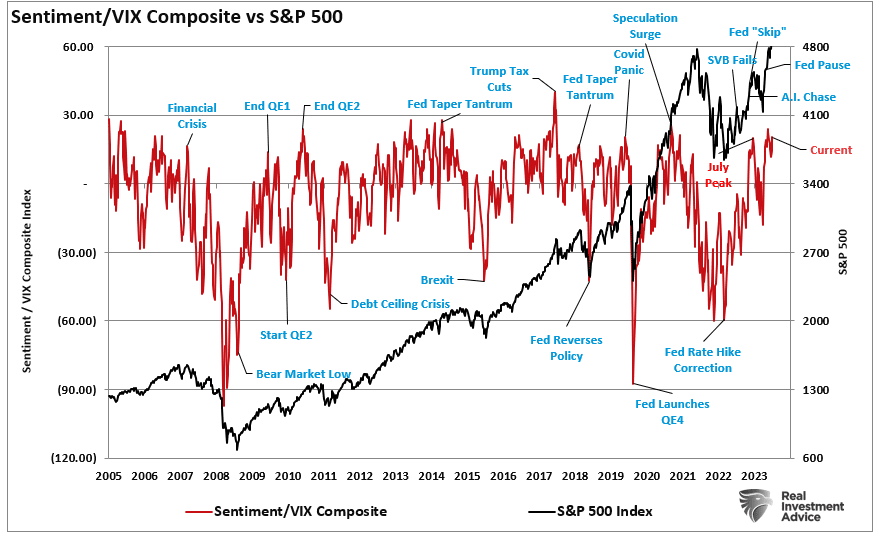
“Another measure of bullish sentiment is comparing investor sentiment to the volatility index. Low levels of volatility exist when there is little concern about a market correction. Low volatility and bullish sentiment are often cozy roommates. The chart below compares the VIX/Sentiment ratio to the S&P Index. Once again, this measure suggests that markets are at risk of a short-term price correction.”
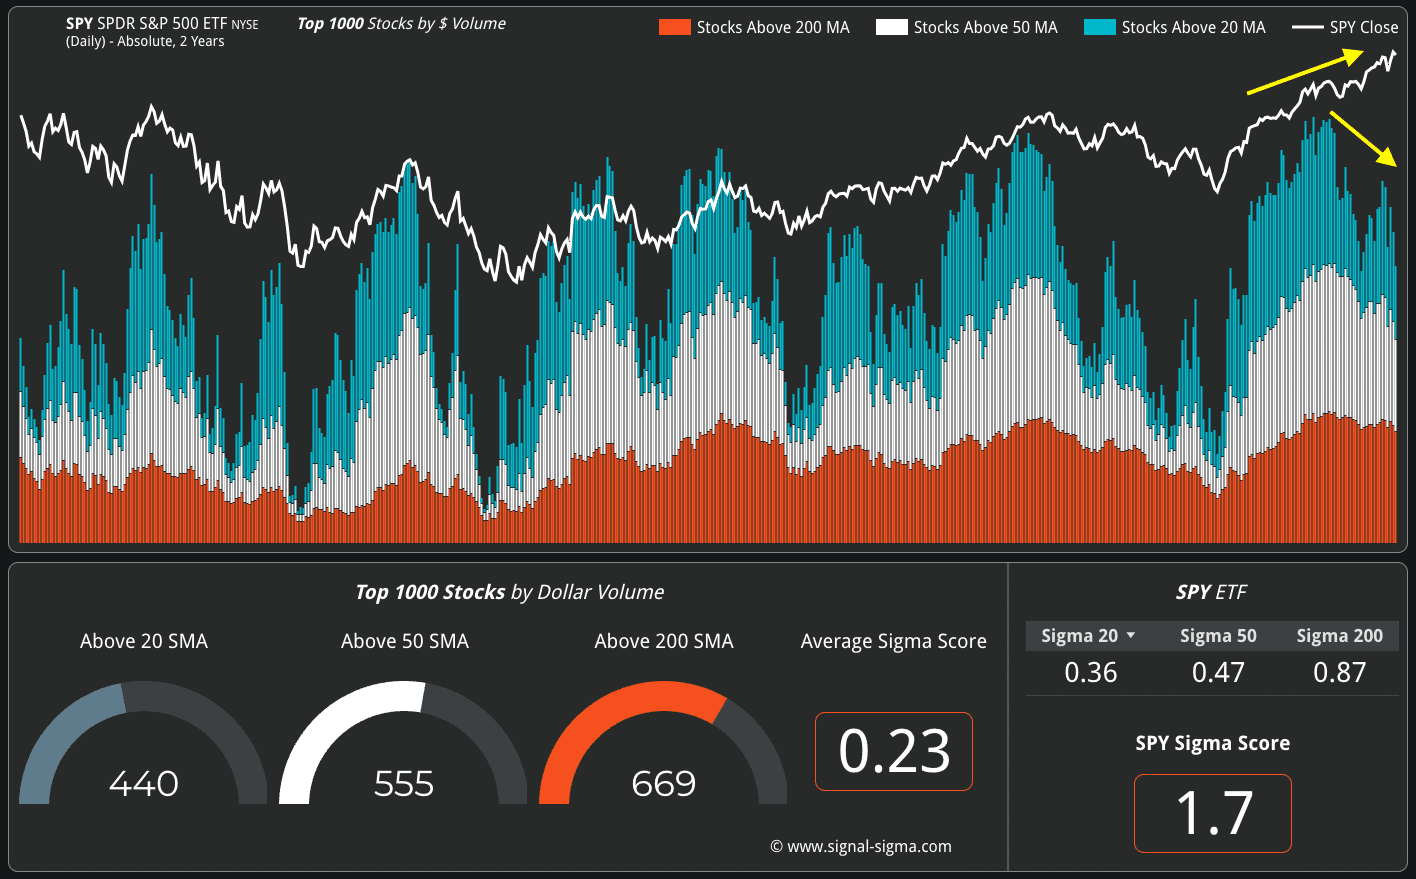
However, while everyone is exceedingly bullish on the market, the internal divergence of stocks sends warning signals. Andrei Sota recently showed that market breadth is weakening despite record highs. Note that prior market peaks were accompanied by peaks in the percentage of stocks above their 20, 50, and 200-day moving averages. To further hammer home this point, consider the following Tweet from Jason Goepfert of Sentimentrader:
“Man, this is weird. The S&P 500 is within .35% of a 3-year high. Fewer than 40% of its stocks are above their 10-day avg, fewer than 60% above their 50-day, and fewer than 70% above their 200-day. Since 1928, that’s only happened once before: August 8, 1929.“
That negative divergence between stocks making new highs and the underlying breadth is a good reason to be more cautious with allocations currently.
As I started this commentary, “This is nuts.”

So Why Not Go To Cash
This analysis raises an obvious question.
“Well, if this is nuts, why not go to cash and wait out the correction and then buy back in.”
The best answer to that question came from Albert Edwards this week.
“I cast my mind back to 2000 where the narrative around the then IT bubble was incredibly persuasive, just as it is now. But the problem that skeptical investors have now, as they did in 1999, is that selling, or underweighting US IT, can destroy performance if one exits too early.”
Regarding speculative bull markets, as noted above, the “this is nuts” part can remain “nuts” for much longer than you think. Therefore, given that we have to generate returns for our clients or suffer career risk, we must be careful not to exit the markets too early…or too late.
Therefore, regardless of your personal views, the bull market that started in October remains intact. The speculative frenzy is still present. As such, we are reducing equity exposure modestly and rebalancing risk by following our basic procedures.
- Trim Winning Positions back to their original portfolio weightings. (ie. Take profits)
- Sell Those Positions That Aren’t Working. If they don’t rally with the market during a bounce, they will decline when it sells off again.
- Move Trailing Stop Losses Up to new levels.
- Review Your Portfolio Allocation Relative To Your Risk Tolerance. If you have an aggressive allocation to equities at this point of the market cycle, you may want to try to recall how you felt during 2008. Raise cash levels and increase fixed income accordingly to reduce relative market exposure.
Could I be wrong? Absolutely.
But a host of indicators are sending us an early warning.
What’s worse:
- Missing out temporarily on some additional short-term gains or
- Spending time getting back to even which is not the same as making money.
“Opportunities are made up far easier than lost capital.” – Todd Harrison


Lance Roberts is a Chief Portfolio Strategist/Economist for RIA Advisors. He is also the host of “The Lance Roberts Podcast” and Chief Editor of the “Real Investment Advice” website and author of “Real Investment Daily” blog and “Real Investment Report“. Follow Lance on Facebook, Twitter, Linked-In and YouTube
Customer Relationship Summary (Form CRS)
Also Read


