
Government bonds or stocks? If you were picking an asset class to outperform over the next 18-24 months, which would you choose? Such was an interesting point made by Greg Feirman last week. To wit:
“The market has now priced in a soft landing based on the idea that the Fed can get inflation under control without causing the economy to roll over into recession. As a result, investors have piled into QQQ and completely lost interest in TLT. Personally, I’m of the opposite view:
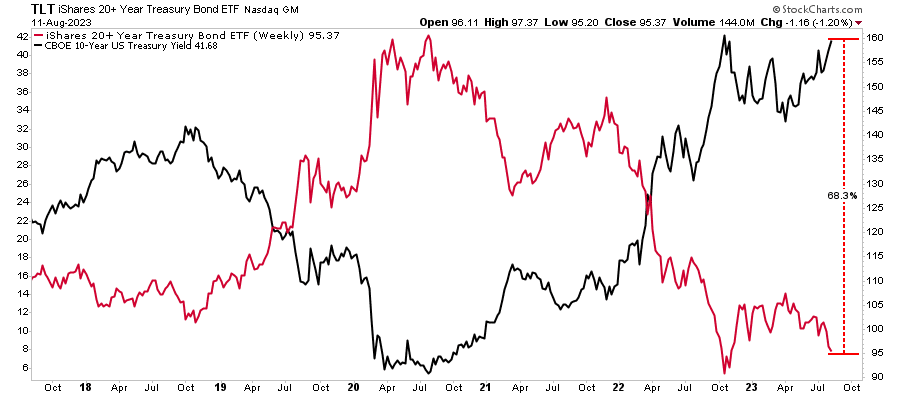
All the Fed’s tightening is still working its way through the economic system and will eventually cause the economy to roll over into recession. In addition, Big Tech is now mature and will have to be repriced from growth stocks to value stocks, putting significant pressure on the indexes. If I’m correct, this creates one of the best contrarian trades I’ve seen: Long TLT, Short QQQ. TLT closed Monday at $95.58, while QQQ closed at $375.19. My 18-month price targets are TLT $135 and QQQ $280.“
If we use the recent highs for the Nasdaq 100 index ETF (QQQ), Greg is assuming a roughly 38% decline in the Nasdaq. While that sounds like a massive decline, it would only wipe out the 2023 gains. However, the long government bond trade in TLT would net roughly a 42% gain as bond prices returned to the beginning of 2022.
That’s Crazy Talk?
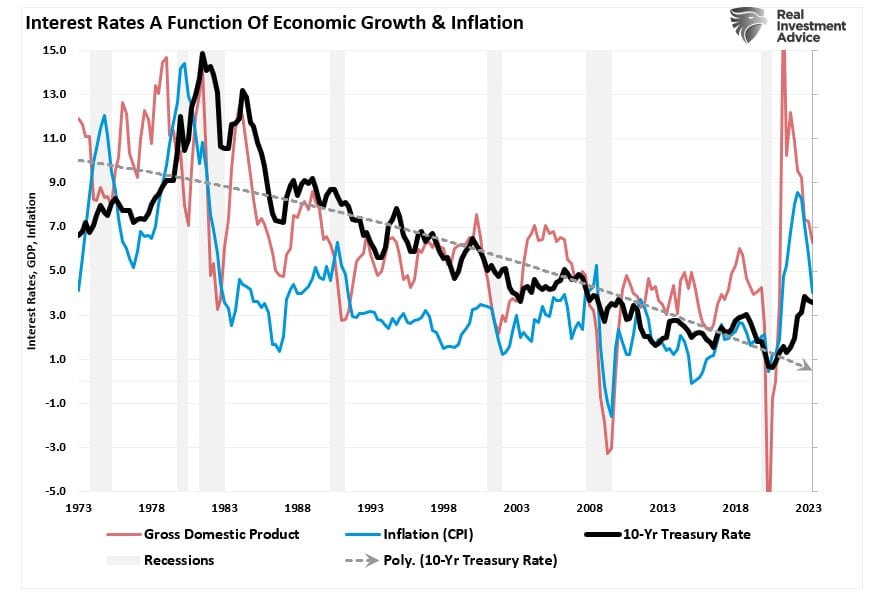
Greg’s assumptions are not as outlandish as they may seem. If interest rates, as shown, return to levels of an expected recessionary period, you can understand the value proposition made. Interest rates are a function of economic growth and inflation. Therefore, when the next recession begins, rates will fall accordingly.
We see the same in comparing the annual rate change versus real economic growth rates.
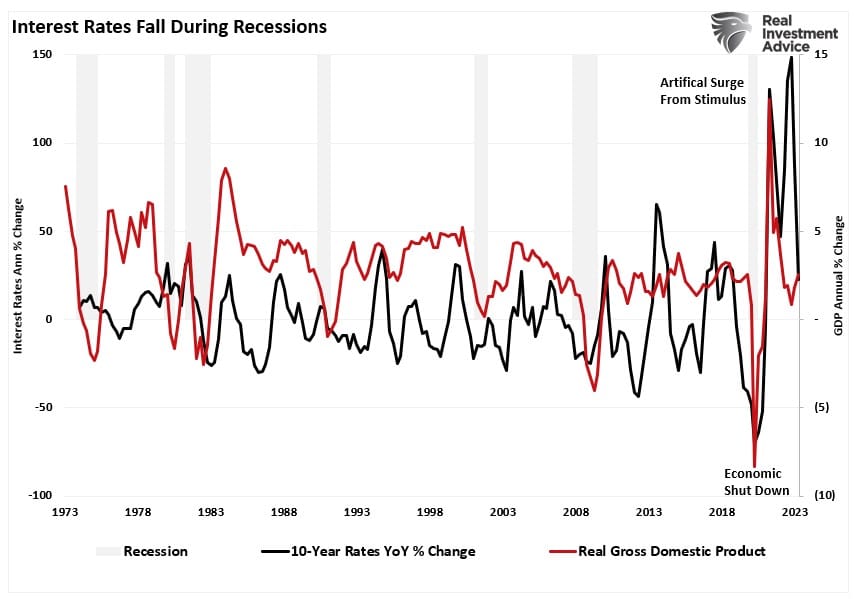
The problem is that investors don’t look ahead and instead focus on what happened in the recent past. In 2022, bonds had the most significant drawdown since 1788 due to the massive surge of economic growth and inflation caused by more than $5 Trillion in Federal interventions. Investors now believe that period was a naturally occurring phenomenon of more robust economic growth suggesting higher rates are coming. Such has also supported higher stock prices and hopes of improving earnings growth.

However, as monetary liquidity reverses and the lag effect of higher interest rates collides with economic realities, the risk of a recession indeed remains prevalent. But, even if the economy does avoid a recession and only slows down, with stocks overvalued and Government bonds deeply undervalued, there is an opportunity for those who can look ahead rather than behind.

Why Government Bonds Are Undervalued
The chart below shows a VERY long view of interest rates in the U.S. since 1854.
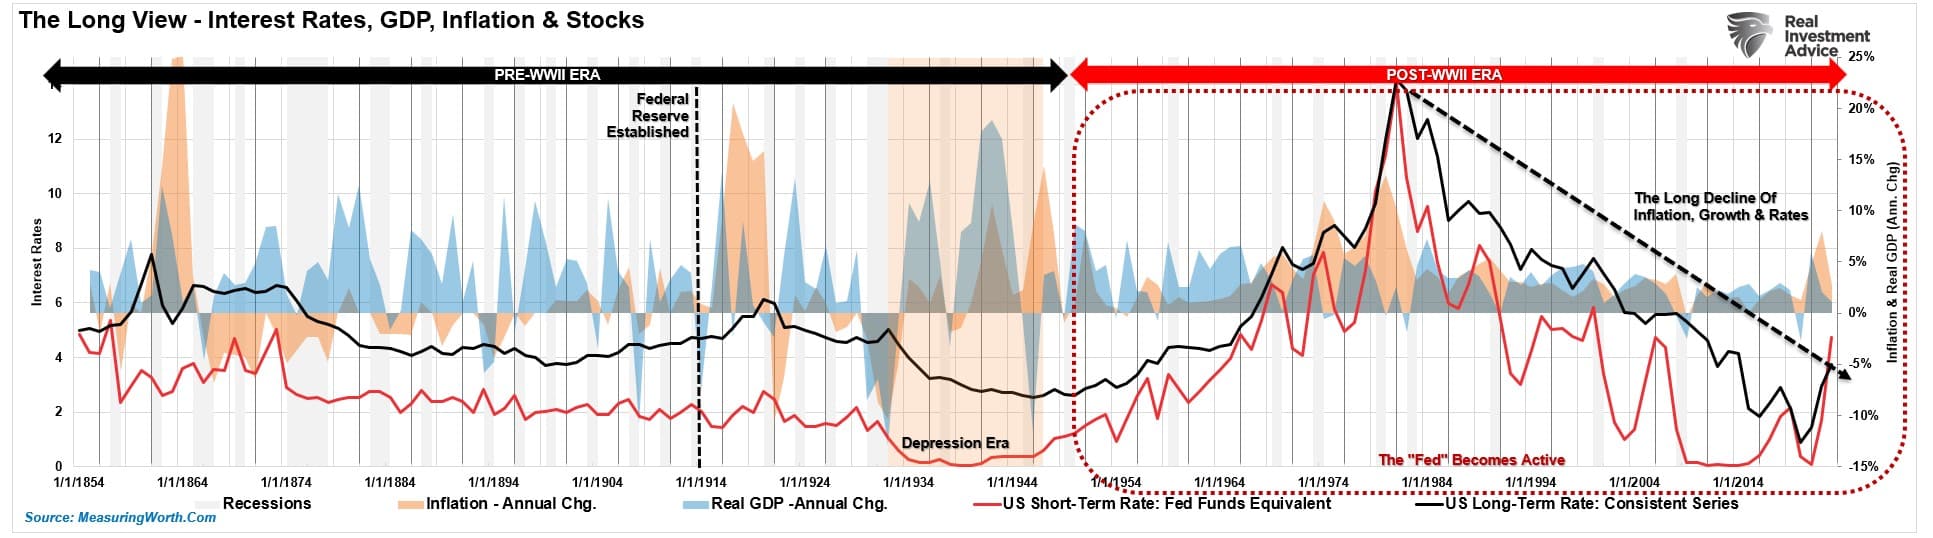
As noted, interest rates are a function of the general economic growth and inflation trend. With more robust growth and higher inflation rates, lenders can charge higher rates to borrowers.
Unlike stocks, bonds have a finite value. At maturity, the lender receives its principal and final interest payment. Therefore, bond buyers know the price they pay today for the return they will get tomorrow. Unlike an equity buyer taking on “investment risk,” a bond buyer is “loaning” money to another entity for a specific period. Therefore, the “interest rate” takes into account several substantial “risks:”
- Default risk
- Rate risk
- Inflation risk
- Opportunity risk
- Economic growth risk
Since the future return of any bond, on the date of purchase, is calculable to 1/100th of a cent, a bond buyer will not pay a price that yields a negative return in the future. (This assumes a holding period until maturity. One might purchase a negative yield on a trading basis if expectations are benchmark rates will decline further.)
As noted, since bonds are loans to borrowers, a bond’s interest rate is tied to the prevailing rate environment at the time of issuance. (For this discussion, we use the 10-year Treasury rate, often called the “risk-free” rate.)
However, with existing bonds traded on secondary markets, the price is determined by the difference between the coupon rate and prevailing rates for similar obligations. The benchmark rate acts as the baseline.
A Very Basic Example
Let’s review an example.
Bond A:
- Current benchmark interest rates = 5%
- A $1000 bond gets issued at 100.00 (par) with a 5% coupon with a 12-month maturity.
- At the end of 12 months, Bond A matures. $1000 gets returned to the lender with $50 in interest, equating to a 5% yield.
For the person who loaned the money, the 5% coupon for 12 months is sufficient to offset various market and economic risks.
Now, let’s assume the benchmark interest rate falls to 4%.
- What is the “fair value” of Bond A in a 4% rate environment?
- Since the fixed coupon is 5%, the price must change and adjust the “yield at maturity.”
- In this case, the price of Bond A would rise from $100 to $101.
- At maturity, the principal value of $1000 and $50 in interest are returned to the holder.
- However, if the bond was sold at $1010 ($1000 x 101%), there is a loss of $10 in value ($1010 – $1000) at maturity. Such equates to a net return of $1000 +($50 in interest – $10 loss in principal = $40) = $1040 or a 4% yield.
Since rates are generally tied to a primary benchmark, for bonds to become overvalued, the benchmark rate would have to become detached from the underlying metrics that drive the level of borrowing costs.
That is not the case today.
Rates Are A Function Of The Economy
As noted above, rates are a function of economic activity, inflation, and wages. The relationship shown above should be unsurprising. The “rate” for lending money must account for economic growth and inflation expectations. Therefore, rates and expectations must adjust for the potential future impact on the current value of invested capital.
- Equity investors expect that as economic growth and inflationary pressures increase, the value of invested capital will increase to compensate for higher costs.
- Bond investors have a fixed rate of return. Therefore, the fixed return rate is tied to forward expectations. Otherwise, capital is damaged due to inflation and lost opportunity costs.
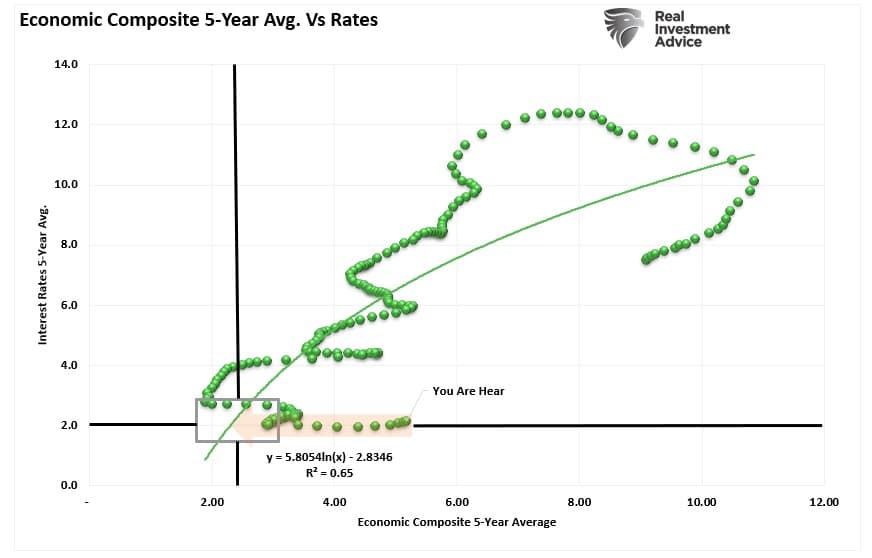
The correlation between rates and the economic composite suggests expectations of sustained economic expansion and rising inflation are overly optimistic. At current rates, economic growth will likely return to sub-2% by 2024.
The jump in economic growth in 2021 has several problems attached to it.
- It was a recovery from deeply depressed levels in 2020 rather than an expansion of growth to absorb population increases.
- The recovery reflected an artificial stimulus with a minimal effective window before depletion. As such, it has a negative multiplier effect economically.
- Lastly, given that business owners understand the “bump” of activity is temporary, they are not willing to make long-term investment commitments that would require a capital cost above long-term growth rates.
Such is why economic growth is slowing as the “monetary surge” reverses.
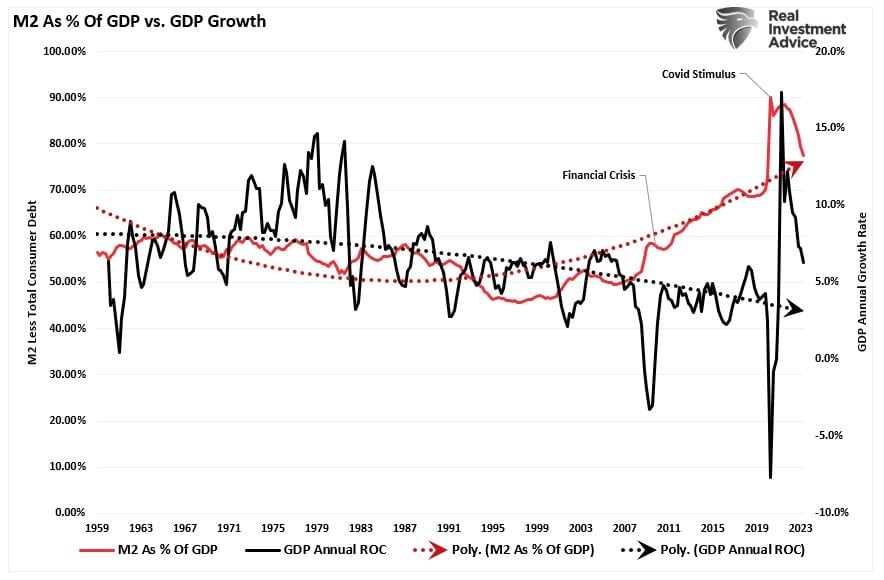
It is worth noting that since the “Financial Crisis,” monetary supply (M2) as a percentage of GDP has continued to increase despite a slowing economic growth rate. Such is because government spending has a negative multiplier concerning economic growth. As the massive surge in M2 reverses, economic growth rates will also decline. However, the correlation becomes more apparent if we smooth the data using a 5-year average of both the economic composite and rates.
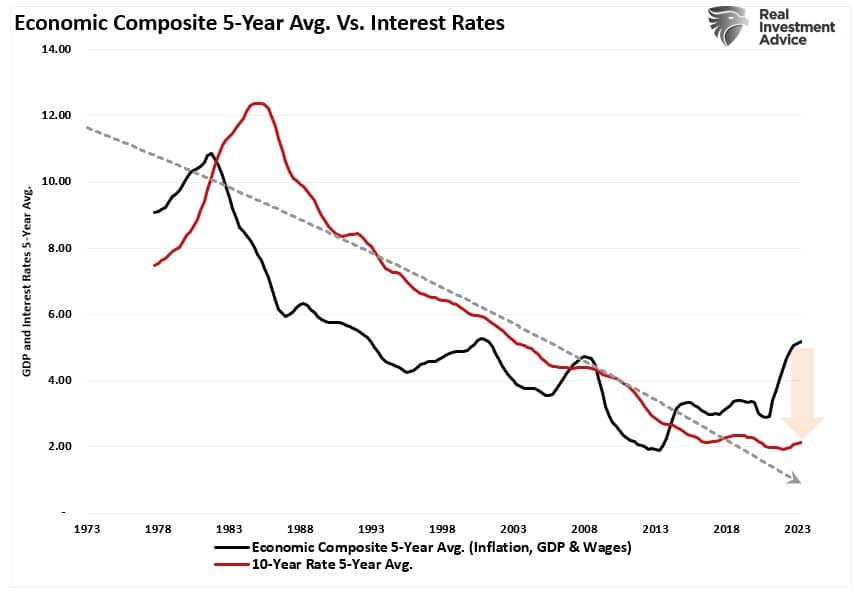
The current 5-year average suggests that rates and growth will continue to run along much lower levels. Such does not foster increased capital investment, substantial employment above population growth rates, or increased labor-force participation rates. With a 65% correlation, economists and analysts will likely be disappointed as growth slows and interest rates fall.

Buy Bonds For Capital Appreciation & Protection
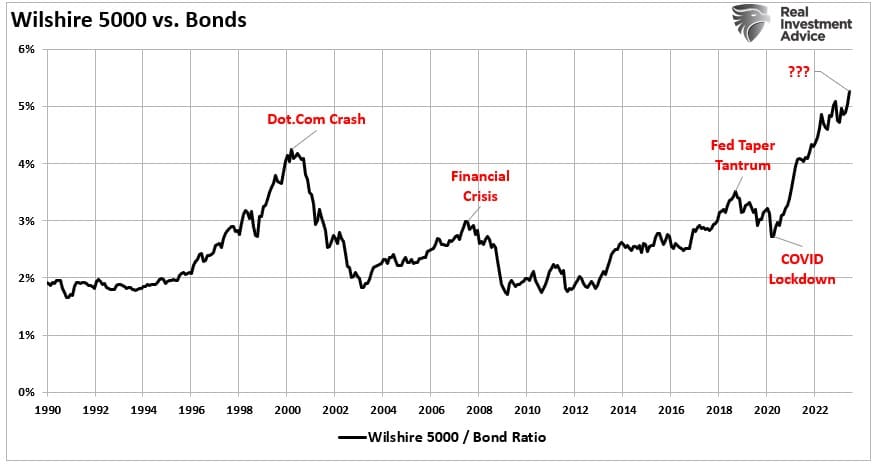
Understanding the dynamics between inflation, the economy, and interest rates is critical to understanding why now is likely the opportunity to increase government bonds in portfolios for both income and capital appreciation. Most people view bonds only for income. However, with stocks overvalued relative to bonds, as shown by the ratio below, there is another aspect of bonds; capital appreciation.
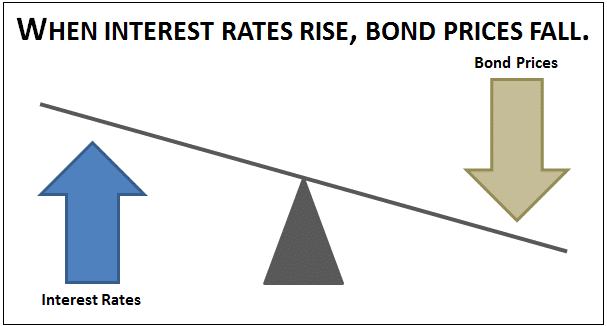
There is an inverse relationship between bond prices and interest rates. When interest rates are low and rising, bond prices fall. However, when they are high and falling, bond prices rise.
In the portfolio management process, there are three reasons to buy bonds:
- Capital appreciation – the same reason we buy equities
- Total return – interest income plus capital appreciation
- Risk reduction – lower volatility assets to offset higher volatility assets (equities.)
If you consider government bonds as an “asset class,” the analysis changes from an income strategy to a capital appreciation opportunity.
Historically, following aggressive rate increases, such equated with a financial event or recession. Such is not surprising given the impact of rates on an economy with high debt levels.

Historically, bonds are the beneficiary of a “risk-off” rotation during market downturns. Such not only provides a return but reduces overall portfolio volatility.
Conclusion
The hope is that the Fed will again start dropping interest rates. However, as we have noted previously, the only reason for the Fed to cut rates would be to offset the risk of an economic recession or a financially related event. Should such occur, the “risk off” rotation would cause a drop in rates toward the pandemic-era lows. Such a decline would imply an increase in bond prices of approximately 50%.
In other words, the most hated asset class of 2022 may perform much better than stocks when a recession occurs.
So, yes, individuals have a significant value opportunity to buy government bonds today.

