“Signs” was a song by the Five Man Electrical Band in 1970 about the hippie movement. The song came to mind as I was looking at the economic data recently. There are “Signs, Signs, Everywhere A Sign” of a recession, but no recession yet.
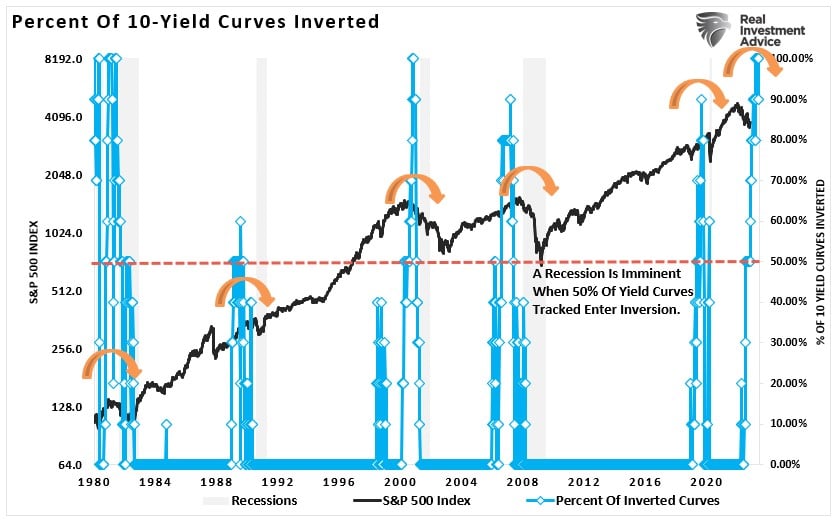
For example, as of the end of May, 100% of the 10-economically sensitive yield curves we track are inverted. Historically, such a steep and consistent inversion of various yield curves has always preceded recessionary outcomes.
For better context, here are the 10-yield curves put onto one chart. There are two crucial points in the chart below. Firstly, whenever all ten were inverted, as noted by the square boxes, such inversions preceded a recessionary economy. Secondly, the current inversion is the deepest since the late 70s.
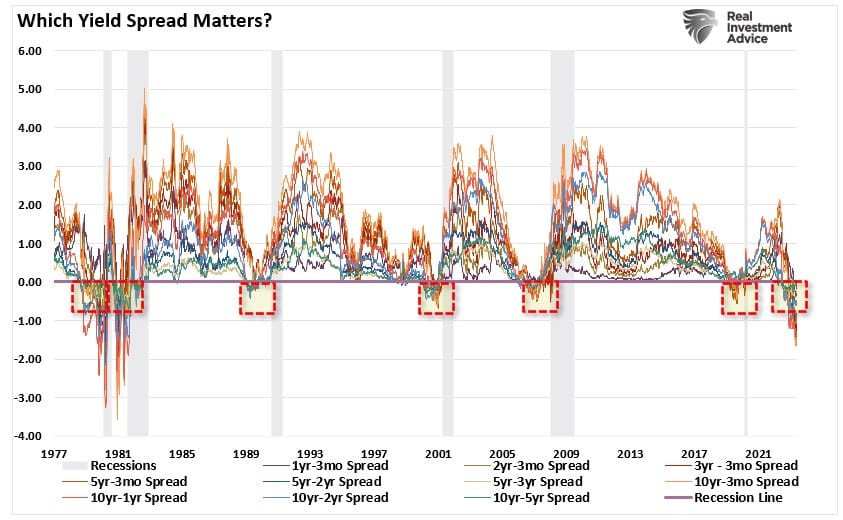
While there are near recessionary periods, such as in 2011 during the shutdown of Japan or 2015 during concerns over Brexit, yield curves did not invert. So, while it is believed the economy can avoid a recession this time, the number and magnitude of the inversions suggest such an optimistic outcome is unlikely.
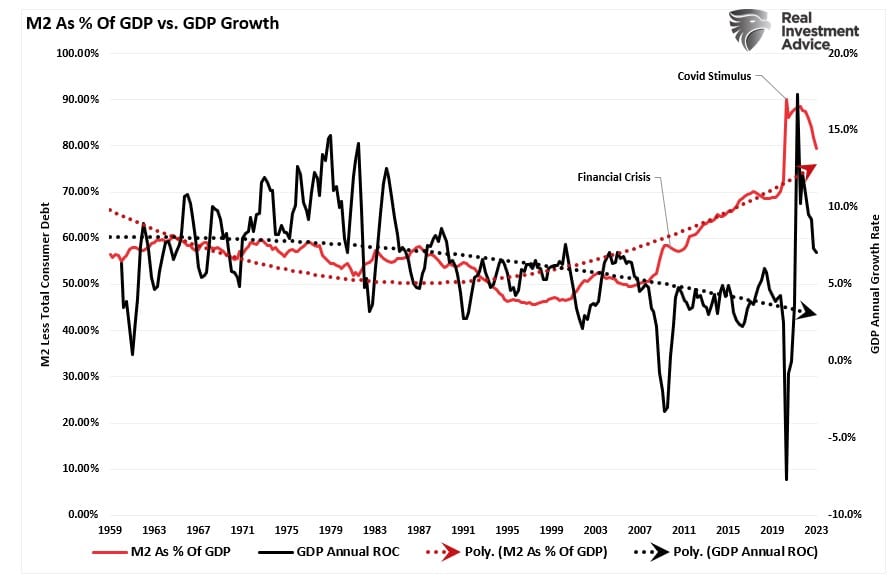
Could this time be different? Absolutely. Anything is always possible, and there are undoubtedly monetary supports today that were not available in the past. As discussed previously, the monetary liquidity in the economy still runs very high as a percentage of GDP.
However, more signs than yield curve inversions suggest a recession is likely.

More Signs
As we discussed recently, there have been instances where economists expected a recession, yet none occurred.
“In 2011, the world faced a manufacturing shutdown as Japan was shuttered by an undersea earthquake creating a tsunami. The flooding of Japan also sparked a nuclear meltdown. Simultaneously, the U.S. was entrenched in a debt ceiling debate, a debt downgrade, and threats of default. Given the combination of events, the economy’s manufacturing sector contracted, convincing many of an impending recession.
However, as shown, that recession never happened.”
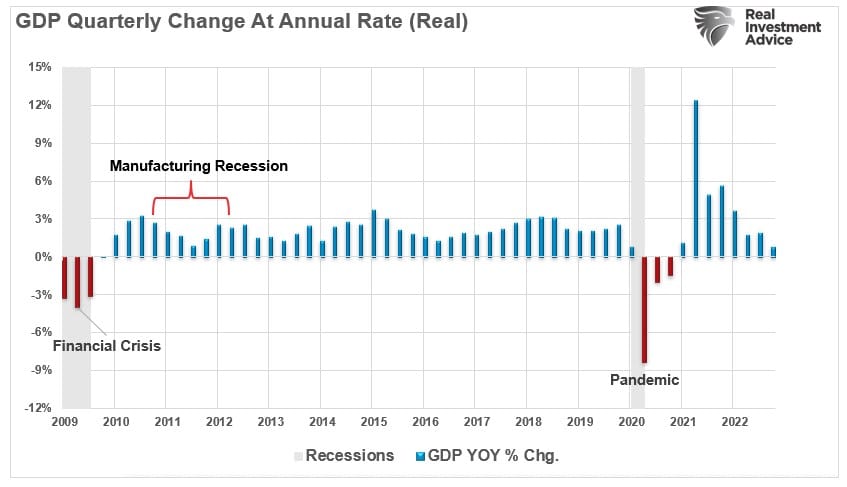
The economy avoided a recession because the service sector of the U.S. economy kept the economy afloat. In the past, manufacturing was a significant component of economic activity. Today, services comprise nearly 80% of each dollar spent.

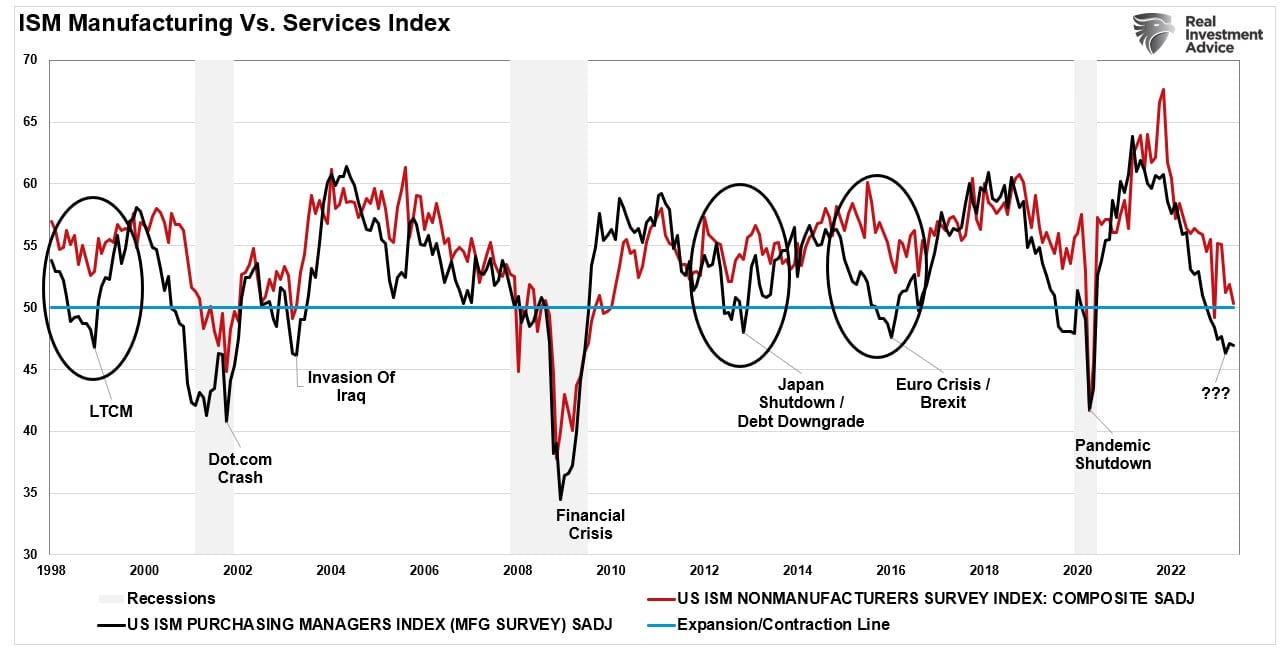
Such is a crucial point. Services have a much smaller economic multiplier than manufacturing, which is why we have slower economic growth rates. Still, it is nonetheless the majority of activity. So goes services, and so goes the economy. The chart below shows both ISM indices. As shown, in 1998, 2011, and 2015 even though manufacturing was in contractionary territory, services were not. In all three cases, an economic recession was avoided.

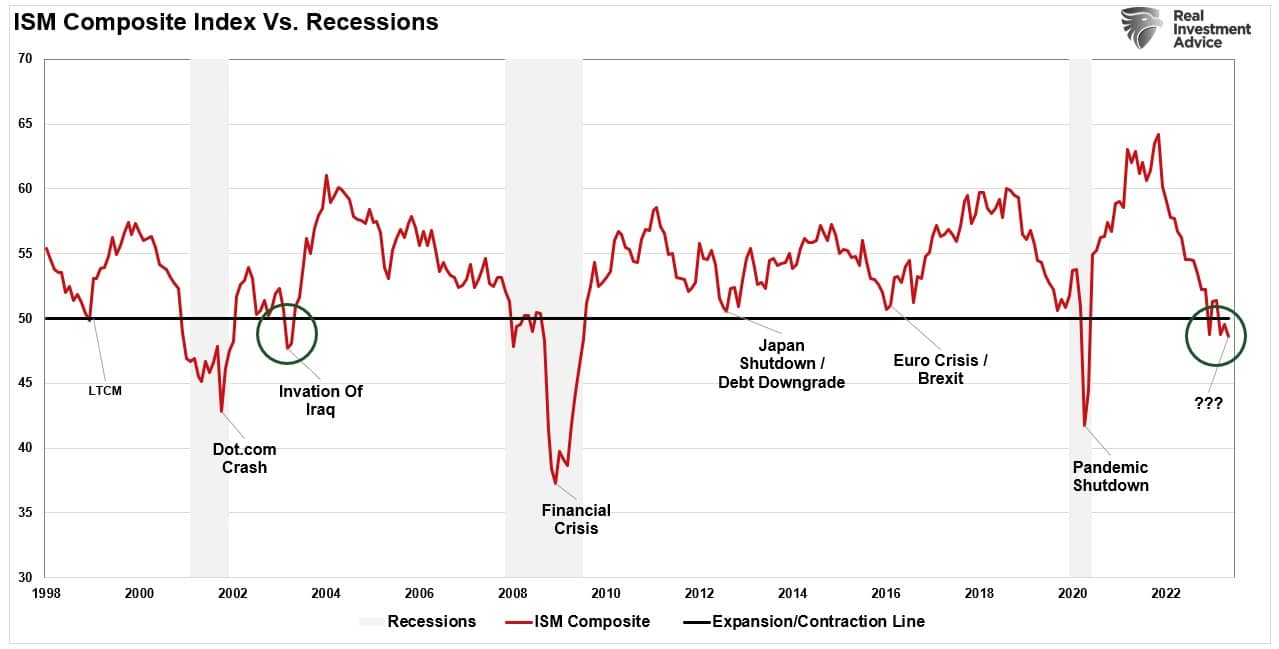
Creating A Composite
We can create a composite indicator by averaging the two indices, clearly showing the correlation to economic recessions. A recession did not occur in 1998, 2011, and 2015 as the composite index never fell into contraction territory. That indicator has fallen into contraction territory, warning of a recession.
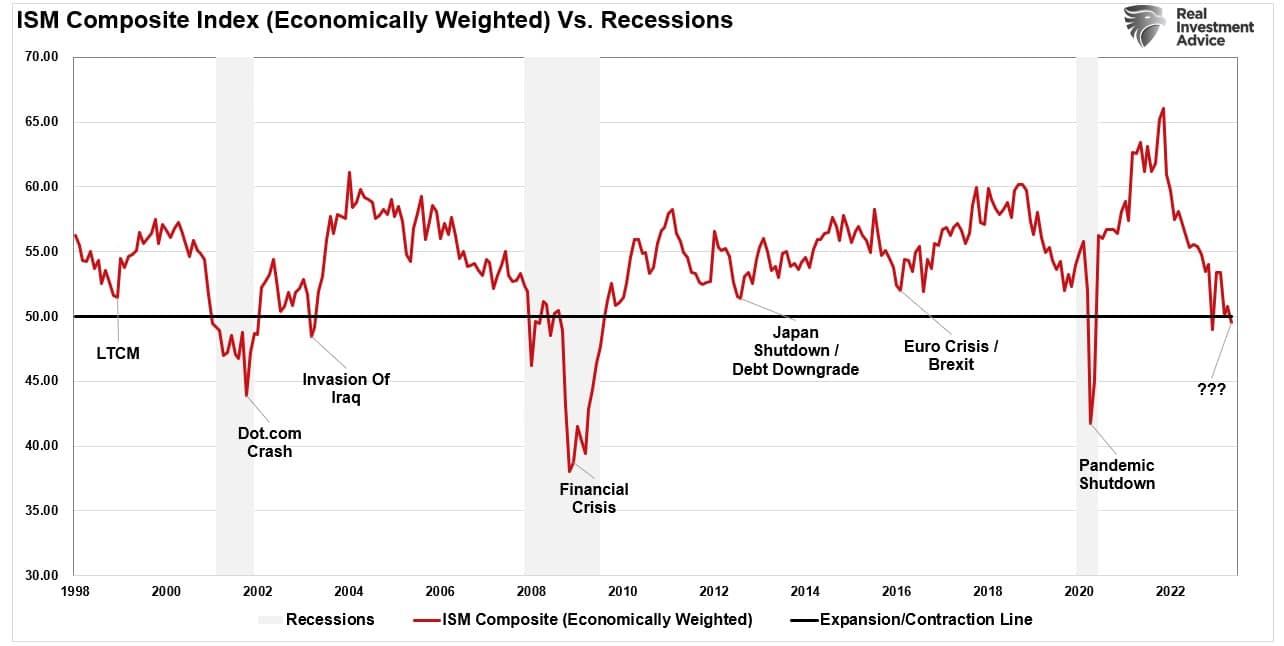
However, if we weight the composite index to economic levels (77% services, 23% manufacturing), the index is only at the cusp of a recession warning. If the index services index weakens in the June report, the weighted composite will be in recession territory.
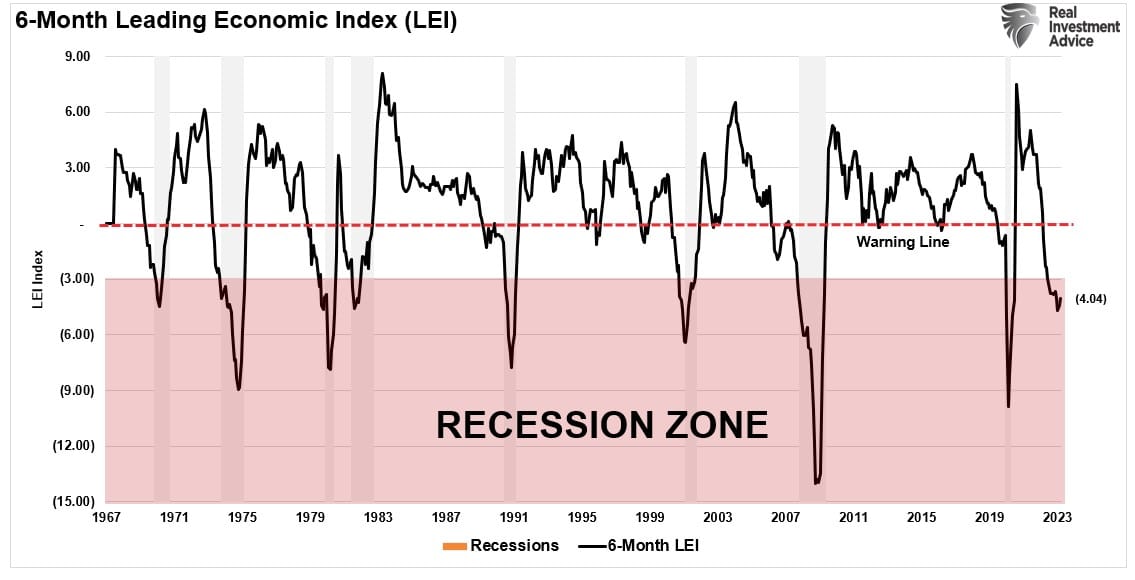
The 6-month rate of change (ROC) in the Conference Boards Leading Economic Index (LEI) further supports that recession warning from the ISM composite index. Since 1967, a recession has occurred when the 6-month ROC fell below -3%. This indicator has the most infallible record of all the recession indicators we track.
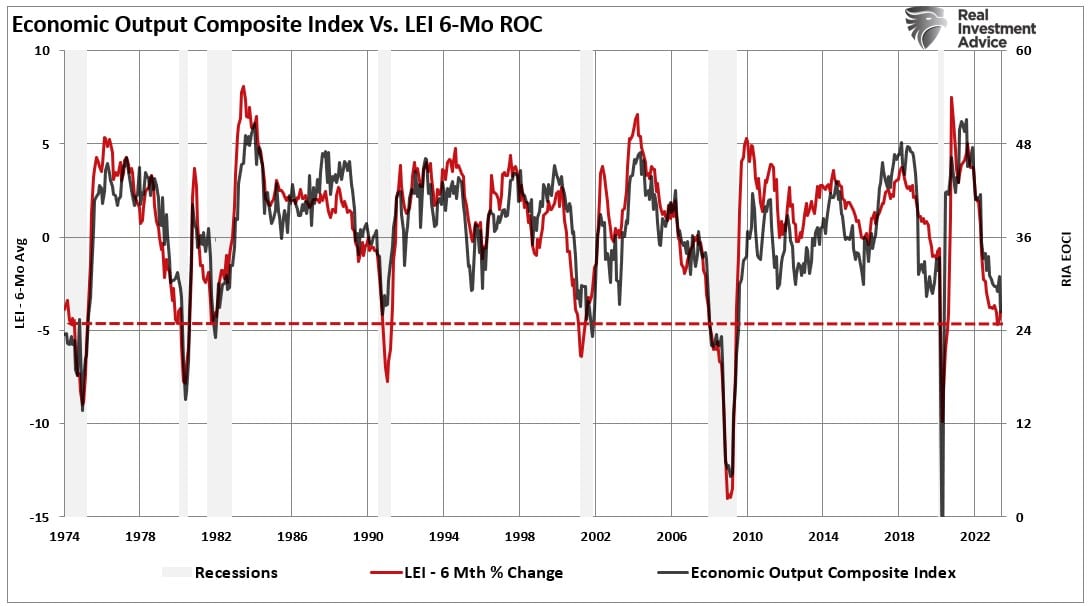
Furthermore, our Economic Output Composite Index (EOCI), which comprises more than 100 different leading, lagging, services, and manufacturing data points, also warns of a recession. Like the LEI, the index has a strong track record of predicting recessions.
Given the weight of the evidence, a recession seems assured. Yet employment remains robust and economic activity, in terms of GDP, remains in positive territory. This has led many analysts and economists to hope that “this time is different” and that a recession may be avoided entirely.

May Take Longer Than Expected
It is certainly possible that all of the tell-tale signs of economic recession may be wrong this time. There is another possibility. Given the massive increase in activity due to a shuttered economy and massive fiscal stimulus, the reversion may take longer than normal.
As noted previously, we would already be in a recession if we had entered this current period at previous growth rates below 4%. The difference is the contraction began from a peak in nominal GDP of nearly 12%.

Therefore, while the economy has corrected sharply from the stimulus-induced economic surge, it has not yet turned negative. Notably, a negative print in nominal GDP is not required for an official recession, as in 2000-2001. However, a further contraction is required before unemployment rises significantly, triggering an official recession designation. That process will likely take longer, suggesting an “official recession” may not occur until next year.
Investor Implications
As noted above, the massive surge in monetary stimulus (as a percentage of GDP) remains highly elevated, which gives the illusion the economy is more robust than it likely is. As the lag effect of monetary tightening takes hold later this year, the reversion in economic strength will probably surprise most economists.
For investors, the implications of reversing monetary stimulus on prices are not bullish. As shown, the contraction in liquidity, measured by subtracting GDP from M2, correlates to changes in asset prices. Given there is significantly more reversion in monetary stimulus to come, such suggests that lower asset prices will likely follow. However, a reversal of liquidity would support the rise in asset prices.

Sure, this “time could be different.” The problem is that historically such has not been the case. Therefore, while we must weigh the possibility that analysts are correct in their more optimistic predictions, the probabilities still lie with the indicators.
However, such is why, as investors, we must remain nimble in our investment approach and trade the market for what we have rather than what we wish it to be.

