As we have been discussing, this past week, the S&P 500 index set an all-time high. Importantly, the breakout to all-time highs confirms the 35% decline in March was only a correction and not a bear market. The implications are important as the change of definition suggests a bear market still lurks for the full-market cycle to complete.
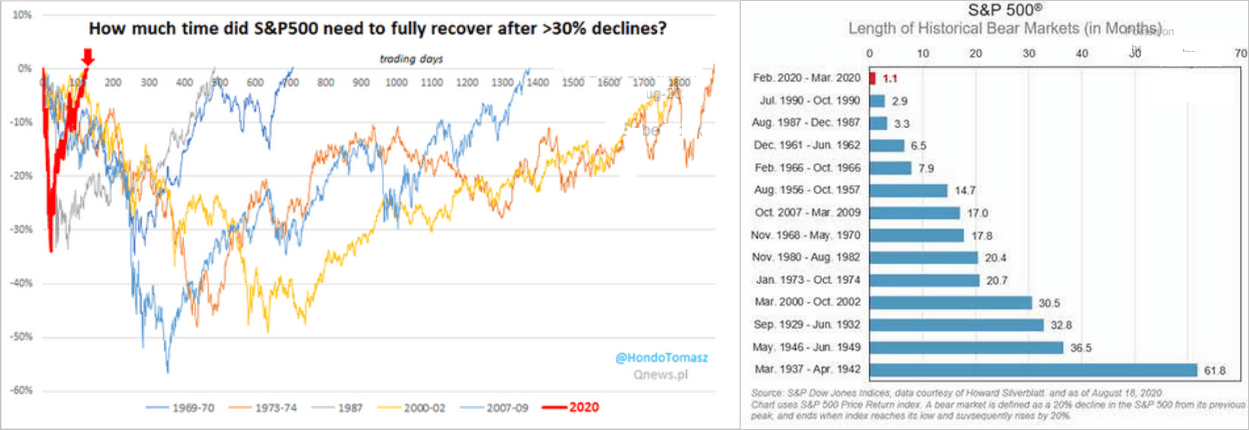
“The S&P 500 set a new record high this week for the first time since Feb. 19, surging an eye-popping 51% from its March 23 closing low of 2,237 to a closing high of 3,389 on Tuesday. This represents the shortest bear market and third fastest bear-market recovery ever.” – Sam Ro
To understand why March was not a “bear market,” we have to break the analysis into several key components:
- What defines a bull and bear market?
- What exactly is a “full-market cycle?”
- How deep will a “bear market” contract?
Bear Market Definition Is Arbitrary
Let me start with an insightful note from Sentiment Trader:
“The S&P 500 finally did what it’s been trying to do for days now, and crept to a new high.
This ended its shortest bear market in history. Using the completely arbitrary definition of a 20% decline from a multi-year high, it has taken the index only 110 days to cycle to a fresh high. That’s several months faster than the other fastest recoveries in 1967 and 1982.”
Such was a point I discussed on May 20th in “Just A Big Correction:”
“Price is nothing more than a reflection of the ‘psychology’ of market participants. A potential mistake in evaluating ‘bull’ or ‘bear’ markets is using a ‘20% advance or decline’ to distinguish between them.”
As Sentiment Trader notes, the 20% rule is arbitrary. The question is, after a decade-long bull market, which stretched prices to extremes above long-term trends, is the measure still valid?
What Defines A Bear Market
To answer that question, let’s clarify the premise.
- A bull market is when the price of the market is trending higher over a long-term period.
- A bear market is when the previous advance breaks, and prices begin to trend lower.
The chart below provides a visual of the distinction. When you look at price “trends,” the difference becomes both apparent and useful.
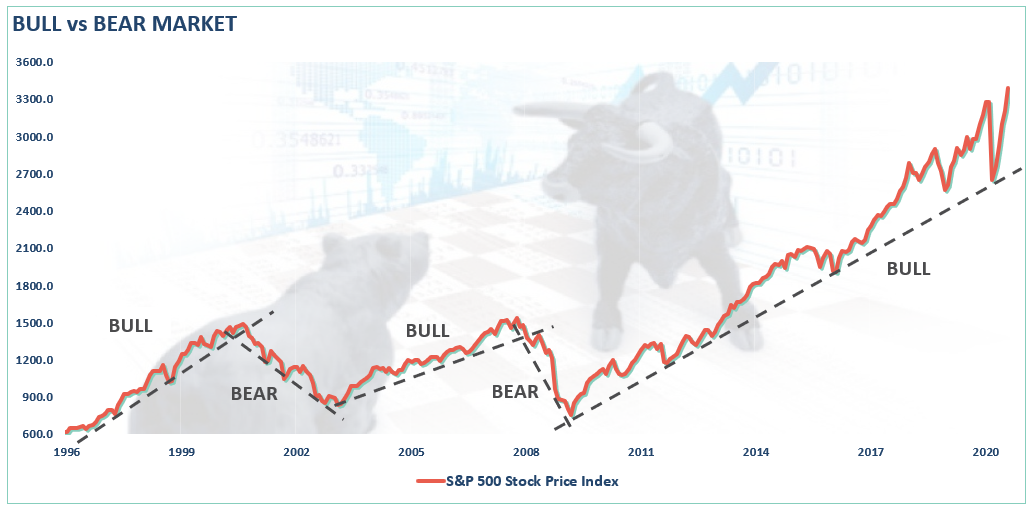
The distinction is essential.
- “Corrections” generally occur over short time frames, do not break the prevailing trend in prices, and are quickly resolved by markets reversing to new highs.
- “Bear Markets” tend to be long-term affairs where prices grind sideways or lower over several months as valuations are reverted.
Using monthly closing data, the “correction” in March was unusually swift but did not break the long-term bullish trend. Such suggests the bull market that began in 2009 is still intact as long as the monthly trend line holds.
I discussed this concept in the video below.

What Is A Full-Market Cycle
One of the most important concepts to grasp is that of the “full market cycle.”
It is not surprising after an 11-year, liquidity fueled bull market, investors have begun to make the assumption the current trend will last indefinitely. However, throughout history, bull market cycles only make up on one-half of the “full market” cycle. During every “bull market” cycle, the market builds up excesses, which must ultimately revert through a market correction. In other words, as Sir Issac Newton discovered:
“What goes up, must come down.”
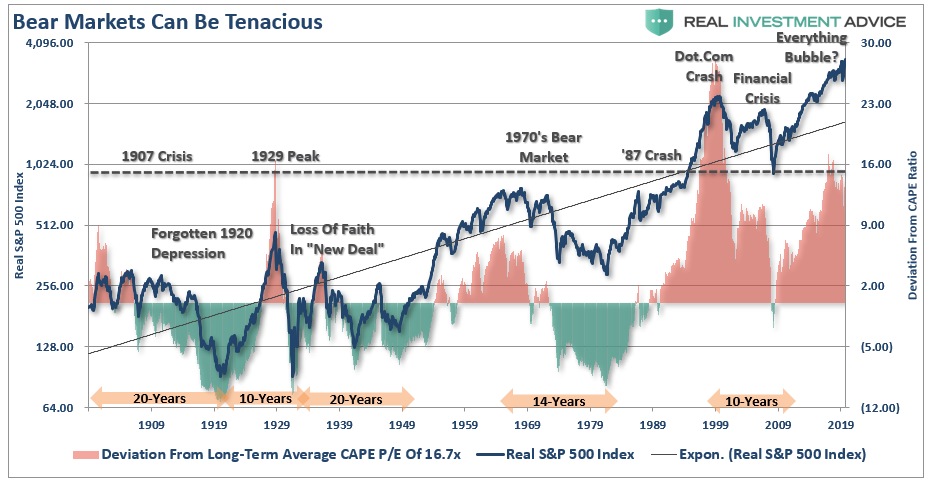
The chart below shows the full market cycles over time. Since the current “full market” cycle is not yet complete, we can only guess at the ending valuation level.
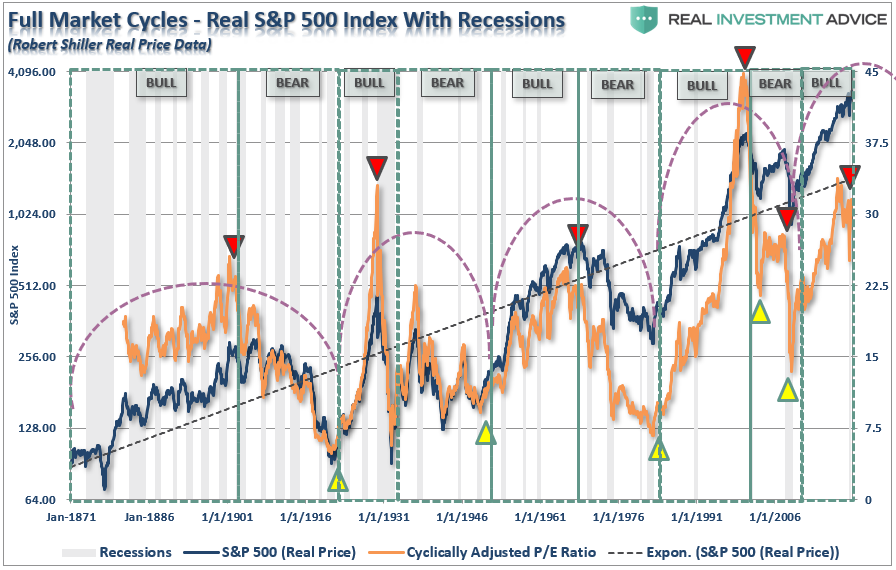
Over the last two bear market cycles, ending valuations were higher than the previous “bear market cycle” lows. Given changes to market environments over time, we can reasonably assume the next valuation low will be closer to the long-term CAPE average of 16.7x earnings. However, given markets are currently pushing 30x trailing earnings, completion of the mean reversion process will not be mild.
With the current trailing valuations at one of the greatest deviations from the long-term average, historically, “reversions to the mean” are tenacious.

How Big Of A Decline To Trigger A Bear Market
So, if a 35% correction in March wasn’t big enough to be considered a “bear market,” how deep of a decline will be needed?
There are really two issues with that question.
- How deep of a correction is needed to violate the bullish trendline from the 2009 lows, and
- Where will the bottom of such a bear market likely be to reset valuations?
If we put corrections into a bit of perspective, it becomes easier to visualize that damage that could, and most likely will, eventually occur.
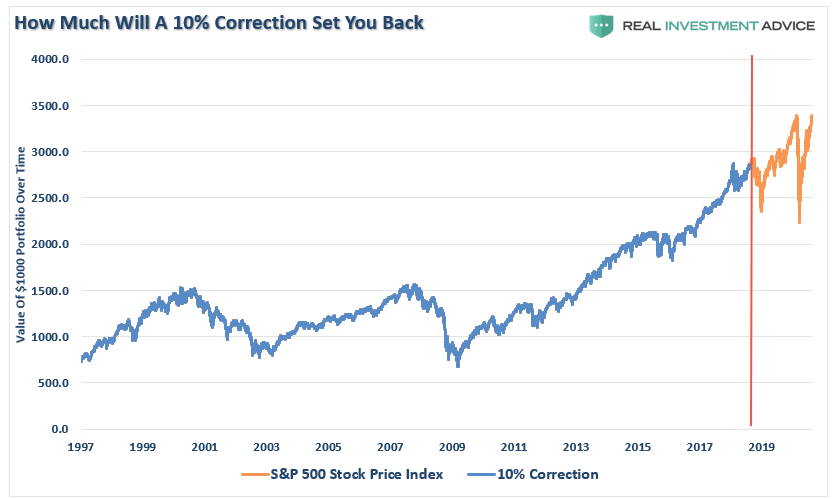
10% Correction
A correction of 10% is entirely reasonable for a market in any given year. However, investors have become so complacent in the market, a 10% correction will “feel” much worse. However, such a decline would NOT trigger a violation of the bullish trend and would only set the market back to October 2019.
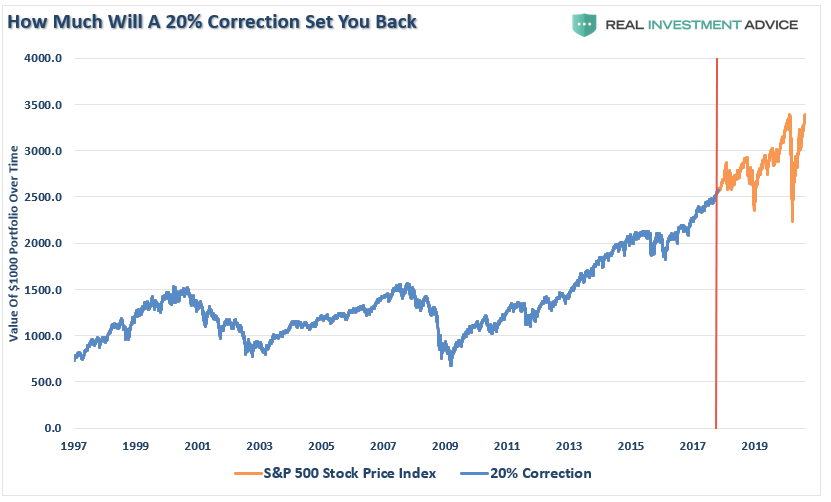
20% Correction
A 20% correction from the recent highs is a bit more serious. While not as serious as the drop in March 2020, it will be emotionally distressing nonetheless. Try and remember how you felt during the March decline. This is where investors begin to make emotionally driven investment mistakes.
Currently, a 20% decline would NOT trigger a “bear market.” However, it would reset your portfolio back to where it was in December 2017, wiping out all the gains of the past two-years. While not the end of the world, your retirement is now set back by almost 4-years as you will have to make up the 30% gain from 2019 plus two-more years of lost growth.
30% Correction
Given the current deviation of the market from the 2009 bullish trendline, it will require nearly a 30% correction to break the previous trend. A decline of this magnitude takes you back to the beginning of 2017. While losing just 3-years of growth may not seem that bad, assuming you need 6% a year to reach your retirement goal, you will need almost 9-years to recover. (Remember, it takes 42.9% to rescue the 30% loss, plus you have to make up the 6% annual gains you needed, but didn’t accrue, during each year of recovering the previous damage.)
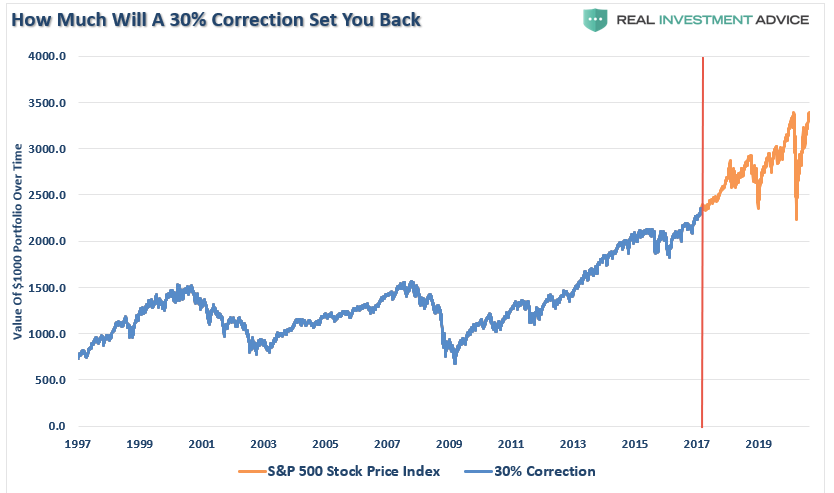
However, a 30% correction has not yet reset valuations back to levels which typically denote the end of a “bear market cycle.” Assuming a 30% decline from current levels would value the market at roughly 26x earnings. That is still a good bit from the 15x level we discussed.

40% Correction
Okay, this is starting to get ugly. A 40% decline takes the market back to 2014 levels and has now wiped out 6-years of your gains. While a 40% decline requires a 66.7% recovery to breakeven (10 years at 6%,) the lost accrual years are going to make it very difficult to meet retirement goals.
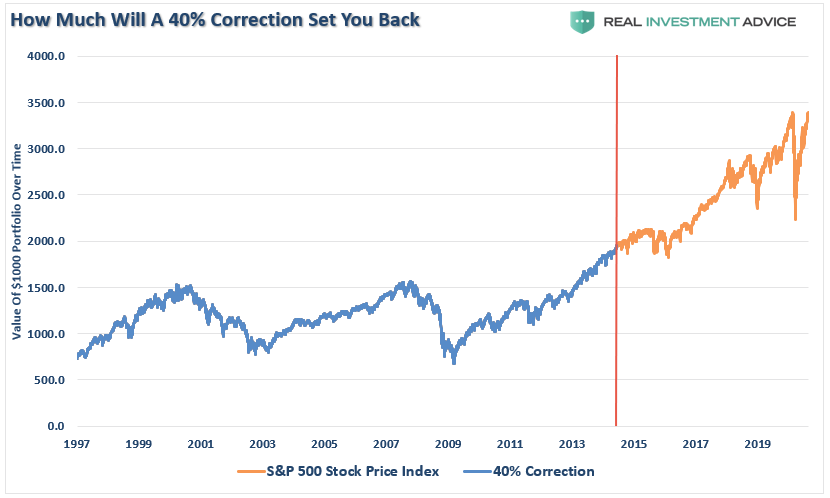
At this juncture, valuations have declined to 21x. The expected bear market “mean reversion” is now in full swing.
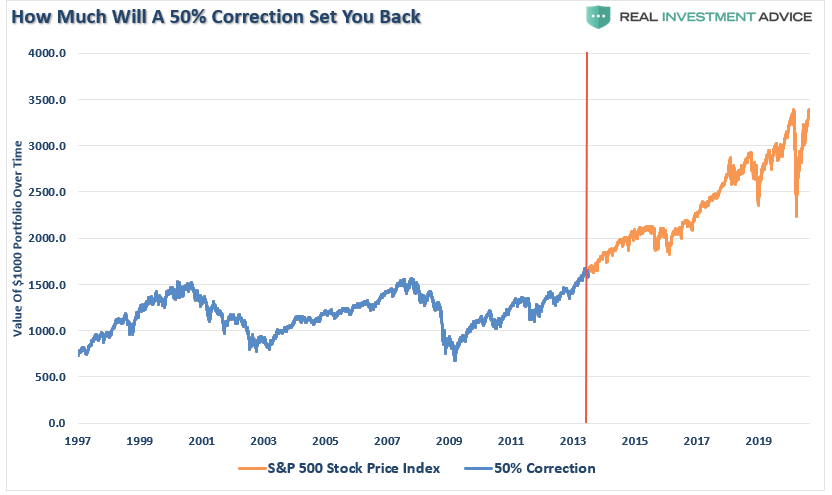
50% Correction
I know, I know…this can’t happen. (It just happened twice the century already.)
A drop of this magnitude will reset the market back to the market highs of 2000 and 2007. For individuals who were close to retirement in 2000, their portfolio, on an inflation-adjusted basis, will have been completely reset.
At this point, retiring is no longer an option for most. However, the good news, if you want to call it that, is the market is now trading at 18x earnings and beginning to align with expected bear market cycle lows.
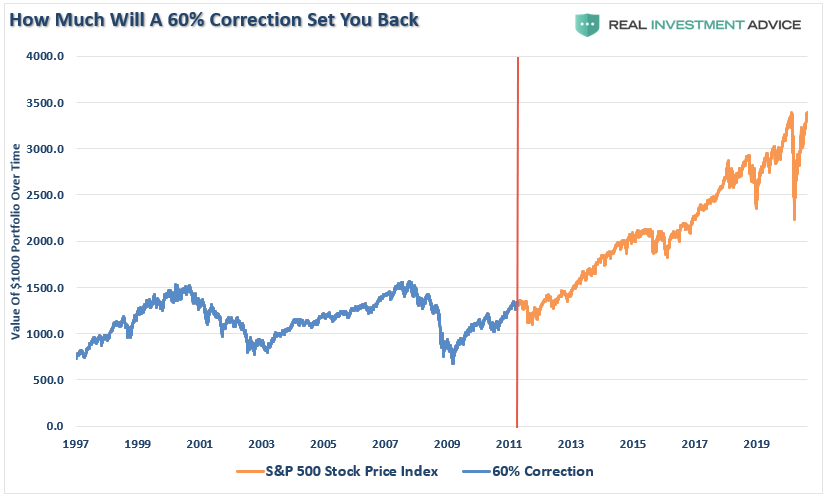
60% Correction
Given the amount of debt, leverage, and overvaluation in the markets currently, a 60% correction is not entirely out of the question. Corrections of such a magnitude would reset portfolios back to 1999 levels. The devastation is more than investors can currently imagine, and retirement goals would disappear entirely.
However, market valuations have now retraced back to 15x earnings. Such a level is consistent with the beginning of a long-term secular bull market cycle where forward returns rise significantly for investors.

Lost And Found
There is a sizable contingent of investors, and advisors, today who have never been through a real bear market. (No, March was not it) After a decade long bull-market cycle, fueled by Central Bank liquidity, it is understandable why mainstream analysis believed the markets could only go higher. What was always a concern to us was the rather cavalier attitude they took about the risk.
“Sure, a correction will eventually come, but that is just part of the deal.”
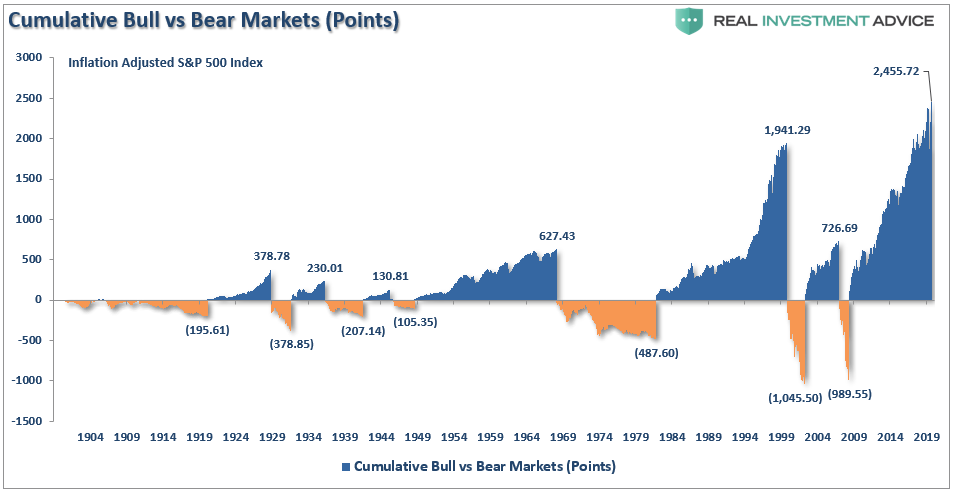
What gets lost during bull cycles, and is always found in the most brutal of fashions, is the devastation caused to financial wealth during a “mean reversion” process.
Such is the story told by the S&P 500 inflation-adjusted total return index. The chart shows all of the measurement lines for all the previous bull and bear markets. It also denotes the number of years required to get back to even.
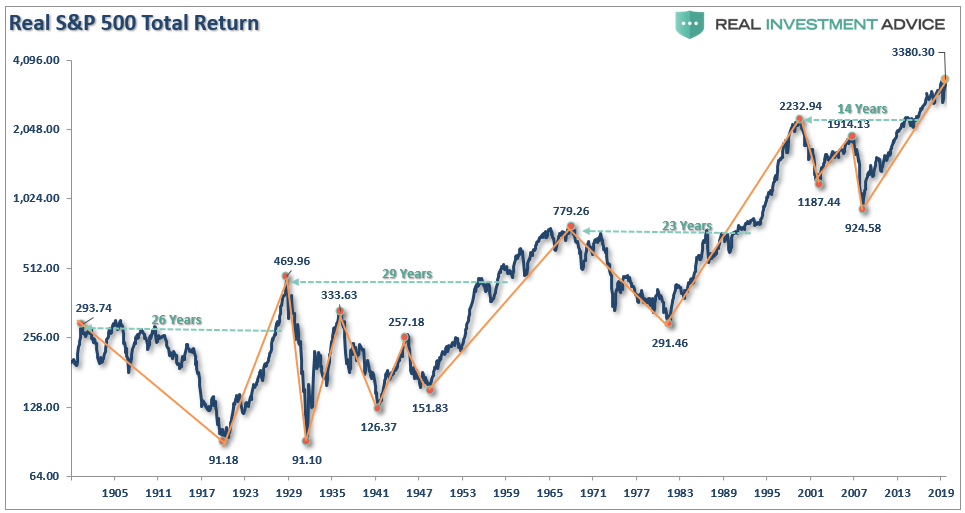
What you should notice is that in many cases, bear markets wiped out substantially all of the previous bull market advances.
Many signs are suggesting the current Wycoff cycle has entered into its fourth, and final stage.
Bear market cycles rarely end in a month. While there is a lot of “hope” the Fed’s flood of liquidity can arrest the market decline, there is still a tremendous amount of economic damage to contend with over the months to come.
In the end, it does not matter IF you are “bullish” or “bearish.” What matters, in terms of achieving long-term investment success, is not necessarily being “right” during the first half of the cycle, but by not being “wrong” during the second half.
None of this will happen, you say?
Maybe? I certainly hope not.
But are you willing to bet your retirement on it?

