Q1 Earnings Season Approaches


Inside This Week’s Bull Bear Report
- Q1 Earnings Season Approaches
- How We Are Trading It
- Research Report –Household Allocations Suggest Caution
- Youtube – Before The Bell
- Market Statistics
- Stock Screens
- Portfolio Trades This Week
5-Straight Up Months
Last week, we noted that this mind-numbingly narrow channel, extremely low volatility, and high complacency remain. As we said then:
“However, as is always the case, at some point, this will reverse itself. What triggers it is unknown, but a good warning sign will be a violation of the 20-DMA. As noted, we suspect such a violation will trip the algorithms into “sell” mode and increase downside price pressures. The problem for investors is that this bullish trend has already lasted much longer than expected and could continue. Therefore, we must maintain our current positioning and remain vigilant for a break of the trend channel to take more aggressive risk reduction actions.
As they say at amusement parks, ‘Make sure your seat belts are fastened securely and enjoy the ride.'”
With March behind us, the market has posted 5-consecutive months of gains. While not entirely uncommon, some interesting data points surround such win streaks from the chart below.
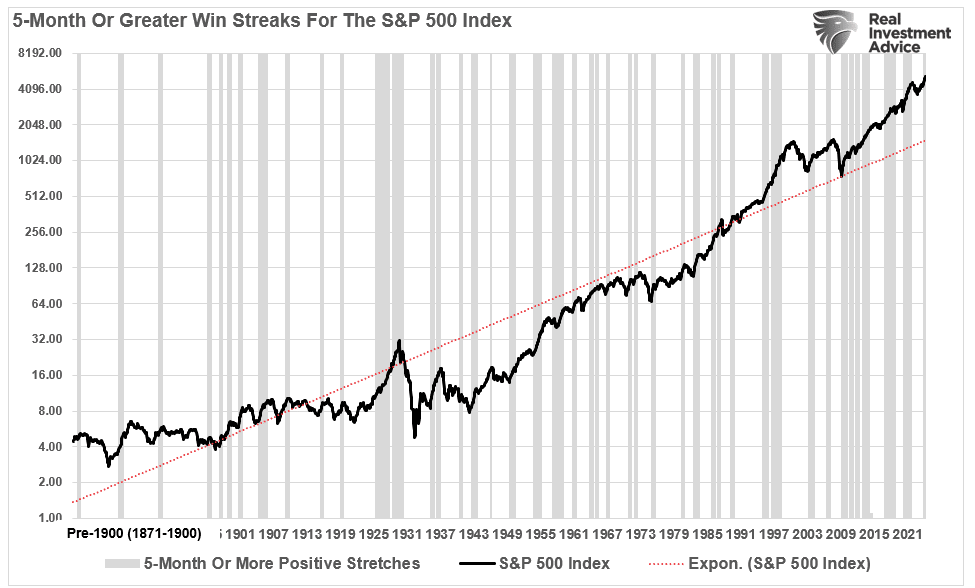
There are several important takeaways from the chart above.
- All periods of consecutive performance eventually end. (While such seems obvious, investors tend to forget during long bullish stretches.)
- Performance streaks tend to cluster as price momentum and bullish psychology expand.
- Given the extremely long period of market history, such long stretches of bullish performance are prevalent following declines.
- Such periods of performance often, but not always, precede fairly decent market corrections or bear markets.
The table below shows all periods with two months or more of consecutive positive returns.
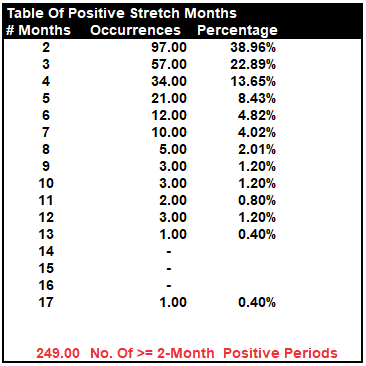
The table shows that nearly 40% of the time, two months of positive performance are followed by at least one month of negative performance. Conversely, three consecutive positive months occur 23% of the time, and only 14% of occurrences stretch to 4-months. 5-month stretches have only occurred 8.5% of the time.
Since 1871, there have only been 21 occurrences of 5-month stretches of positive returns before a negative month appeared. In total, there are just 61 occurrences, or 25%, out of 249 periods where the market ran five months or longer without a correction.
What is essential to take away from the data is that every period of consecutive positive monthly returns eventually ends. Yes, sometimes those endings are very mild. However, sometimes they were not.
In the current bull market, few people are willing to sell, so buyers must keep bidding up prices to attract a seller to make a transaction. As long as this remains the case and exuberance exceeds logic, buyers will continue to pay higher prices to get into the positions they want to own.
Such is the very definition of the “greater fool” theory.
However, the bulls remain in charge as Q1 earnings season approaches.
Need Help With Your Investing Strategy?
Are you looking for complete financial, insurance, and estate planning? Need a risk-managed portfolio management strategy to grow and protect your savings? Whatever your needs are, we are here to help.

Q1 Earnings Season Approaches
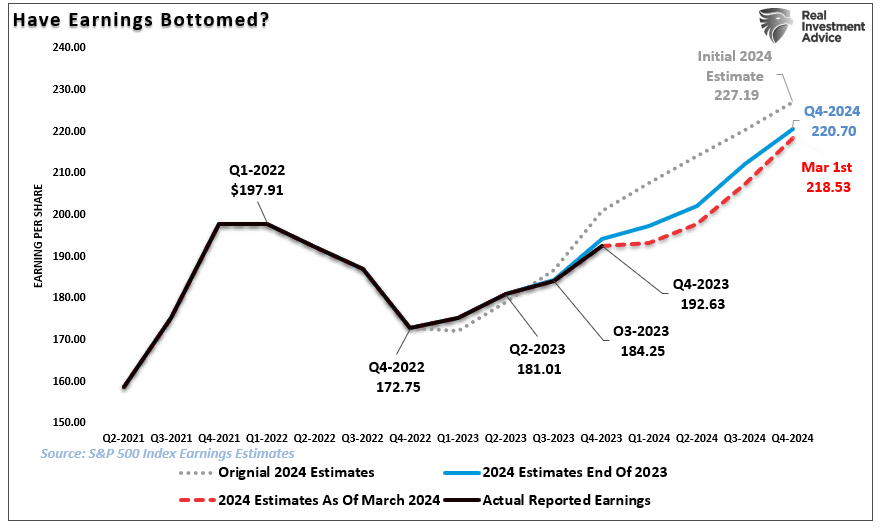
As we prepare for Q1 earnings season to commence, stocks have rallied sharply over the last five months. As we have discussed previously, it will be unsurprising that we will see a high percentage of companies “beat” Wall Street estimates. Of course, the high beat rate is always the case due to the sharp downward revisions in analysts’ estimates as the reporting period begins. The chart below shows the changes for the Q1 earnings period from when analysts provided their first estimates.
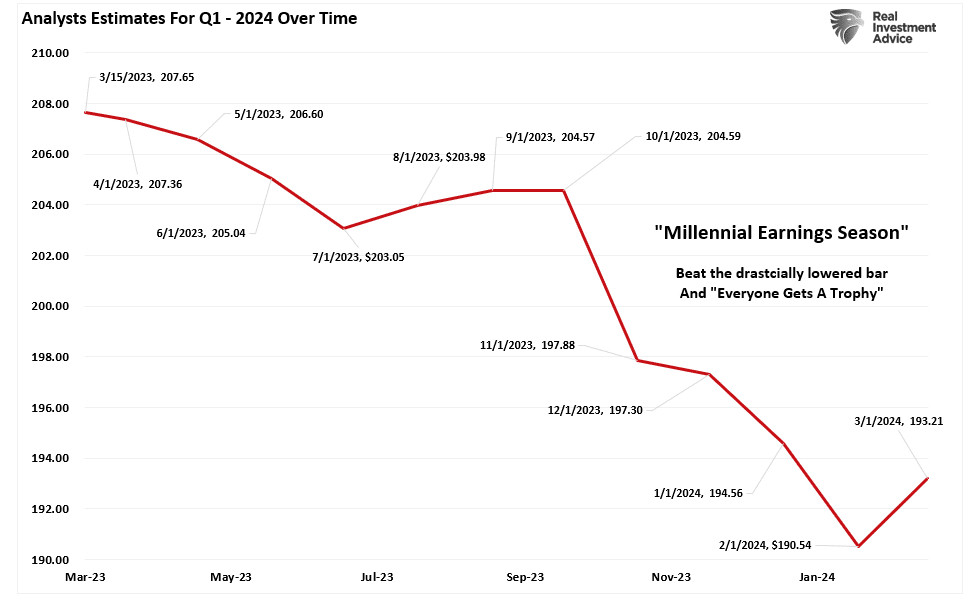
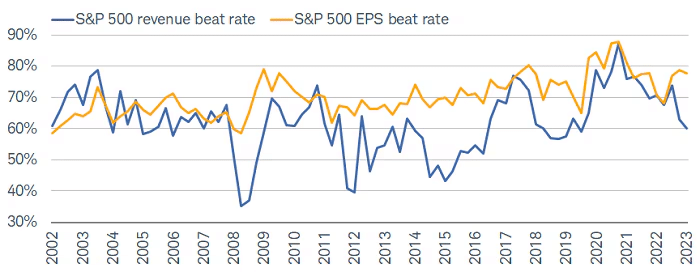
This is why we call it “Millennial Earnings Season.” Wall Street continuously lowers estimates as the reporting period approaches so “everyone gets a trophy.” An easy way to see this is the number of companies beating estimates each quarter, regardless of economic and financial conditions. Since 2000, roughly 70% of companies regularly beat estimates by 5%. Again, that number would be lower if analysts were held to their original estimates.
Analysts remain optimistic about earnings even with economic growth weakening, inflation remaining elevated, and liquidity declining. However, despite the decline in Q4 earnings estimates, it is worth noting that reported earnings did bottom in Q4 2022. Interestingly, earnings have increased sharply in 2023 but have yet to eclipse the 2022 peak. Furthermore, earnings have expanded despite higher interest rates and inflation as companies have aggressively passed on costs to consumers who have been able to absorb them so far.
Buybacks Remain Key
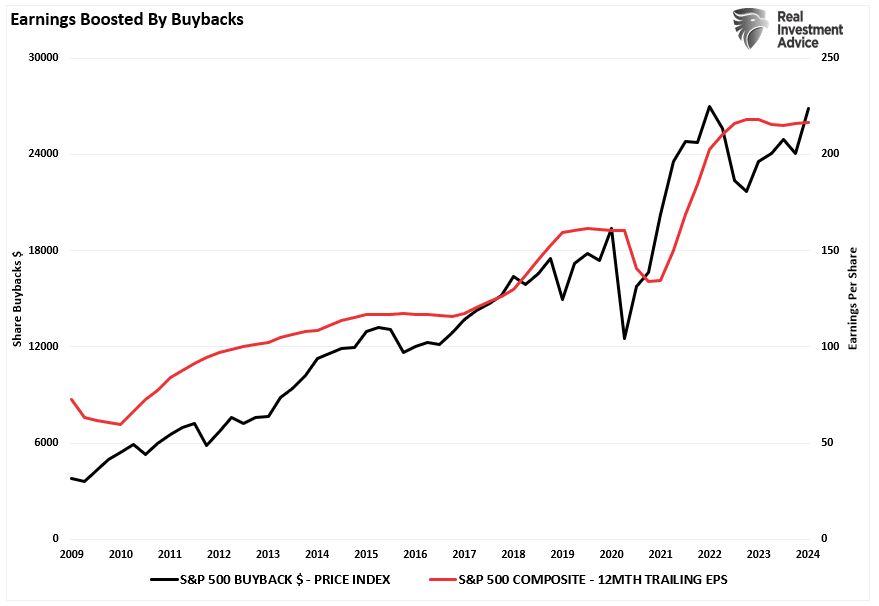
The other support for improved earnings in the S&P 500 index has been the aggressive level of share repurchases over the last couple of years. As noted recently in “Share Buybacks:.”
“Unsurprisingly, the market rally that began in November correlated with a strong surge in corporate share repurchases. Interestingly, while the media touts the strong earnings growth shown in the recent reporting period, such would not have been the case without the surge in buybacks. The result is not surprising given that the majority of earnings growth for the quarter came from the companies that are the most aggressive with share repurchases. However, given current valuation levels, it should make one question precisely what you are paying for.”
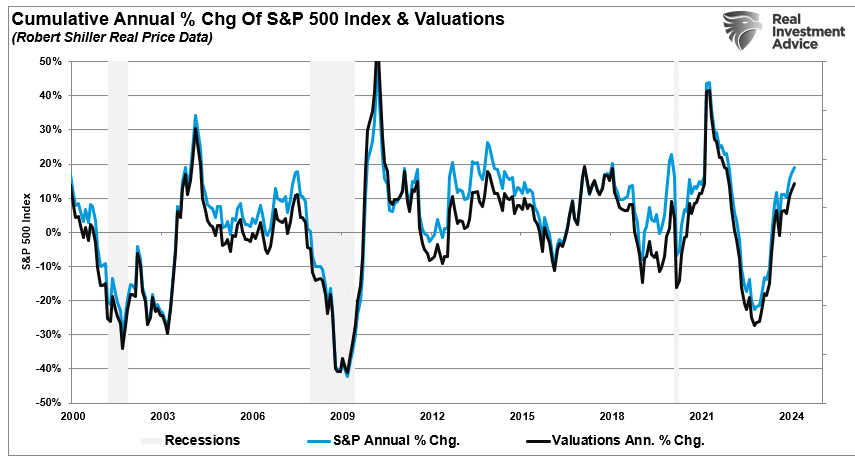
Furthermore, the market is currently rising faster in price than valuations. Such often occurs coming off of economic lows and recessionary periods. However, as shown, we are potentially reaching an inflection point where growth slows unless there is some form of aggressive monetary or fiscal stimulus.
Overly Optimistic
Despite the surge in earnings in recent quarters, analyst’s expectations of future growth remain problematic. There is a substantial deviation, starting with Q1 earnings, from the long-term fundamental growth trend.
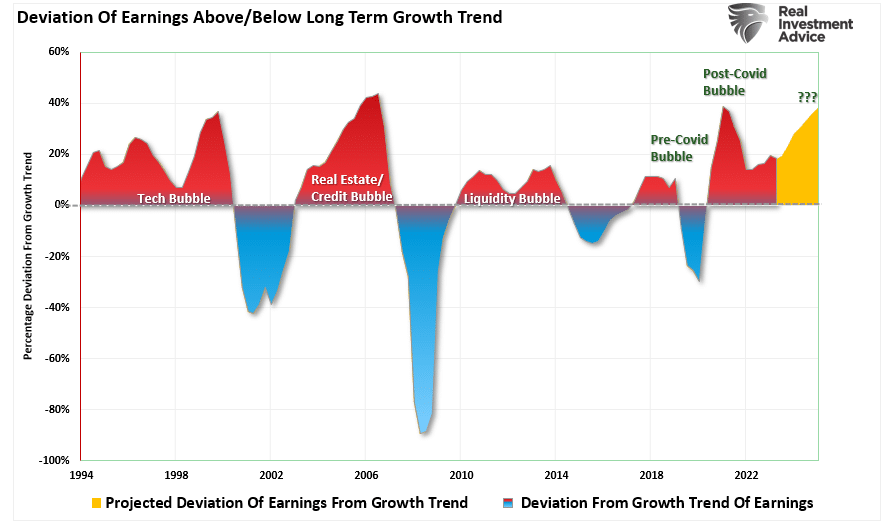
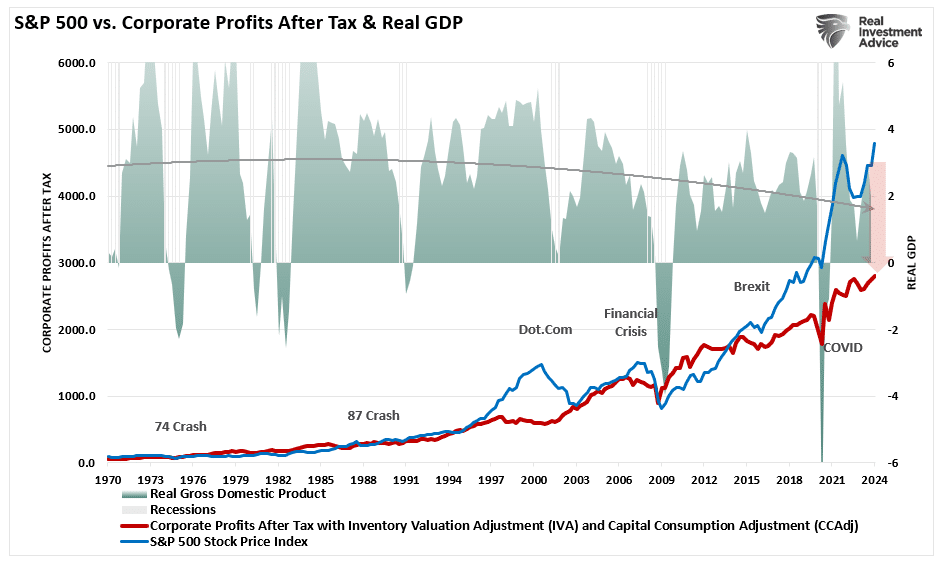
As discussed previously, economic growth, from which revenue and earnings are derived, must also grow enormously for earnings to grow at such an expected pace.
“Since 1947, earnings per share have grown at 7.72%, while the economy has expanded by 6.35% annually. That close relationship in growth rates is logical, given the significant role that consumer spending has in the GDP equation. However, while nominal stock prices have averaged 9.35% (including dividends), reversions to underlying economic growth will eventually occur. Such is because corporate earnings are a function of consumptive spending, corporate investments, imports, and exports. The same goes for corporate profits, where stock prices have significantly deviated.”
This is important to investors due to the coming impact on “valuations.” Given current Q1 earnings and economic assessments from Wall Street to the Federal Reserve, such is not currently expected to be the case. However, as Albert Edwards noted this past week:
“The Fed may have been playing ‘loosey-goosey’ with liquidity this last year but the narrative to support sky-high equity valuations and the 33% rally is that the AI revolution will drive corporate profits sharply higher. That may be entirely plausible but let us look at what is actually happening with the data. Our preferred measure to gauge earnings momentum is the percentage of analysts’ eps estimate changes that are upgrades.”
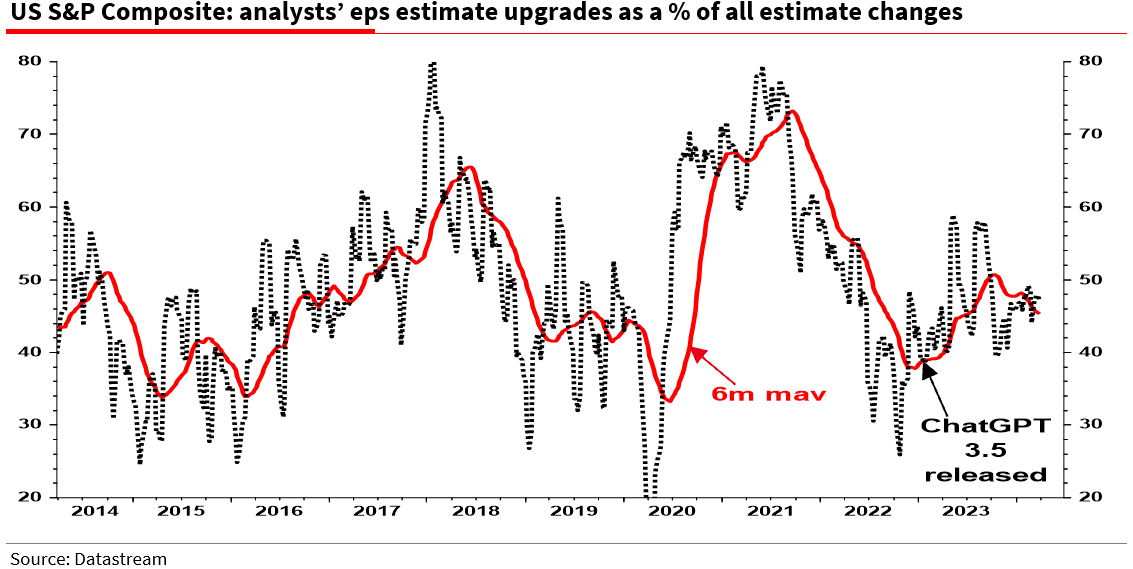
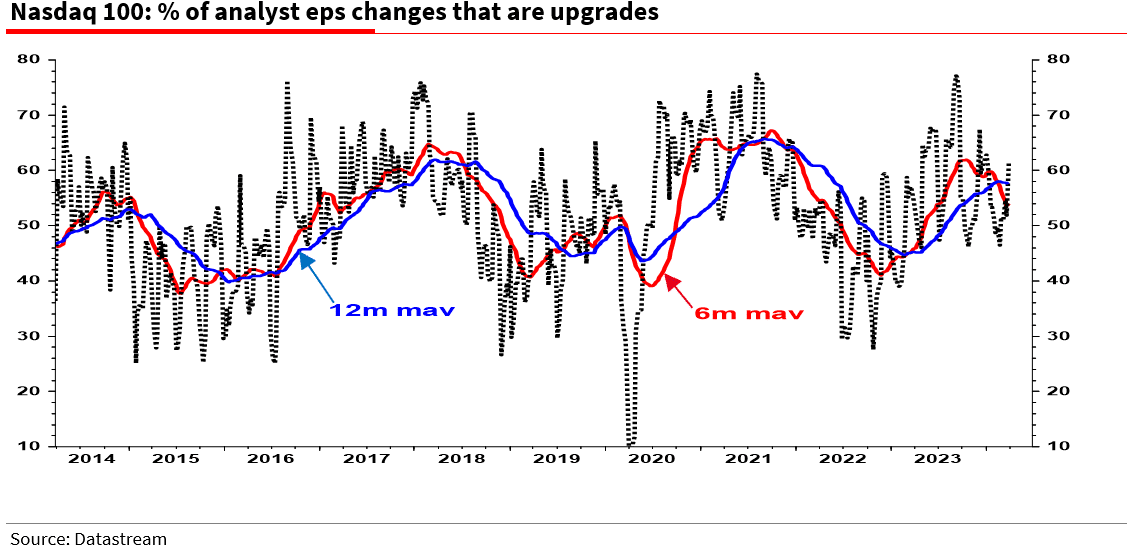
“You will immediately note above (and below) how erratic the monthly data is but that a six-month moving average draws out a clear trend – one that has been falling in recent months. The same downtrend is apparent for the tech heavy Nasdaq 100 index – the 12m mav has also topped out.”
This is not the stuff of economic recovery signaled by some other cyclical leading indicators. As Albert concludes:
“A clear change in direction in analyst optimism is usually a good cyclical ‘straw in the wind’ of a change in fortune for an economy. On that basis the closely watched manufacturing ISM index, which typically moves in step with analyst optimism, is now at risk of a surprise downturn.”
This is why “reversions to mean” happen regularly.
The Reversion To The Mean
Following the pandemic-driven surge in monetary policy and a shuttering of the economy, the economy is slowly returning to normal. Of course, normal may seem very different compared to the economic activity we have witnessed over the last several years. Numerous factors at play support the idea of weaker economic growth rates and, subsequently, weaker earnings over the next few years.
- The economy is returning to a slow growth environment with a risk of recession.
- Inflation is falling, meaning less pricing power for corporations.
- No artificial stimulus to support demand.
- Over the last three years, the pull forward of consumption will now drag on future demand.
- Interest rates remain substantially higher, impacting consumption.
- Consumers have sharply reduced savings and higher debt loads.
- Previous inventory droughts are now surpluses.
Notably, this reversion of activity will become exacerbated by the “void” created by pulling forward consumption from future years.
“We have previously noted an inherent problem with ongoing monetary interventions. Notably, the fiscal policies implemented post the pandemic-driven economic shutdown created a surge in demand and unprecedented corporate earnings.”
As shown below, the surge in the M2 money supply is now over. Without further stimulus, economic growth will revert to more sustainable levels.
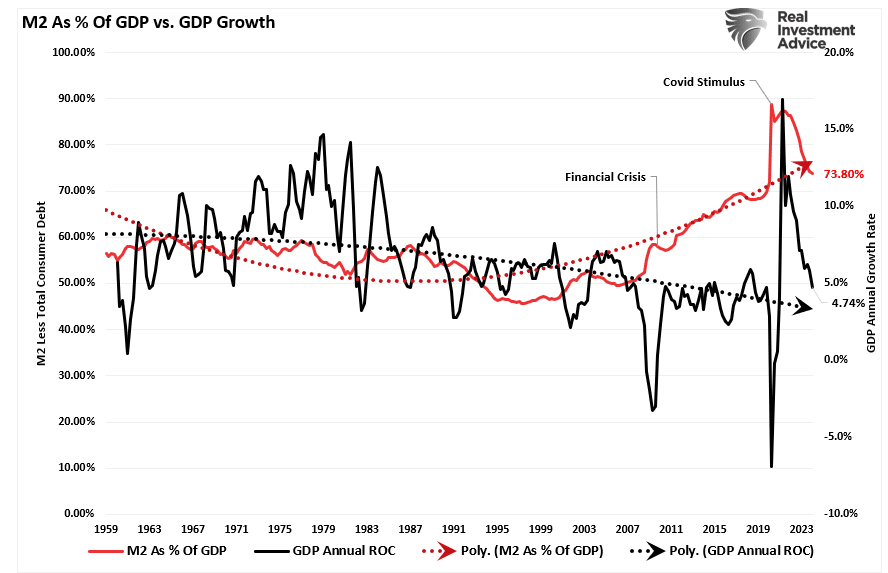
While the media often states that “stocks are not the economy,” as noted, economic activity creates corporate revenues and earnings. As such, stocks can not grow faster than the economy over long periods. A decent correlation exists between the expansion and contraction of M2 less GDP growth (a measure of liquidity excess) and the annual rate of change in the S&P 500 index. Currently, the deviation seems unsustainable.
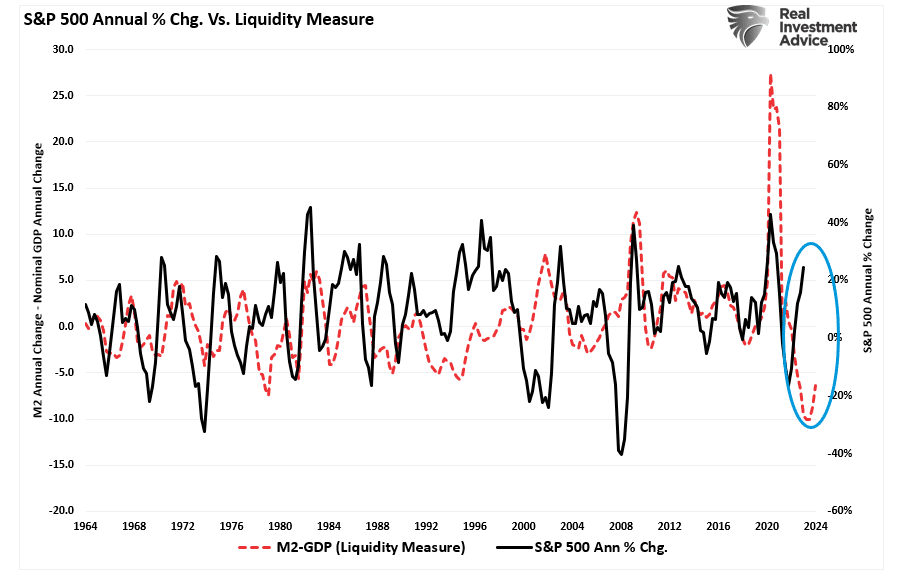
So, either the annualized rate of return from the S&P 500 will decline due to repricing the market for lower-than-expected earnings growth rates, or the liquidity measure is about to turn sharply higher.
Valuations Remain A Risk
The problem with forward earnings should be obvious. Given that forward earnings estimates are almost always wrong, such means that investors overpay for investments. As should be obvious, overpaying for an investment today leads to lower future returns.
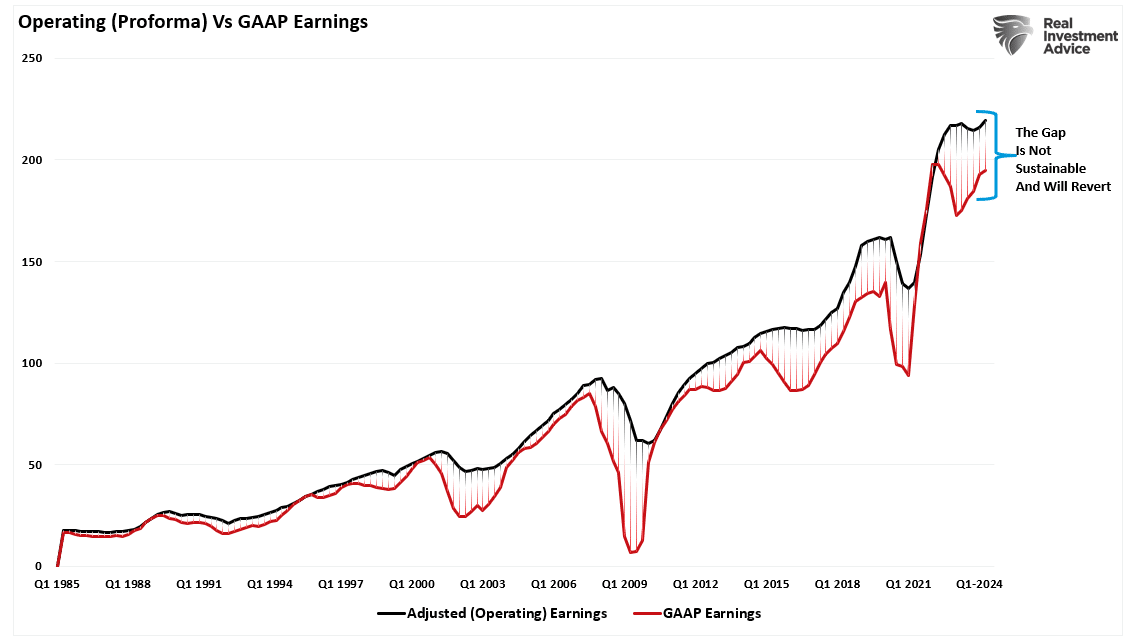
Even with the decline in earnings from the peak, valuations remain historically expensive on both a trailing and forward basis. (Notice the significant divergences in valuations during recessionary periods as adjusted earnings do NOT reflect what is occurring with actual earnings.)
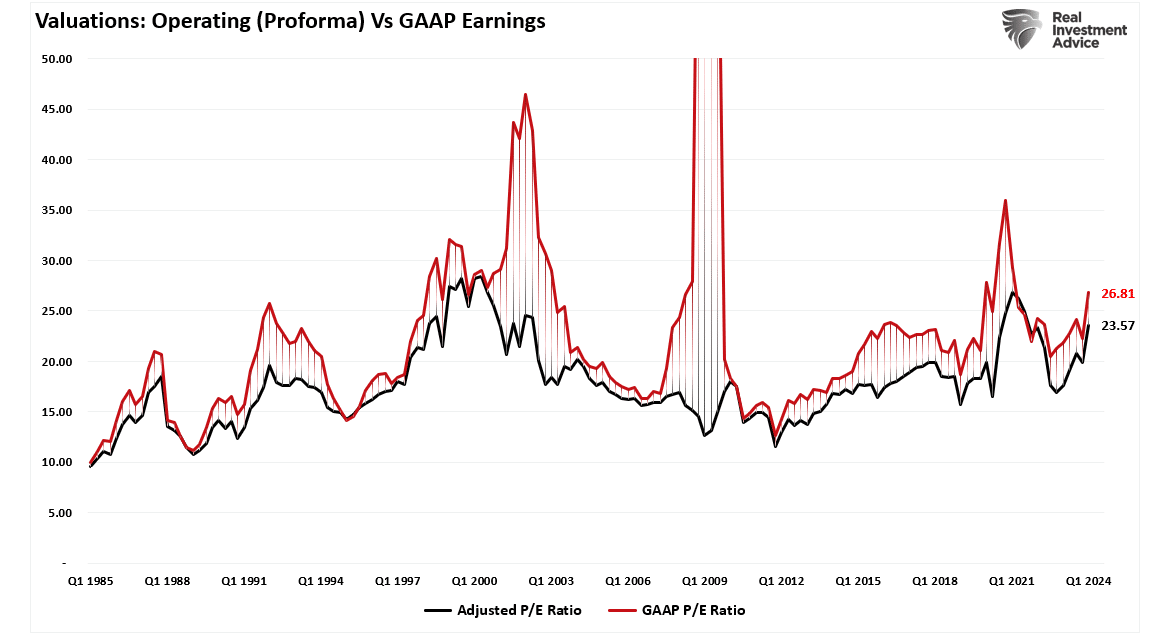
Most companies report “operating” earnings, which obfuscate profitability by excluding all the “bad stuff.” A significant divergence exists between operating (or adjusted) and GAAP Q1 earnings. When a variation of that magnitude occurs, you must question the “quality” of those earnings.
The hope, as always, is that Q1 earnings and the entire coming year’s reports will rise to justify the market’s overvaluation. However, when earnings are rising, so are the markets.
Most importantly, analysts have a long and sordid history of being overly bullish on growth expectations, which fall short. Such is particularly the case today. Much of the economic and earnings growth was not organic. Instead, it was from the flood of stimulus into the economy, which is now evaporating.
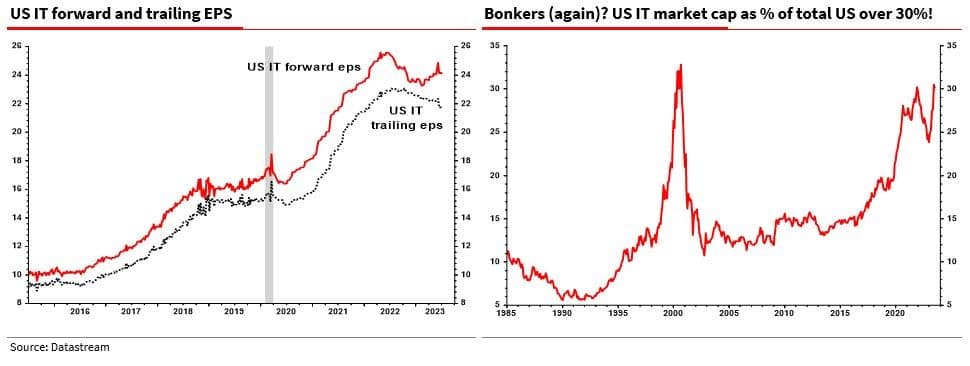
While anything is certainly possible, the surge in analysts’ estimates since the end of 2022 seems based more on “hope” than economic realities. The correlated rise in equity prices has logically followed suit.
“The US tech sector has surged on the back of what may prove to be nothing but hope – mainly AI related. Actual earnings are poor in absolute and relative terms. Yet the sector is again over 30% of total market cap. Of all the strange things I have seen over the years, that looks simply nuts.” – Albert Edwards, Societe Generale
Overpaying for assets has never worked out well for investors.
When it comes to analysts’ Q1 earnings estimates, always remain wary of “Greeks bearing gifts.”
How We Are Trading It
There is no concern about “risk” in the financial markets as the “bullish bias” remains unfettered. It is certainly possible the market advance can continue unabated into one of the historically lengthier stretches. The only question is, “When will it end, and how big of a correction will it be?”
What will cause the correction is unknown. If the market becomes aware of an issue, participants “price” that “risk” into markets. Such is why prices decline rapidly when investors are aggressively positioned in the market. When “risk” is introduced via an unexpected, exogenous event, a “rush for the exits” occurs.
Long-term portfolio management is always about managing “risk” by “tweaking” things over time.
This analysis suggests that we should continue to use rallies to rebalance portfolios.
- Trim Winning Positions back to their original portfolio weightings. (ie. Take profits)
- Sell Those Positions That Aren’t Working. If they don’t rally with the market during a bounce, they will decline when it sells off again.
- Move Trailing Stop Losses Up to new levels.
- Review Your Portfolio Allocation Relative To Your Risk Tolerance. If you have an aggressive allocation to equities at this point of the market cycle, you may want to try and recall how you felt during 2008. Raise cash levels and increase fixed income accordingly to reduce relative market exposure.
Could I be wrong? Absolutely.
But what if the indicators are warning us of something more significant?
What’s worse:
- Missing out temporarily on the initial stages of a longer-term advance or;
- Spending time getting back to even, which is not the same as making money.
As I noted recently in our blog on trading rules:
“Opportunities are made up far easier than lost capital.” – Todd Harrison
Have a great week.
Research Report

Subscribe To “Before The Bell” For Daily Trading Updates
We have set up a separate channel JUST for our short daily market updates. Please subscribe to THIS CHANNEL to receive daily notifications before the market opens.
Click Here And Then Click The SUBSCRIBE Button
Subscribe To Our YouTube Channel To Get Notified Of All Our Videos
Bull Bear Report Market Statistics & Screens

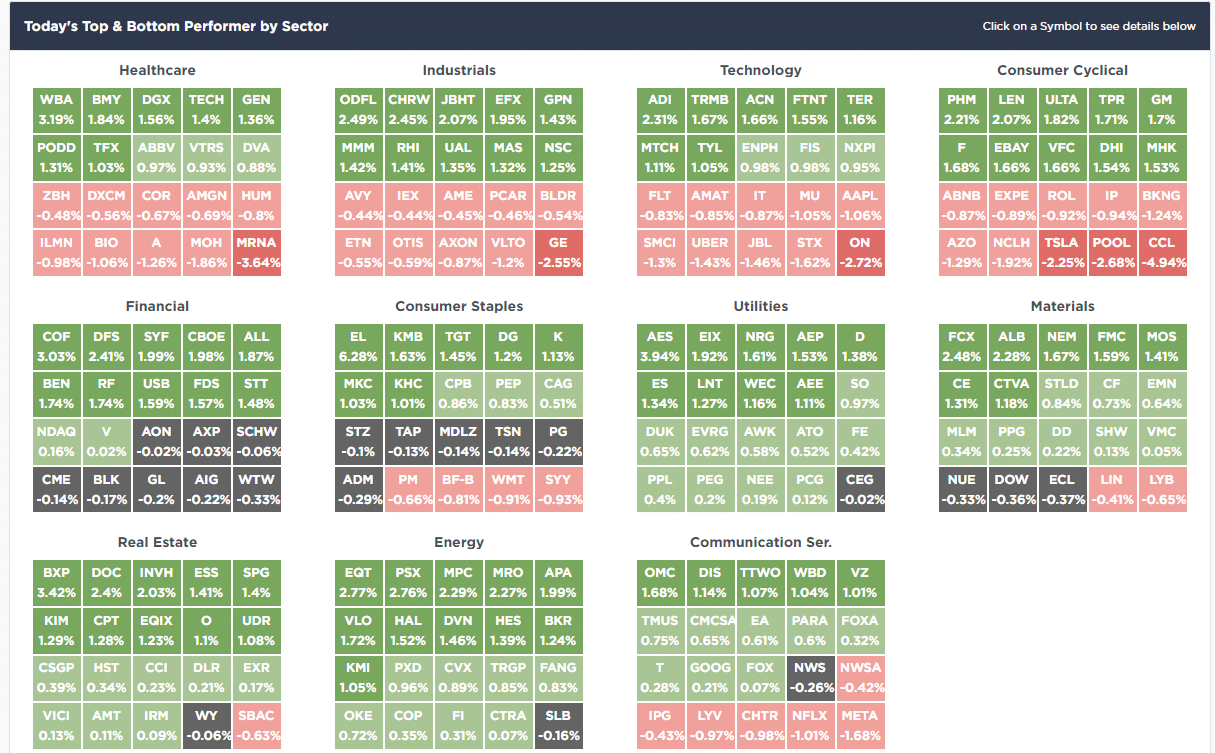
SimpleVisor Top & Bottom Performers By Sector
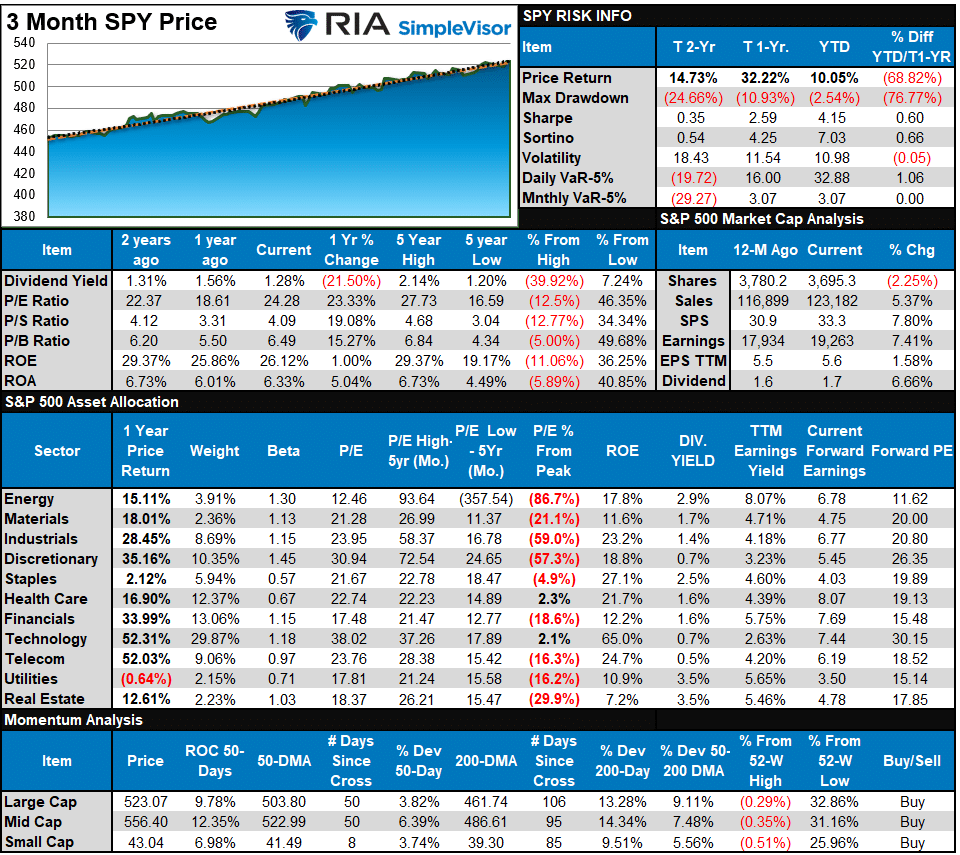
S&P 500 Weekly Tear Sheet
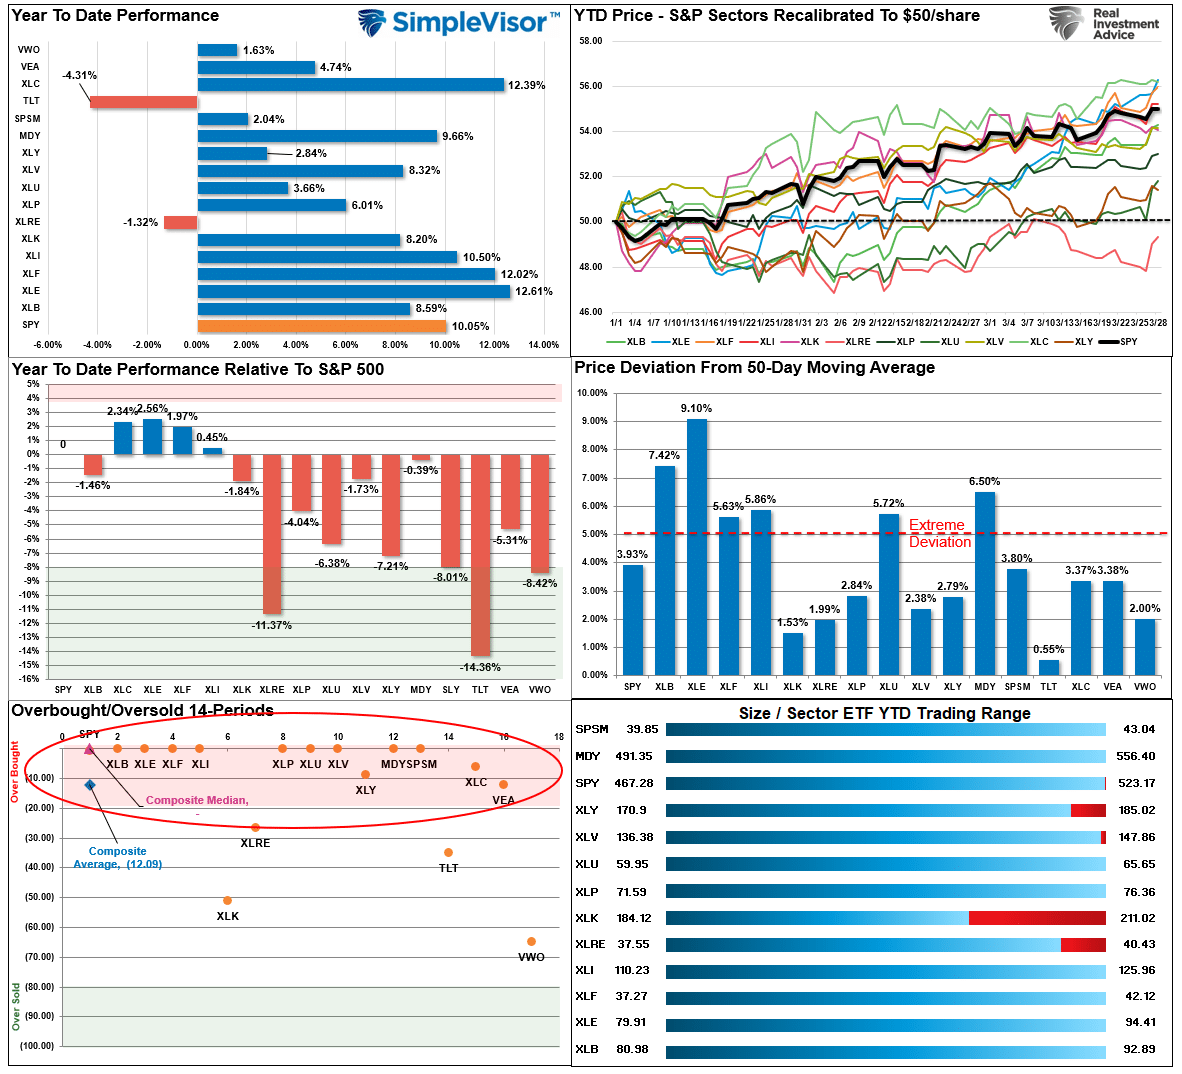
Relative Performance Analysis
The Q1 rally left the market up 10%, the largest beginning-of-the-year rally since 2019. That rally has also left most markets and sectors in highly overbought territory, deviated above the 50-DMA, and exuberant. Such has previously been the required ingredients for a short-term reversal. While exuberant markets can stay that way for a while due to the underlying momentum, some caution is advised concerning increasing allocations at current levels. We suspect that we will get a better entry point to increase equity exposures over the next month or so.
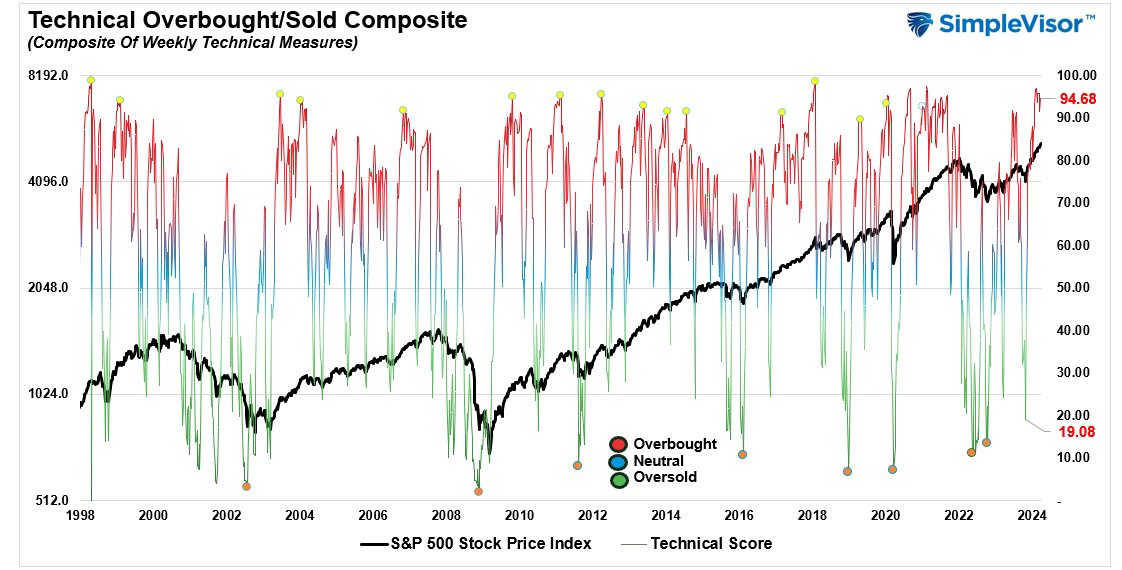
Technical Composite
The technical overbought/sold gauge comprises several price indicators (R.S.I., Williams %R, etc.), measured using “weekly” closing price data. Readings above “80” are considered overbought, and below “20” are oversold. The market peaks when those readings are 80 or above, suggesting prudent profit-taking and risk management. The best buying opportunities exist when those readings are 20 or below.
The current reading is 94.68 out of a possible 100.
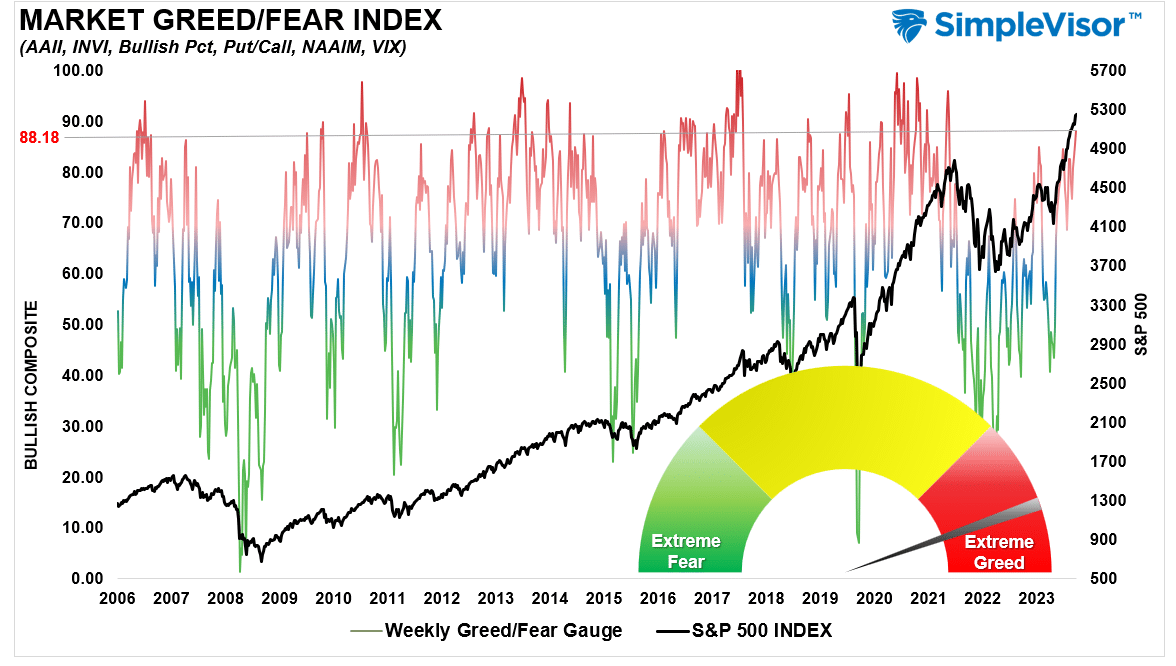
Portfolio Positioning “Fear / Greed” Gauge
The “Fear/Greed” gauge is how individual and professional investors are “positioning” themselves in the market based on their equity exposure. From a contrarian position, the higher the allocation to equities, the more likely the market is closer to a correction than not. The gauge uses weekly closing data.
NOTE: The Fear/Greed Index measures risk from 0 to 100. It is a rarity that it reaches levels above 90. The current reading is 88.18 out of a possible 100.
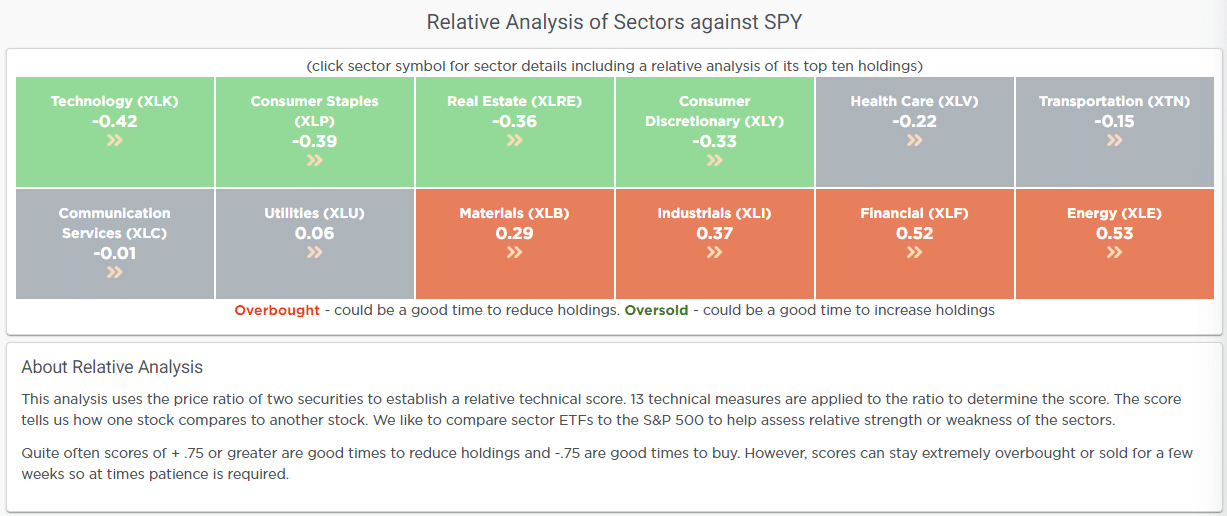
Relative Sector Analysis
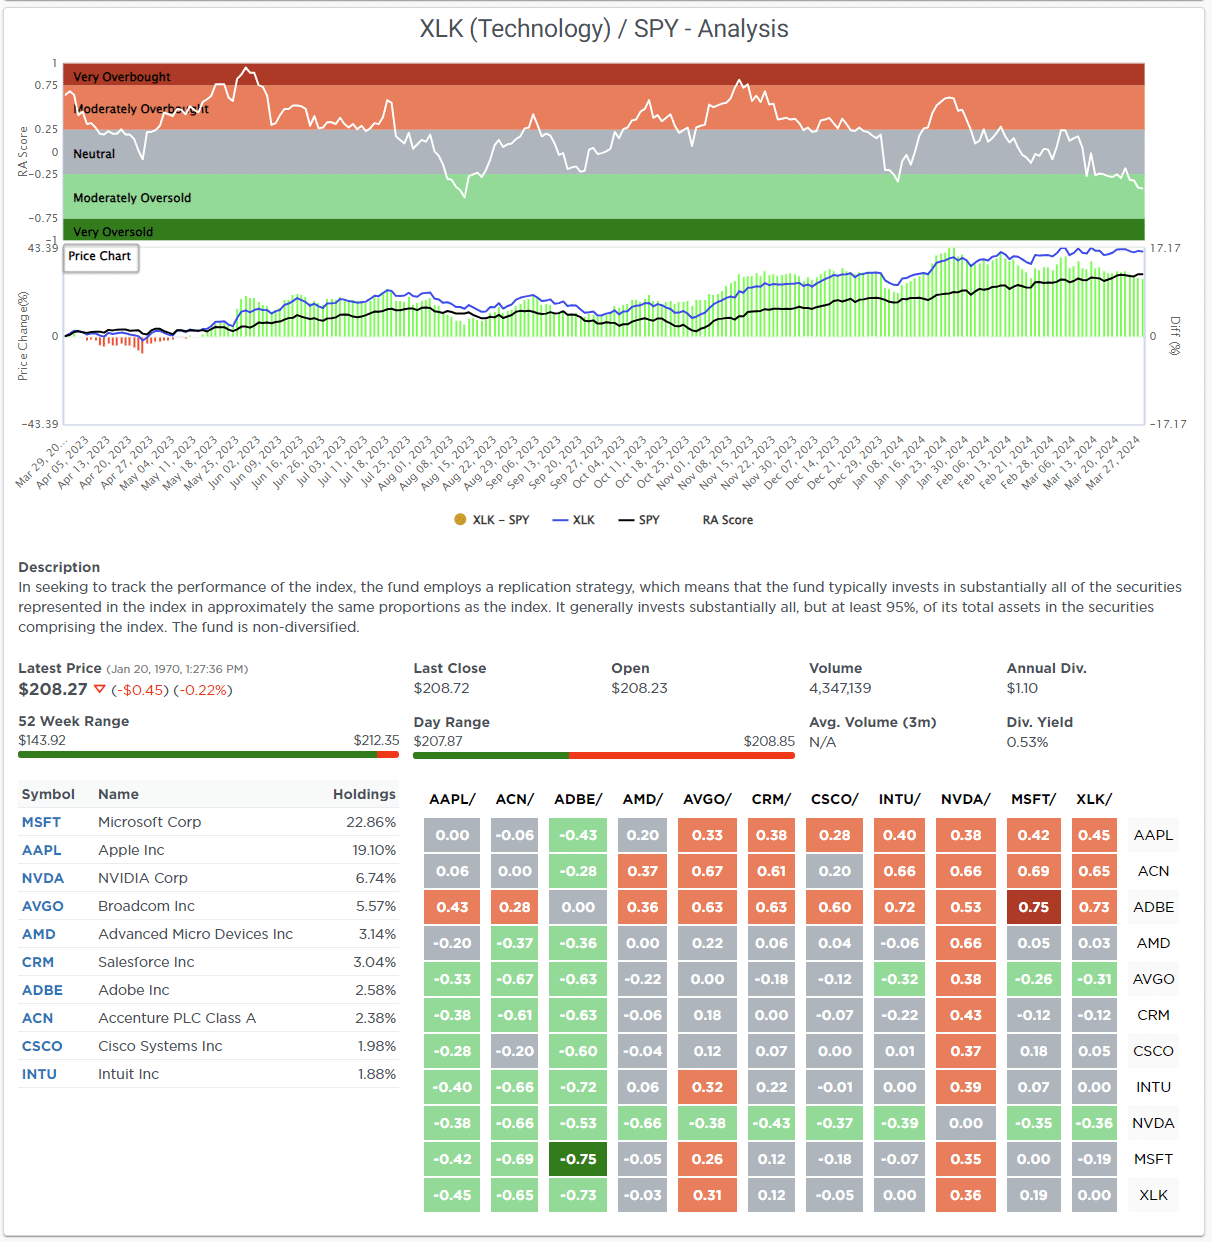
Most Oversold Sector Analysis
Sector Model Analysis & Risk Ranges
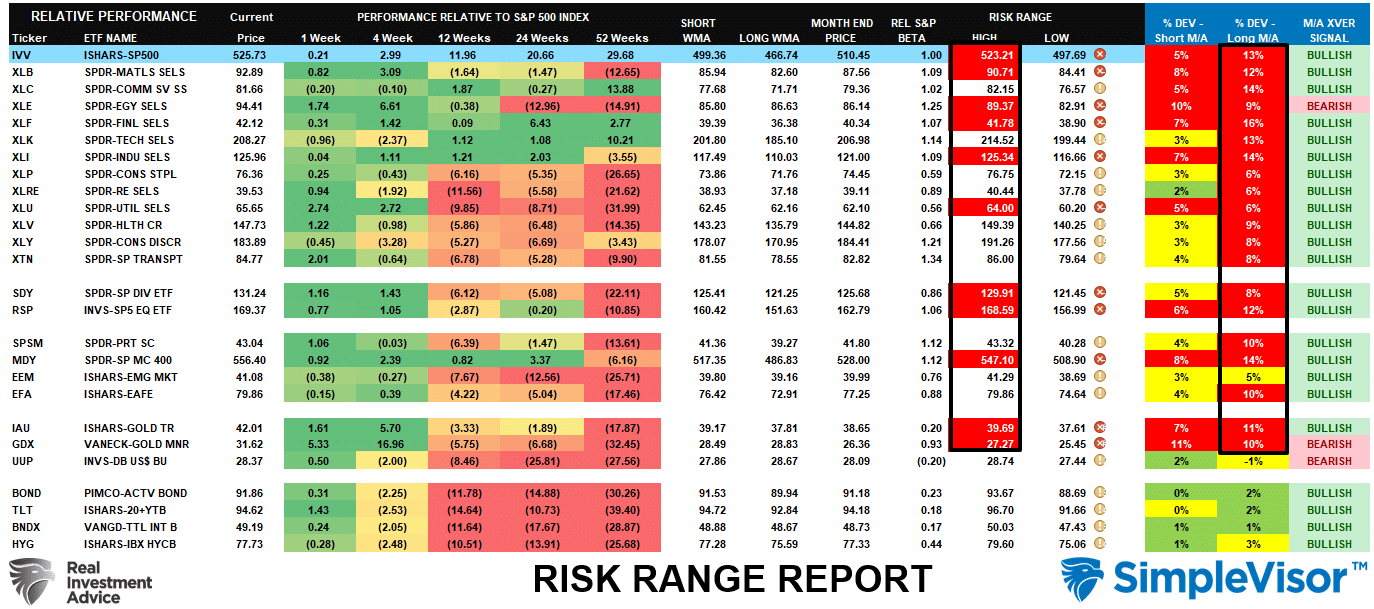
How To Read This Table
- The table compares the relative performance of each sector and market to the S&P 500 index.
- “MA XVER” (Moving Average Crossover) is determined by the short-term weekly moving average crossing positively or negatively with the long-term weekly moving average.
- The risk range is a function of the month-end closing price and the “beta” of the sector or market. (Ranges reset on the 1st of each month)
- The table shows the price deviation above and below the weekly moving averages.
Deviations for many market sectors from their longer-term moving averages became even more extreme this past week. The S&P 500, Gold, Gold Miners, Energy, Industrials, Utilities, Dividend S&P, Equal Weight S&P, Mid-Cap, and Materials are well outside their normal risk ranges. Such suggests profit-taking should be implemented. The bullish backdrop of the market remains, but at some point, there will be a correction that reverses these more extreme deviations. However, corrections will likely stay between 5-10% and will be buyable opportunities with most sectors and markets trading with bullish moving average crossovers.
Weekly SimpleVisor Stock Screens
We provide three stock screens each week from SimpleVisor.
This week, we are searching for the Top 20:
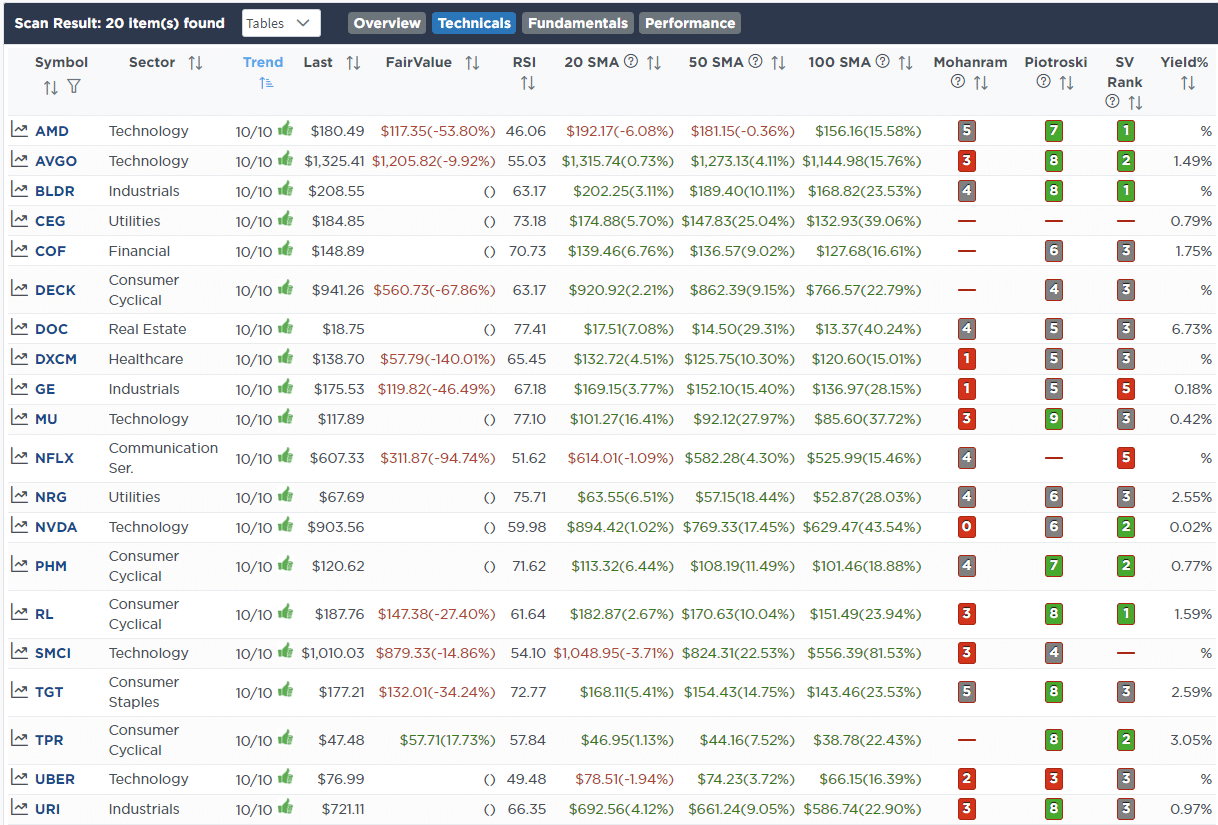
- Relative Strength Stocks
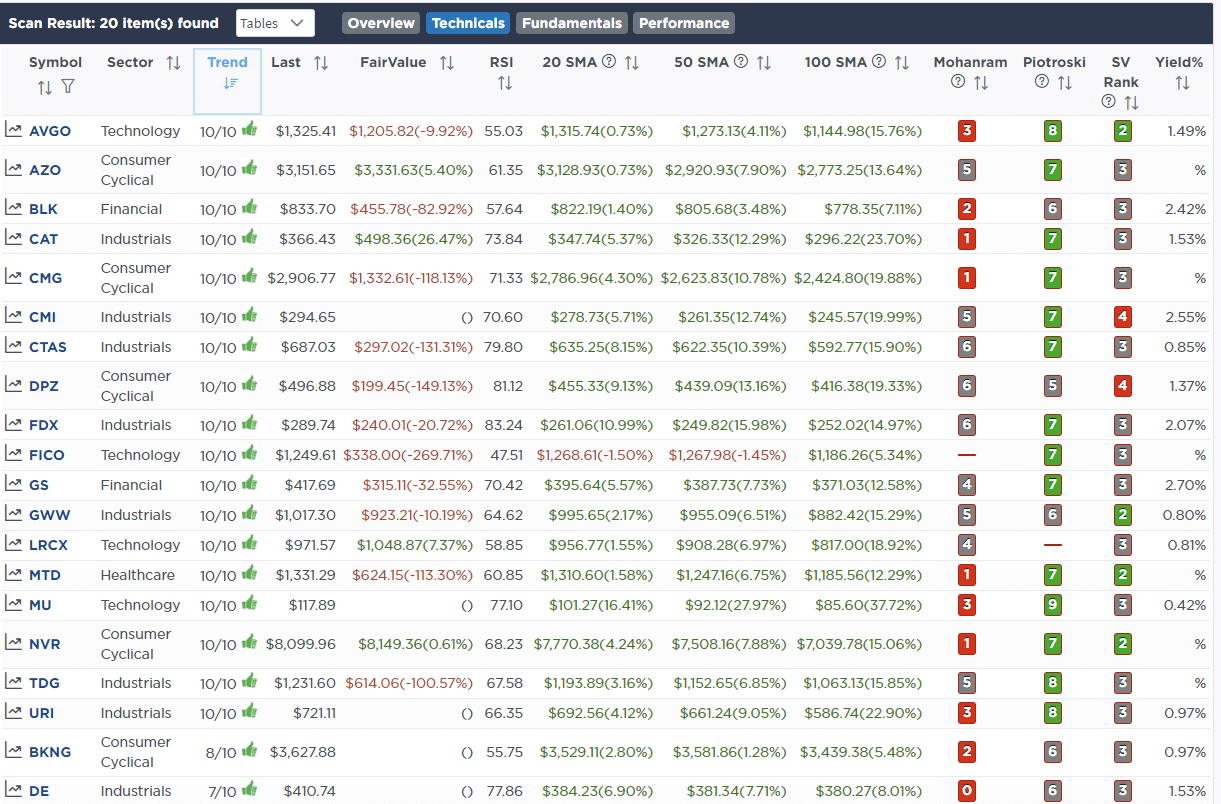
- Momentum Stocks
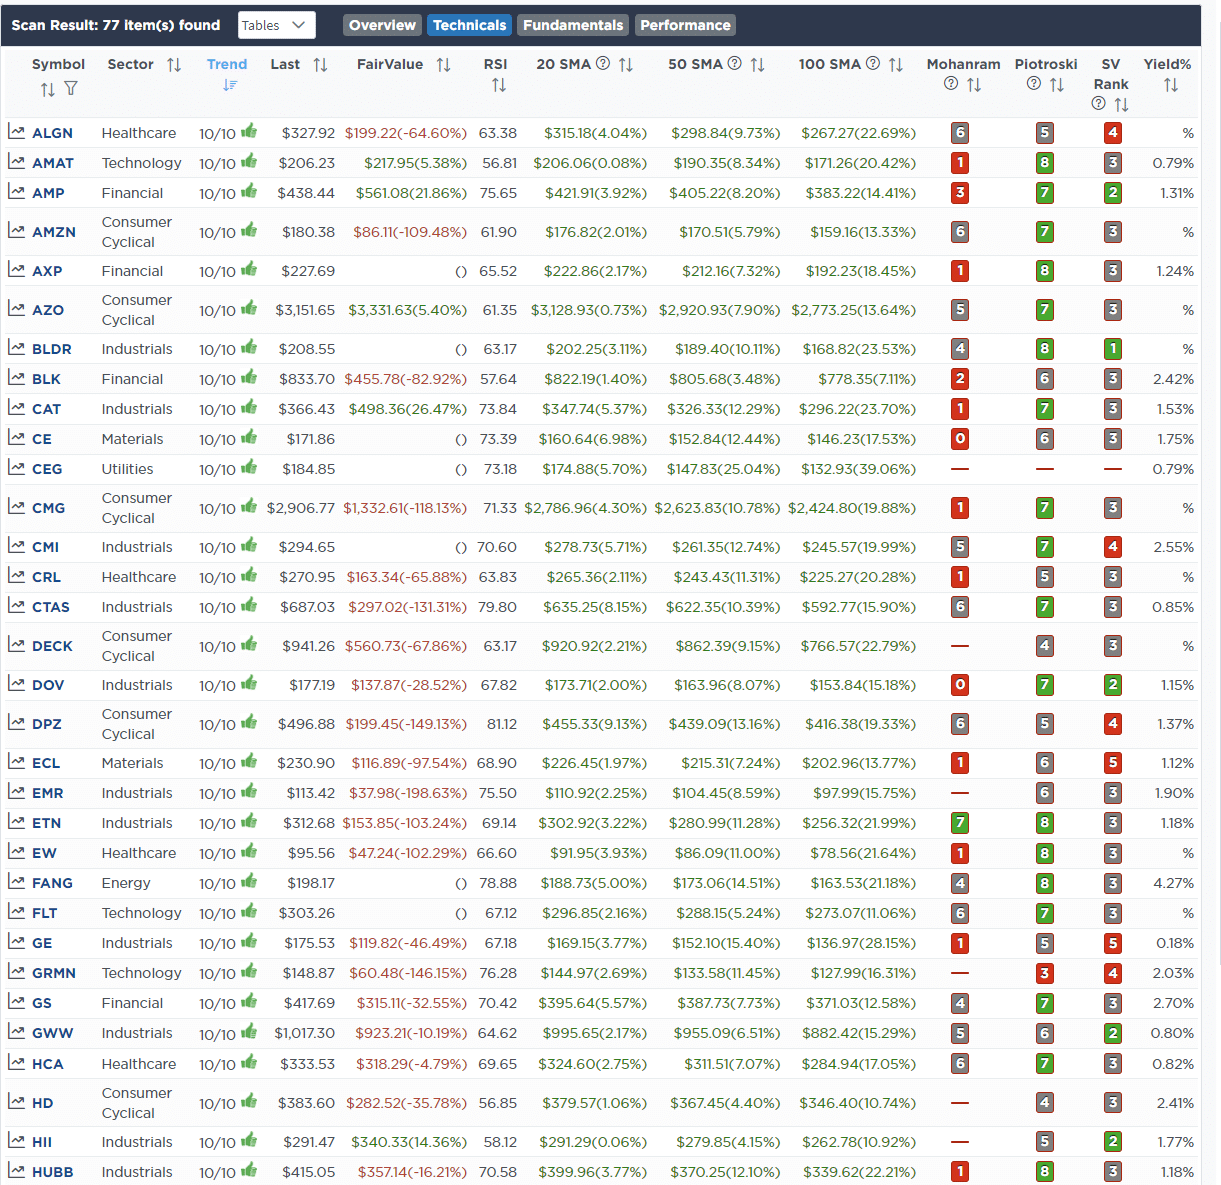
- Fundamental & Technical Strength W/ Dividends
(Click Images To Enlarge)
R.S.I. Screen
Momentum Screen
Fundamental & Technical Strength
SimpleVisor Portfolio Changes
We post all of our portfolio changes as they occur at SimpleVisor:
No Trades This Week

Lance Roberts, C.I.O.
Have a great week!


