
One of the most interesting conundrums is the surging wealth gap in America. Despite two of the largest bull markets in history since 1980, most Americans struggle with making ends meet and are unprepared for retirement. Such a reality starkly differs from the belief that rising asset prices benefit the masses.
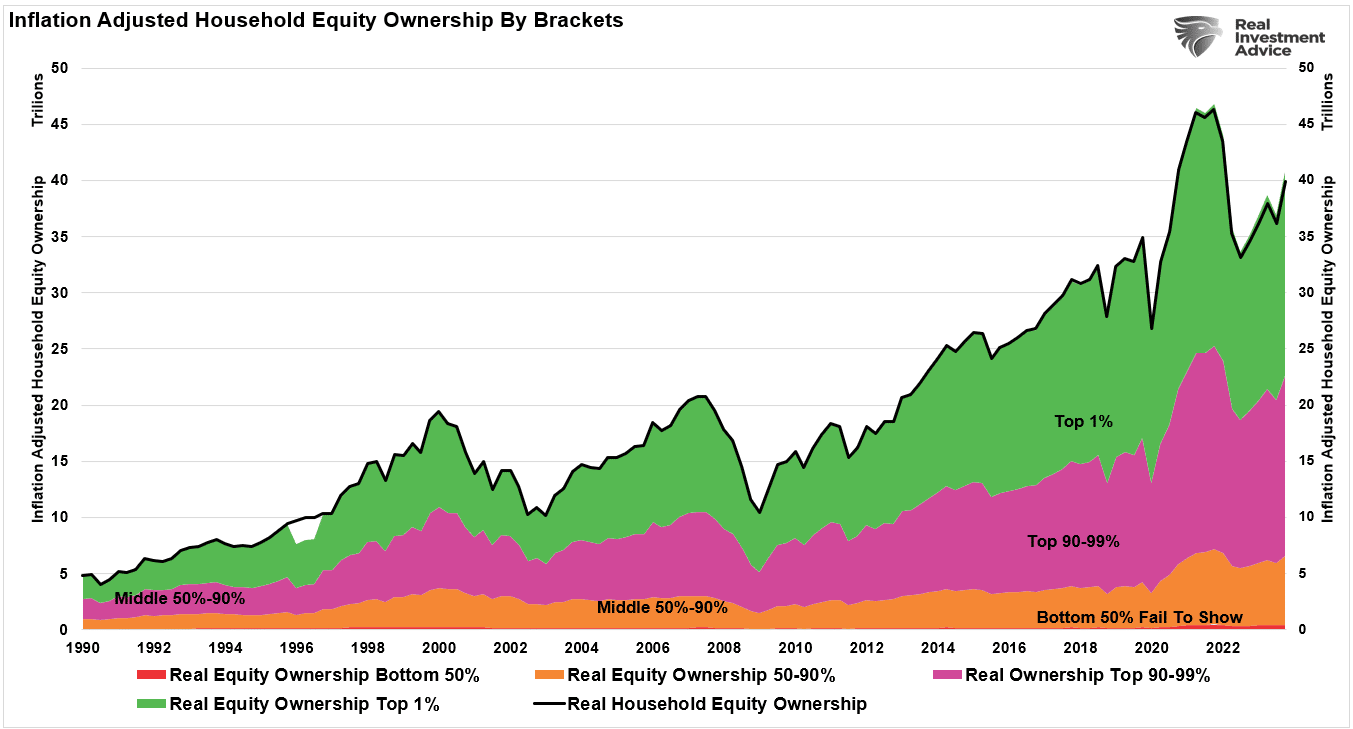
For example, in a recent St. Louis Federal Reserve Bank analysis, total household wealth was $139.1 trillion, covering 131 million families. Of that total wealth, 74% was owned by just 13.2 million families, or roughly 10% of the population.
Notably, this measure of wealth includes the equity of the family’s home. While home equity is essential, it is not readily spendable without taking on debt to extract the value. Therefore, Americans’ “liquid wealth” is far more unequally distributed. However, such is hard to fathom given the endless parade of media and social media influencers extolling the virtues of “building wealth through investing.”
Interestingly, that survey came after the Government injected nearly $5 trillion into the economy, a massive surge in deficit spending, and the Fed’s $120 billion monthly injections doubled asset prices from the March 2020 lows. Unsurprisingly, in February, Fidelity published its latest analysis showing the number of retirement accounts with balances of more than $1 million surged toward a record. To wit:
“The number of seven-figure 401(k) accounts at Fidelity Investments jumped 20% in 2023’s final quarter to 422,000, marking a sharp recovery from the previous quarter’s 7.7% drop.
Gains in the stock market helped swell retirement balances last year as the S&P 500 advanced 24% following 2022’s 19% decline. The impressive run was powered in large part by the so-called “Magnificent 7” stocks that now make up roughly 30% of the market-cap weighted S&P 500 Index. The only time when the ranks of 401(k) millionaires at Fidelity was higher was in 2021’s fourth quarter, when there were 442,000 such accounts. Elsewhere, the number of seven-figure IRAs is at a record 391,600 accounts.” – Bloomberg
However, that data obfuscates the stark wealth gap below the surface. While the “number of retirement millionaires” made headlines, an essential piece of the analysis was overlooked. Those 422,000 accounts comprised only a tiny fraction of Fidelity’s 27.2 million retirement accounts. How small of a fraction? About 1.6%. That number aligns with America’s Top 1% of equity ownership.

But indeed, after two booming bull markets since 1980, most Americans would be well saved for retirement. Unfortunately, that is not the case.
So, what went wrong?

The 50% Problem
The advice to build wealth is quite simplistic. Investment money into the financial market consistently over long periods. That’s it.
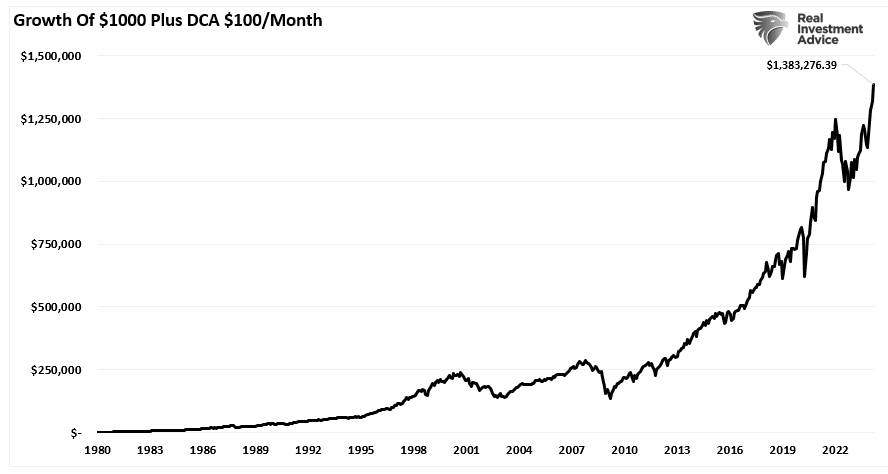
Again, considering that most Americans alive today participated in either one or both of the most significant secular bull markets in history, the lack of wealth is quite appalling. If individuals had invested $1000 in 1980 into the S&P 500 index and added just $100 per month, they would have roughly $1.4 million in retirement savings today.
However, if it is so simple, why do most Americans have little or no savings?
“One in 4 Americans have no retirement savings and those who are saving aren’t saving enough. Those that are [saving], on average, what they have saved will afford them like $1,000 a month of actual cash while they’re in retirement.” – Price-Waterhouse Retirement In America.
The report found that the median retirement account balance for 55-to-64-year-olds is $120,000. Dividing over 15 years would generate a modest monthly distribution of less than $1,000. The bigger problem is the large percentage of individuals with no retirement savings.

There are two primary reasons individuals do not save and invest for retirement. While psychological reasons account for 50% of the problem, such as buying high and selling low, the other 50% comes down to a lack of capital to invest.

We have previously written about the various psychological pitfalls investors make in destroying their investment capital. However, for many, it is a problem of being unable or unwilling to save money.
- Lack of knowledge about budgeting and saving. (15%)
- The cost of living exceeds income. (70%)
- Bad previous investing experience (bear market). (15%)
If you ask anyone who doesn’t save money, you will likely get one of those three answers. It is hard to “save and invest” when there simply isn’t enough income.
However, this is where the disconnect between the economic data and the “average American” is exposed.

Not Enough Income
Most mainstream analysis utilizes “averages” to discuss the economy’s health. For example, disposable incomes (DPI), personal savings rates, and debt-to-income ratios suggest that the average American family is flush with cash with little debt. However, most of these calculations, like DPI (income minus taxes), are generalizations due to the variability of household income and individual tax rates.
More importantly, the measure becomes skewed by the top 20% of income earners, notably the top 5%. The chart below shows those in the top 20% saw substantially larger median wage growth versus the bottom 80%. (Note: all data used below is from the Census Bureau and the IRS.). The cost of raising a family of four continues to increase with inflation, so the bottom 80% are forced to live paycheck-to-paycheck, primarily leaving no money for retirement savings.

Furthermore, disposable and discretionary incomes are two very different animals.
Discretionary income is the remainder of disposable income after paying for all mandatory spending like rent, food, utilities, health care premiums, insurance, etc. For the bottom 80% of income earners, the cost of living outstrips most of those individuals’ incomes. Debt must make up the difference.

In other words, given the bulk of the wage gains are in the upper 20%, any data that reports an “average” of the information skews the results higher. This is why there is a vast difference between the debt service levels (per household) between the bottom 80% and the top 20%.
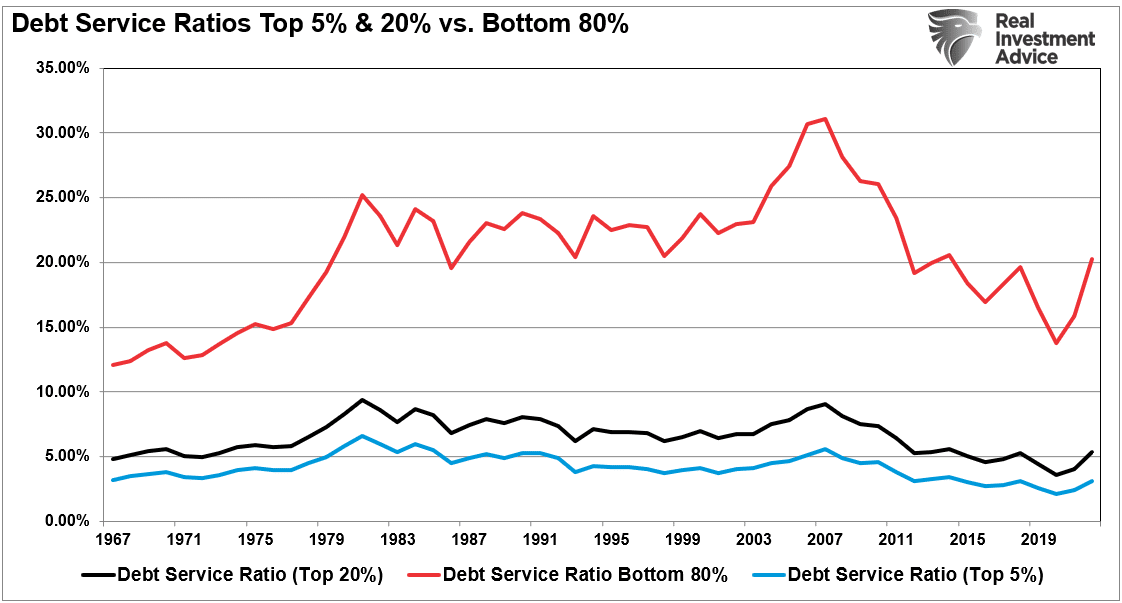
Yes, saving money and investing it into the financial markets is tough when you must go further into debt every month to make ends meet.

The Wealth Gap And The Road To Serfdom
The rise and fall of stock prices has little to do with the average American’s participation in the domestic economy. Interest rates and inflation are entirely different matters. Since interest rates affect “payments,” and inflation increases the “costs of living,” changes negatively impact consumption, housing, and investment.
Therefore, while the stock market surges to all-time highs, the wealth gap leaves increasing numbers of Americans behind. For the average American, it isn’t a choice of not wanting to participate; they simply can’t.
The reality is that middle-class America continues to shrink as the wealth gap increases. The rich can invest, save, and use little debt to sustain living standards. People experiencing poverty rely on debt, making long-term prosperity an impossible goal.
Furthermore, as the peasants demand “more free stuff” from the Government, such requires more debt and higher taxes. Those demands divert more capital away from productive investment, leading to slower economic growth. As growth slows, businesses shift to the lowest labor costs, or automation, to lower income growth for domestic workers. Such leads to more demands from “free stuff” from the Government, and the cycle intensifies, pushing more of the middle class downward.
The share of annual incomes between the bottom 80% and the top 5% is evidence of that wealth transfer from the middle class.

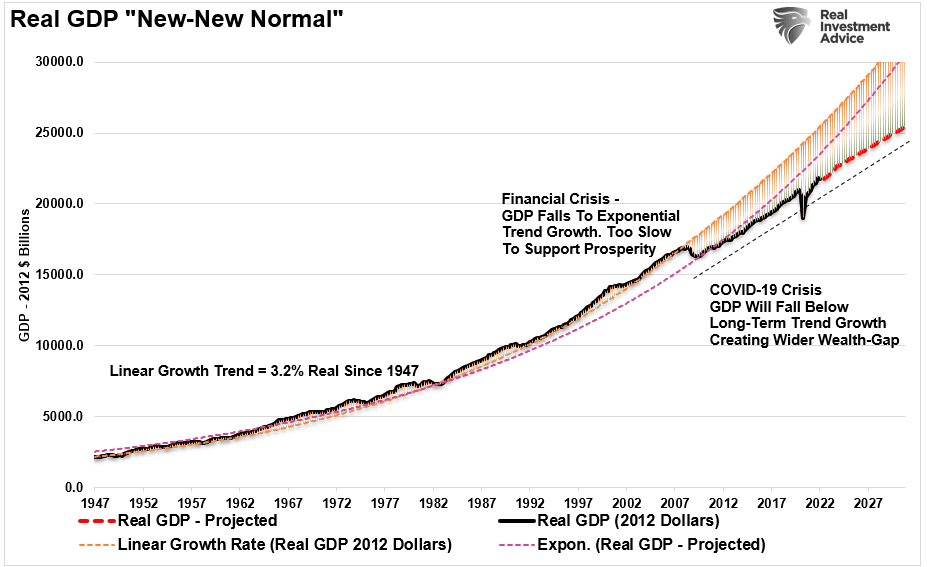
The “road to serfdom” is paved with good intentions. After decades of piling on increasing debt levels to generate economic growth, the damage to economic growth is becoming more visible. Economic growth trends are already falling short of previous long-term growth trends.
Of course, this analysis also underscores why bitter economic sentiment persists even as the bull market registers all-time highs. It is hard to be excited about a booming stock market when you don’t participate much, if at all.
For 80% of Americans, the end game of too much debt, an aging demographic, and the push for “socialistic policies” is the continued extraction of wealth from the “middle class” to the “rich.”
Of course, we don’t have to look much further than Japan to see how this eventually works out. They don’t have a middle class, either.

