


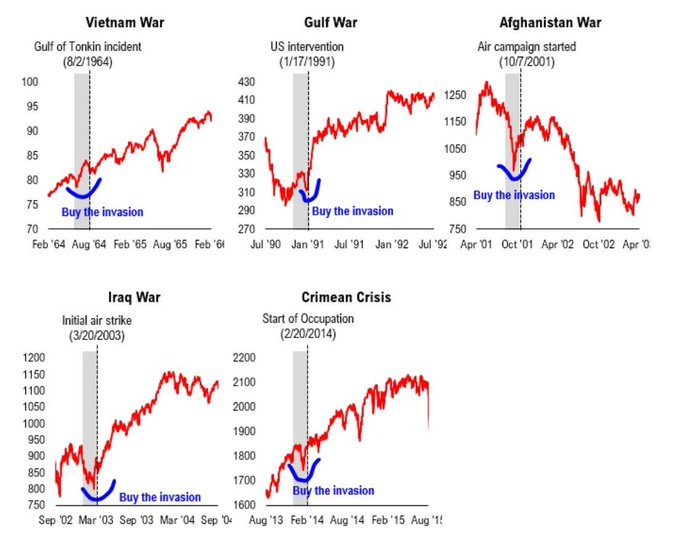
“Russia Invades Ukraine” is the media headline this morning as the thing concerning investors finally happened. There has been little “fear” in the markets during this current correction, but that will change today. As of the time of this writing S&P Futures are -2% and NASDAQ Futures -2.5%. If these hold, the NASDAQ will have erased ALL of its gains since the beginning of 2021 and be down 20% from its November peak.
However, with fear running rampant in the market, could this also be a time to start thinking about doing something unthinkable – buying stocks?

What To Watch Today
Economy
- 8:30 a.m. ET: Chicago Fed National Activity Index, January (0.16 expected, -0.15 in December)
- 8:30 a.m. ET: Initial Jobless Claims, week ended Feb. 19 (235k expected, 248k prior)
- 8:30 a.m. ET: Continuing Claims, week ended Feb. 12 (1.580 million expected, 1.593 million prior)
- 8:30 a.m. ET: GDP annualized, quarter-over-quarter, 4Q second estimate (7.0% expected, 6.9% in prior estimate)
- 8:30 a.m. ET: Personal consumption, 4Q second estimate (3.4% expected, 3.3% in prior estimate)
- 8:30 a.m. ET: GDP Price Index, 4Q second estimate (6.9% expected, 6.9% in prior estimate)
- 8:30 a.m. ET: Core PCE quarter-over-quarter, 4Q second estimate (4.9% expected, 4.9% in prior estimate)
- 10:00 a.m. ET: New Home Sales, January (802k expected, 811k prior)
- 10:00 a.m. ET: New Home Sales, month-over-month, January (-1.2% expected, 11.9% prior)
- 11:00 a.m. ET: Kansas City Fed Manufacturing Activity, February (25 expected, 24 in January)
Earnings
Pre-market
- Discovery Inc. (DISCA) to report adjusted earnings of $0.86 on revenue of $3.13 billion
- Norwegian Cruise Line (NCLH) to report an adjusted loss of $1.60 on revenue of $571.58 million
- Keurig Dr. Pepper (KDP) to report adjusted earnings of $0.45 on revenue of $3.31 billion
- Newmont Corp. (NEM) to report adjusted earnings of $0.77 on revenue of $3.36 billion
- SeaWorld Entertainment (SEAS) to report adjusted earnings of $0.30 on revenue of $343.22 million
- Moderna (MRNA) to report adjusted earnings of $10.17 on revenue of $6.9 billion
- Planet Fitness (PLNT) to report adjusted earnings of $0.25 on revenue of $177.31 million
- Nikola (NKLA) to report an adjusted loss of $0.32 on revenue of $5.06 million
- Wayfair (W) to report an adjusted loss of $0.71 on revenue of $3.29 billion
- Six Flags Entertainment (SIX) to report an adjusted loss of $0.08 on revenue of $268.09 million
Post-market
- Coinbase (COIN) to report adjusted earnings of $2.34 on revenue of $2.0 billion
- Occidental Petroleum (OXY) to report adjusted earnings of $1.09 on revenue of $7.32 billion
- Intuit (INTU) to report adjusted earnings of $1.83 on revenue of $2.66 billion
- Opendoor Technologies (OPEN) to report an adjusted loss of $0.14 on revenue of $3.19 billion
- Autodesk (ADSK) to report adjusted earnings of $1.44 on revenue of $1.2 billion
- Dell Technologies (DELL) to report adjusted earnings of $1.94 on revenue of $27.54 billion
- Block Inc. (SQ) to report adjusted earnings of $1.24 on revenue of $4.01 billion
- Zscaler (ZS) to report adjusted earnings of $0.11 on revenue of $242.03 million
- Rocket Cos. (RKT) to report adjusted earnings of $0.37 on revenue of $2.60 billion
- VMWare (VMW) to report adjusted earnings of $1.96 on revenue of $3.52 billion
- Etsy (ETSY ) to report adjusted earnings of $0.89 on revenue of $685.47 million
- Beyond Meat (BYND) to report an adjusted loss of $0.69 on revenue of $101.4 million
- Monster Beverage Corp. (MNST) to report adjusted earnings of $0.61 on revenue of $1.33 billion
Time For A Reflex Rally?
As Russia invades the “risk off” trade will pick up steam with bond yields dropping sharply.
However, as I noted on Twitter recently that the market is now oversold on many levels combined with very negative investor sentiment. Such is a good setup for a short-term reflexive rally.
The selloff yesterday broke key support levels, which is also adding to the selling this morning, and now suggests a reflexive rally will likely fail and lead to lower levels. With the markets deeply oversold, we do suspect the markets could pivot to seeing a more “dovish” Fed allowing for a reflexive rally as a better opportunity to reduce equity risk.

Such is why it is important not to let emotions control your trading decisions. However, we are not saying that the current correction can not turn into something deeper. If Morgan Stanley is right and we are now reliving the late 2018 playbook, that reflex rally should be sold into before a decline to 3,800 by the end of March.
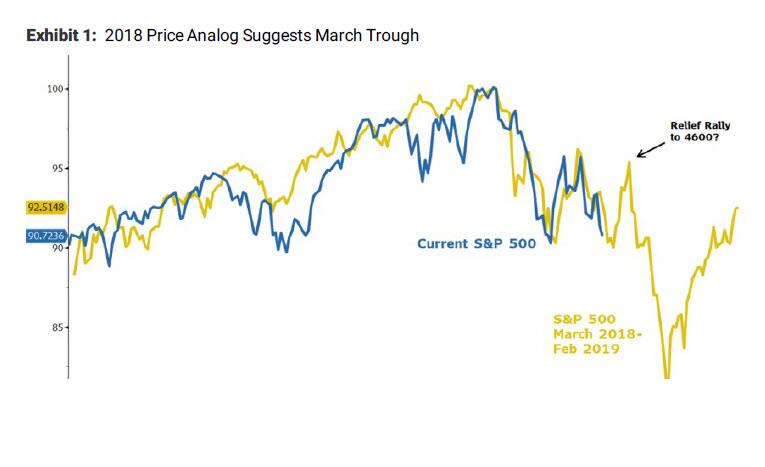
Of course, such a level would trigger the “Fed Put,” or the point where the Fed reverse course to supply accommodation to markets. Unfortunately, if true, the Fed won’t have much room to lower rates to support asset markets or stave off the next recession.
In other words, the Fed may be getting close to their end game.
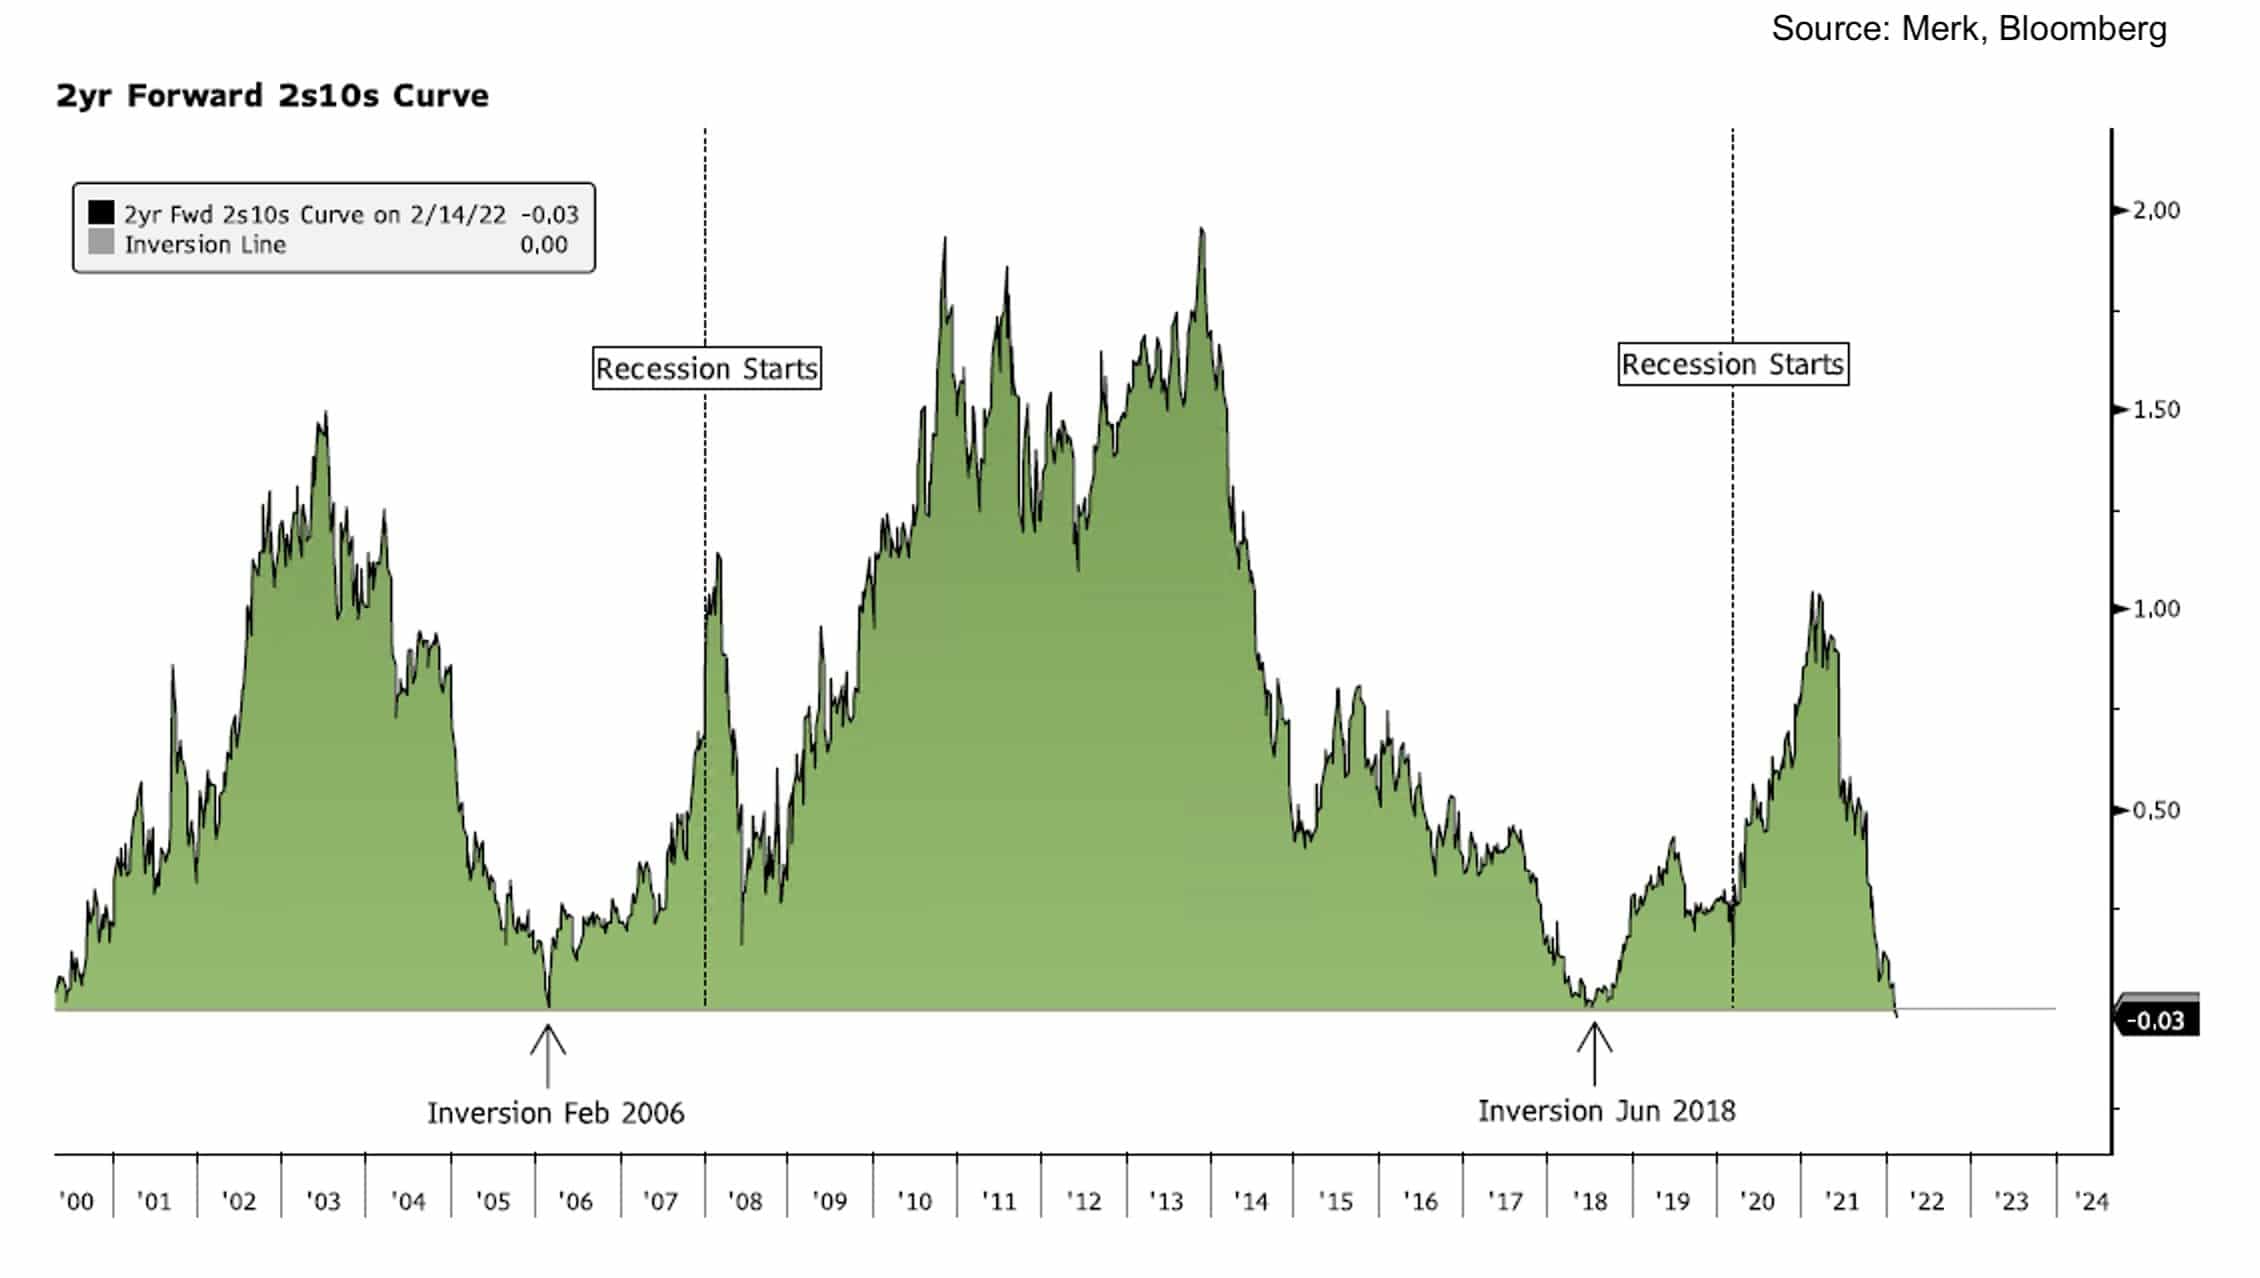
Will The Fed Tighten With A Recession Signal Flashing Red?
As Russia invades the two graphs below show forward UST yield curves are inverting. For more on what a forward curve is and what it implies, please read our Commentary from February 16, 2022. As the graphs highlight, forward yield curves tend to invert about a year to two prior to recessions. Additionally, the second chart graphing the forward 5yr/1yr curve shows the curve traditionally inverts close to the end of a prolonged Fed rate hiking cycle.
The current inversions signal a very likely recession in the next two years. That said, comparisons to the past are problematic. For starters, the Fed has not even started to raise rates. Will they tighten with inverted forward yields curves and a near inversion of the widely followed 2yr/10yr spot UST curve? History argues no, but the time period we show does not contain periods of problematic inflation. The Fed is in quite the conundrum, and the markets are voicing concern they may make a mistake.

What’s Ailing Tech Stocks?
To help answer our question, we share a quote from Bank of America.
“Tech is one of the few sectors where buyback trends have noticeably slowed, and it now represents only 2% of new S&P 500 buyback announcements vs. 30-35% of buybacks in recent years.”
Share buybacks, especially those by the largest tech companies, have significantly bolstered stock performance over the last five years. In the previous few months, those same companies have backed off repurchasing their stock. As we have seen, tech has underperformed the market since their buybacks ebbed. The trend bears watching closely.
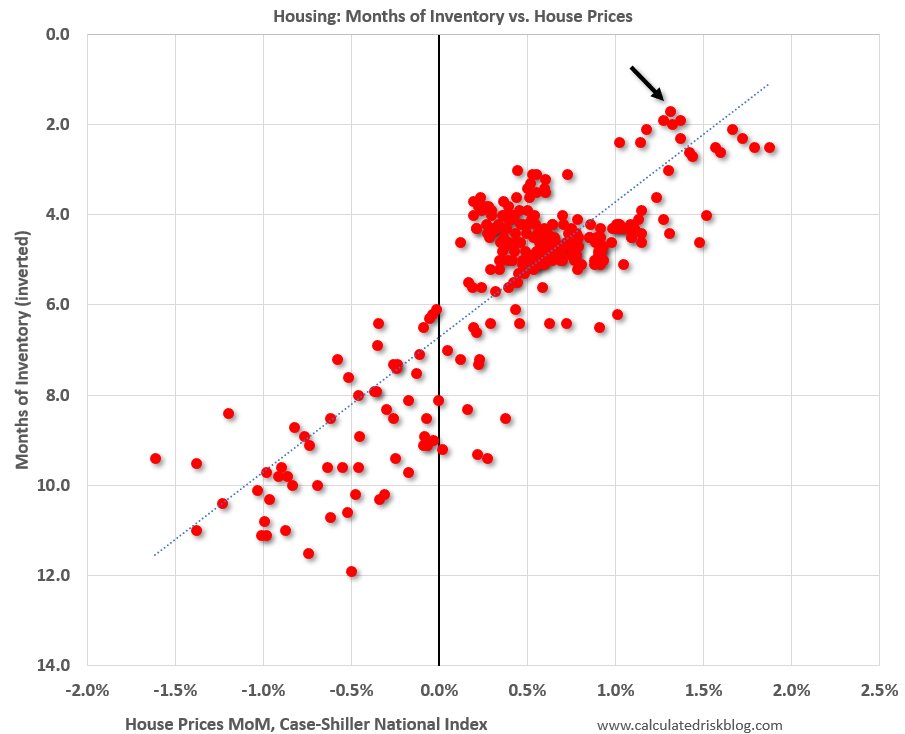
Home Price Inflation Remains Hot
The latest Case-Shiller national home price index rose 18.8% year over year. The gain is the largest on record dating back to 1987. For those forecasting that inflation will fall rapidly as supply lines heal and shortages go away, housing data may prove problematic. Housing accounts for nearly a third of the CPI index. If the CPI housing (OER/Rent) index calculation shows similar price growth as Case-Shiller, inflation is very likely to stay persistently high, regardless of the prices of other goods and services.
The Calculated Risk graph below shows that the inventory of homes on the market is the lowest in over 20 years. Given the lack of supply, the most recent monthly home price change of +1.3% is in line with historical correlations between the two factors. An influx of new homes being listed in the typically robust spring housing market should help alleviate the supply problem. Further higher mortgage rates will undoubtedly quell some demand. That said, home price inflation is a problem, and it will stick around for a least a few months.
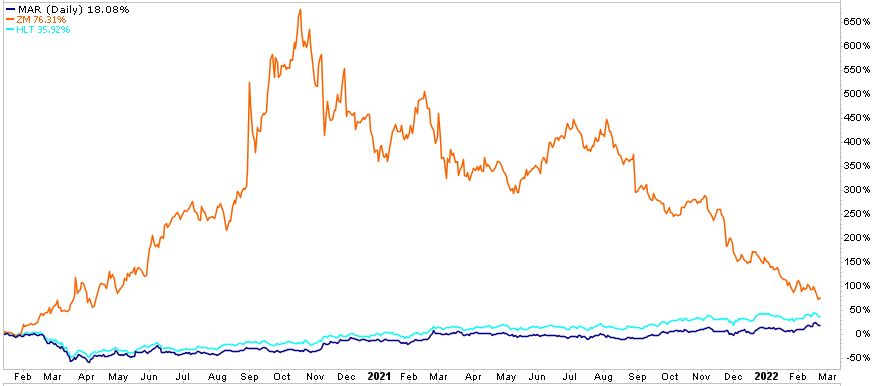
Markets Are Normalizing
The graph below shows the incredible 700% Pandemic rally in Zoom (ZM) followed by an equally stunning 80% decline. While Zoom was zooming, traditional leisure and hospitality stocks, most affected by the Pandemic, struggled. For example, Hilton (HLT) and Marriot (MAR) are lower volatility mirror images of Zoom. The graph below shows the once wide divergence between the Pandemic winners and losers is closing rapidly. Zoom is still up 76% since the Pandemic started but well off its highs. Hilton and Marriot are up 35% and 18% respectively over the same period.
Please subscribe to the daily commentary to receive these updates every morning before the opening bell.
Also Read


