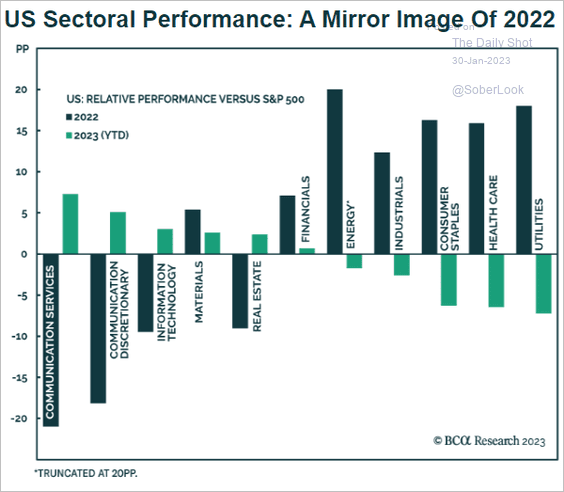
While only a month into the new year, 2023 has been marked by a sector rotation that has mainly been opposite of last year’s rotation trends. Thus far, consumer staples, utilities, and healthcare stocks are underperforming the S&P 500 by about 8%. In 2022, those three sectors outperformed as investor rotations focused on conservative, dividend, and value traits. This year, communications, last year’s worst-performing sector, is beating the S&P 500 by approximately 10%. Following closely behind is 2022’s second-worst performer, consumer discretionary. The graph below shows what worked last year is not working this year and vice versa.
The big question in 2023 is whether or not last year’s sector rotation trends will hold again in 2023. If a durable bottom has formed, the economy has a soft landing, and the Fed gently lowers rates, we should expect high growth and beaten-down sectors to follow their January performance. However, a deeper recession bodes well for 2022’s conservatism.
What To Watch Today
Economy
- 8:30 a.m. ET: Employment Cost Index, Q4 (1.1% expected, 1.2% prior)
- 9:00 a.m. ET: FHFA Housing Pricing Index, November (-0.5% expected, 0.0% prior)
- 9:00 a.m. ET: S&P CoreLogic Case-Shiller 20-City Composite, MoM, November (-0.65% expected, -0.52% prior)
- 9:00 a.m. ET: S&P CoreLogic Case-Shiller 20-City Composite, YoYr, November (6.70% expected, 8.64% prior)
- 9:00 a.m. ET: S&P CoreLogic Case-Shiller U.S. National Home Price Index, November (9.24% prior)
- 9:45 a.m. ET: MNI Chicago PMI, January (45.1 expected, 44.9 prior)
- 10:00 a.m. ET: Conference Board Consumer Confidence, January (109.0 expected, 108.3 prior)
- 10:00 a.m. ET: Conference Board Present Situation, January (147.2 prior)
- 10:00 a.m. ET: Conference Board Expectations, January (82.4 prior)
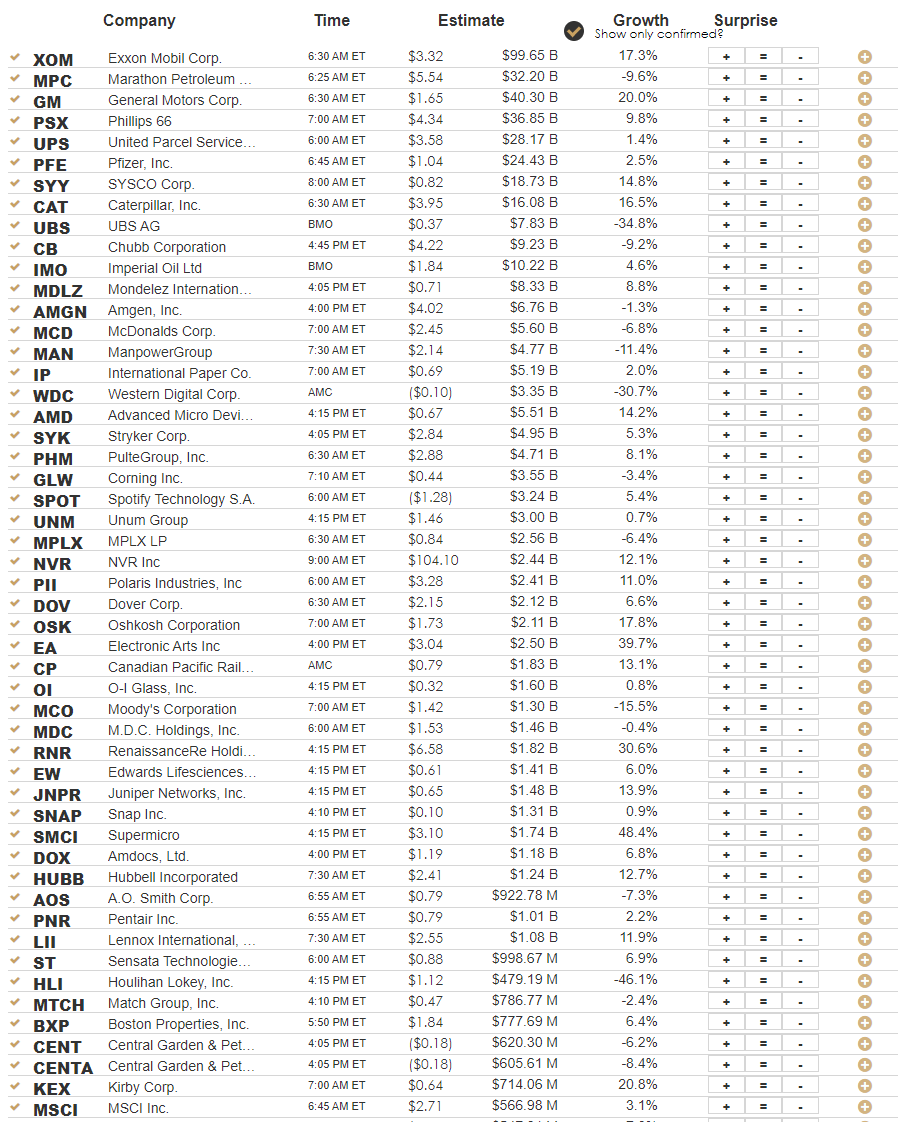
Earnings
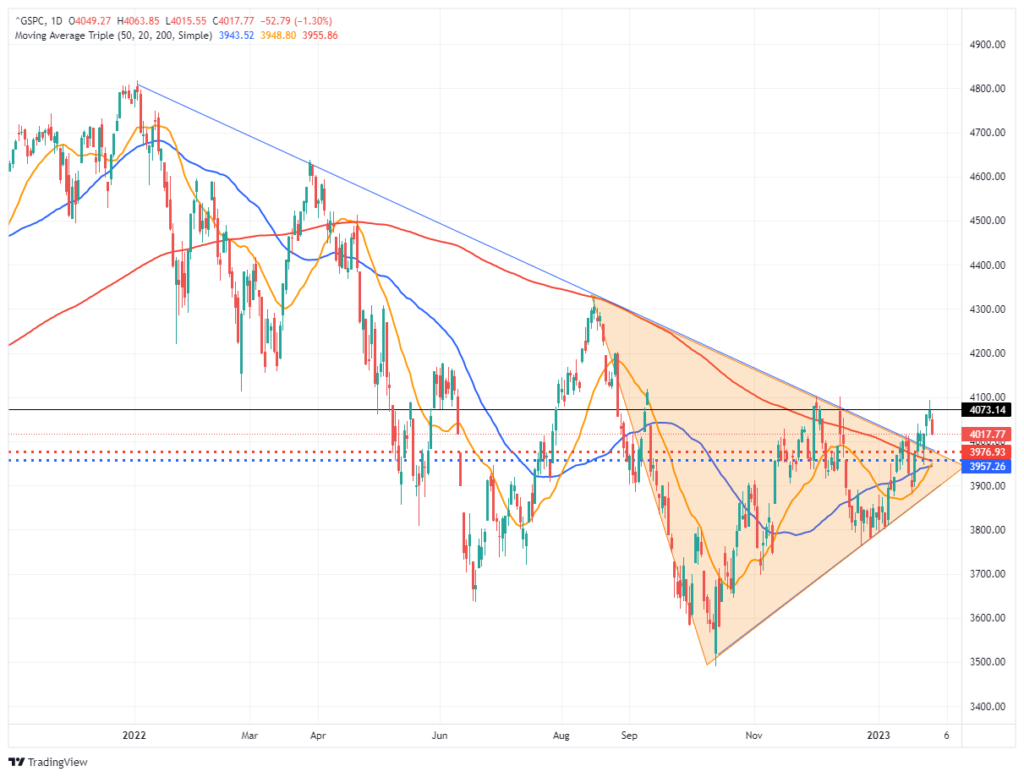
Market Trading Update
Yesterday morning, we took some exposure off the table early ahead of the Fed announcement on Wednesday. As stated previously, we expect a fairly hawkish statement from Jerome Powell, which could lower stock prices soon. However, a pullback would not be bad if the breakout levels that previously provided resistance are turned into support. Those levels are, as shown, the downtrend line from the January 2022 peak, the 200-DMA, and the 50- and 20-DMA convergence. That cluster of support is critical for the bullish rally to continue. A failure at these levels will lead to a retest of the December lows.
There is a lot of potential support in the 3975 area, but for the breakout to be confirmed, the market will need to break above the recent highs at 4071. If such occurs, technically, a new bull market will be in process. However, there is a lot of risk in the market currently, so we reduced our exposure for now.
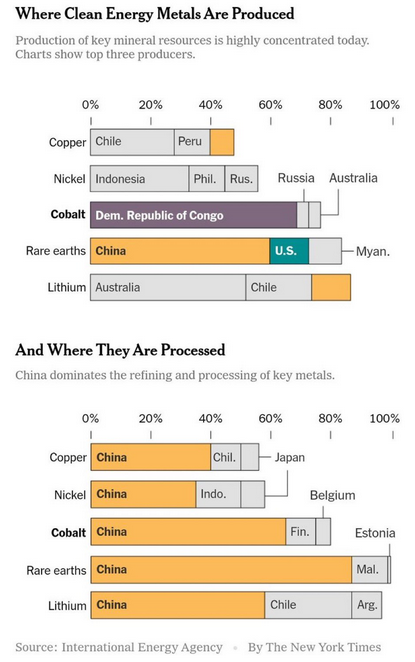
EV Challenges
EV market share for new vehicles is likely to reach 40% by 2030, per S&P Global. If such inroads into the auto market are made, the United States may have to rethink its relations with China and other countries. Almost all of the metals used in EV production are not from the U.S. More concerning, China is the leading processor of EV metals. The more we isolate ourselves from China, the more we must process or find another friendly nation to process for us. Such will be a big political challenge if U.S. automakers are to lead the world in EV production.
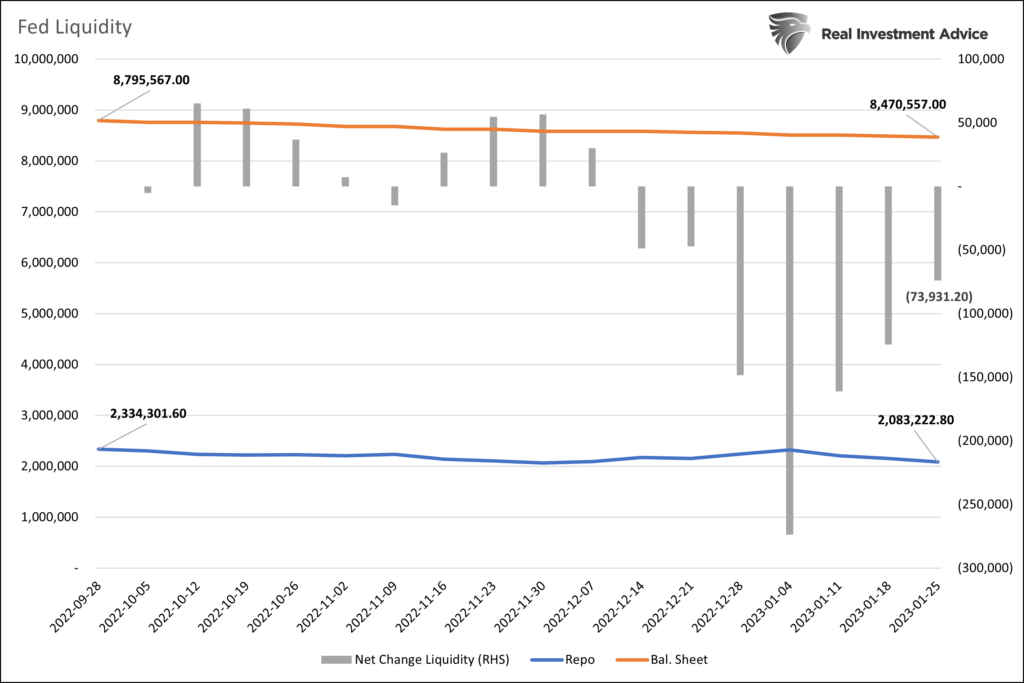
Managing QT
Over the last four months, the Fed has reduced its balance sheet by $350 billion. Typically such a change would weigh on the financial markets. This time, it appears the Fed is trying to blunt the effect of QT. In our article, S&P 3500, we share a model that tracks the three sources of financial market liquidity the Fed controls. Per the article:
With an understanding of the three key factors driving banking system liquidity, we can create a Fed liquidity model. The size of the Fed’s assets less the sum of the TGA and RRP equals the amount of Fed-generated liquidity in the system. Recent changes in net liquidity shed light on how the S&P 500 trends.
The Fed controls its balance sheet and the reverse repurchase program (RRP). As the usage of the RRP program declines, liquidity re-enters the system. Conversely, liquidity is taken from the system as the Fed reduces its balance sheet. Therefore the Fed can better manage liquidity with RRP despite doing QT. The graph below shows that since the end of the third quarter of 2022, net liquidity has only fallen by $74 billion, despite $350 billion of QT. RRP may allow the Fed to reduce its balance sheet with less financial market harm than in the past.

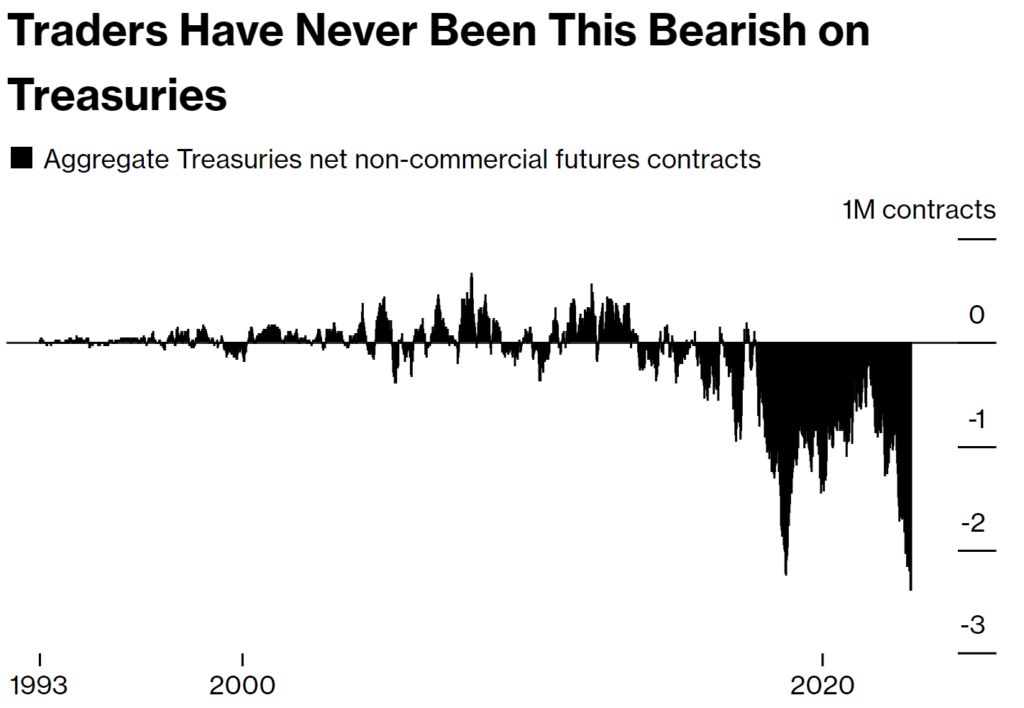
Hedge Funds are Bearish on Bonds
Per the latest round of CFTC data, hedge funds and other institutional speculators are holding a net record number of short positions on U.S. Treasury bonds. By default, banks on the other side of the trade currently hold a record number of long bond futures positions. The prior record was set in mid to late 2018. TLT bottomed on October 3, 2018, at 103.16. By the end of 2019, before the pandemic struck, it was trading at 135.90. Weaker economic activity, accompanied by the Fed cutting rates by .75% in 2019 and short covering by speculative traders, fueled the rally.
Further supporting a bullish outlook is the following interview with Stephen Roach from Bloomberg:
“Historical data for US bond market returns tells us that the best time to buy bonds is on the penultimate hike:” HSBC’s Steven Major. Recent bond moves suggest the penultimate Fed rate hike is close. “History suggests this is an important moment.”
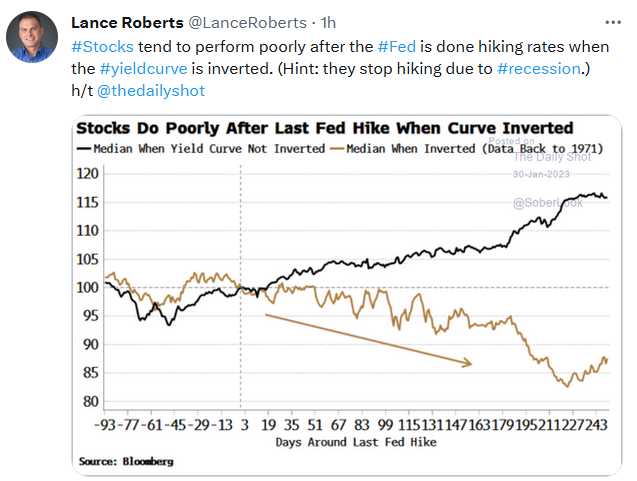
Tweet of the Day
Please subscribe to the daily commentary to receive these updates every morning before the opening bell.
If you found this blog useful, please send it to someone else, share it on social media, or contact us to set up a meeting.

