


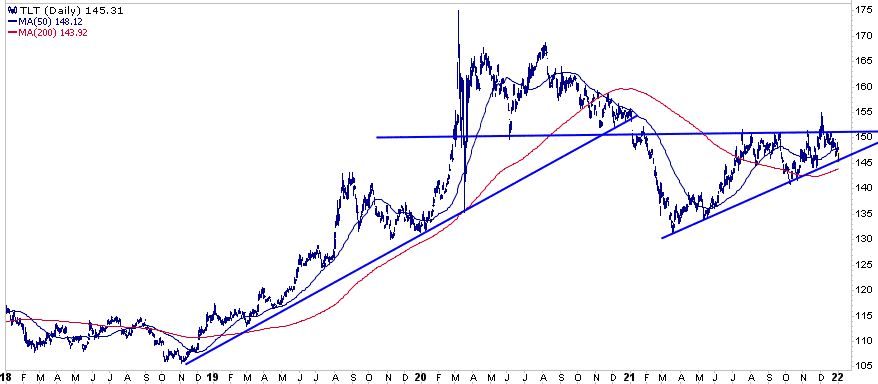
Bonds struggled Monday following a couple of solid days to close out 2021. Ten-Year UST yields rose 14 bps to 1.64%. We caution reading too much into yesterday’s price action as window dressing before the new year often results in reversal trades after the new year. That said, the technical outlook for bonds shows it may be on the precipice of a significant move. TLT is now sitting on a critical support trend line. Breaking below that line and the 200dma (red) may likely signal bonds may struggle ahead. That said, the line has proven to be good support and may once again offer a buying opportunity. If so, a sustainable break above the horizontal blue might result in a run to new highs. As we watch bonds struggle, realize the wedge pattern is shrinking, likely signaling a big move is coming.

What To Watch Today
Economy
- 10:00 a.m. ET: ISM Manufacturing, December (60.0 expected, 61.1) prior month)
- 10:00 a.m. ET: ISM Prices Paid, December (79.3 expected, 82.4 prior month)
- 10:00 a.m. ET: ISM New Orders, December (60.4 expected, 61.5 prior month)
- 10:00 a.m. ET: JOLTS job openings, November (11.1 million expected, 11.033 million prior month)
- WARDS Total Vehicle Sales, December (13.1 million expected, 12.86 million prior month)
Earnings
- MillerKnoll (MLKN) to report earnings of $0.56 on revenue of $1.043 billion
2022 Investor Resolutions
Here are my annual resolutions for the coming year to be a better investor/portfolio manager:
I will:
- do more of what is working and less of what isn’t.
- remember that the “Trend Is My Friend.”
- be either bullish or bearish, but not “piggish.” (Pigs get slaughtered)
- remember it is “Okay” to pay taxes.
- maximize profits by staging my buys, working my orders and getting the best price.
- look to buy damaged opportunities, not damaged investments.
- diversify to control my risk.
- control my risk by always having pre-determined sell levels and stop-losses.
- do my homework. I will do my homework. I will do my homework.
- not allow panic to influence my buy/sell decisions.
- remember that “cash” is for winners.
- expect, but not fear, corrections.
- expect to be wrong and I will correct errors quickly.
- check “hope” at the door.
- be flexible.
- have the patience to allow my discipline and strategy to work.
- turn off the television, put down the newspaper, and focus on my own analysis.
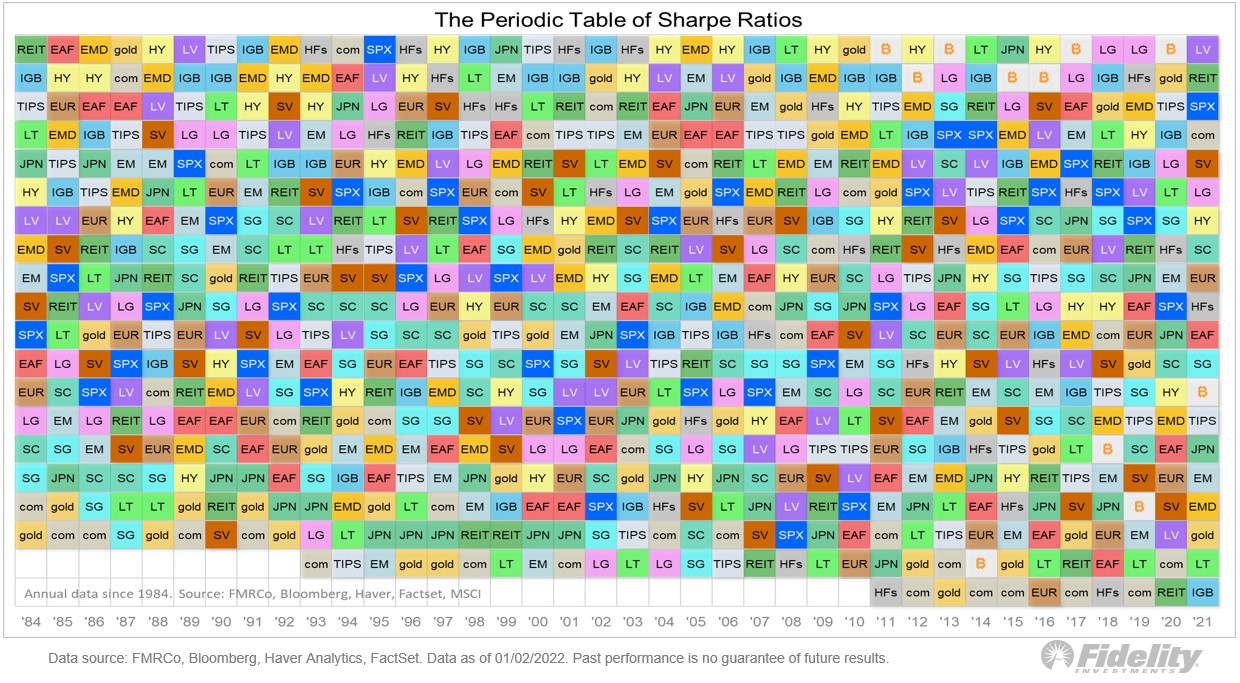
Large Cap Value (LV) Is the Winner Last Year
The Fidelity table below ranks asset classes by their Sharpe ratios. The Sharpe ratio measures the return of an asset per unit of risk. If you notice, the boxes tend to shift year to year. As we discuss in our upcoming outlooks for the new year, look forward and not in the rearview mirror for those assets that may outperform.
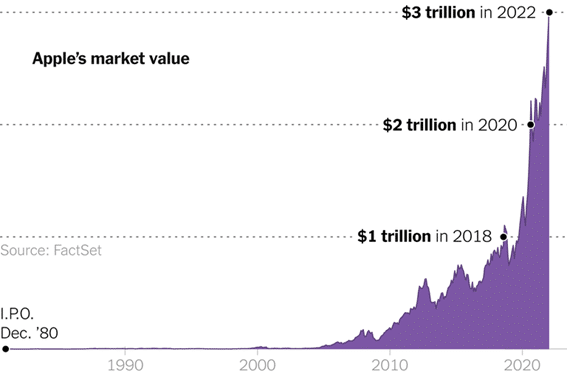
Apple Is The First $3 Trillion Company
While bonds struggled yesterday, Apple briefly hit a market cap of $3 trillion during intraday trading on Monday. The milestone is mostly symbolic but it shows investors remain bullish on Apple stock and its ability to grow. At a market value of $3 trillion, Apple tripled its valuation in under four years. Yet, this is a fully mature company that has grown sales at just 11% annualized over the last decade. Is Apple really worth $3 Trillion or is it just another sign of an extremely overvalued market.
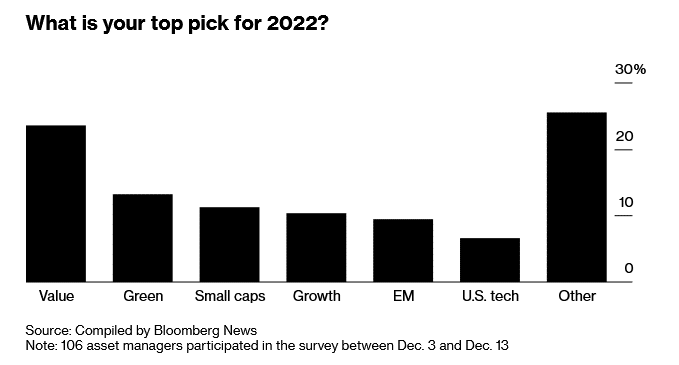
Is 2022 Finally The Time for Value To Shine?
Bloomberg surveyed 106 asset managers to see what type of stocks are likely to do best in 2022. Value took the cake accounting for the top choice for about 25% of those surveyed. Growth which led the way last year and has grossly outperformed value over the previous five years, is in fourth place with about 10% of the votes. Over the last month, we have seen value stocks lead the S&P 500 higher, with utilities, healthcare, real estate, and staples outperforming every other sector.
Fact of the Day
Since 1950, when the S&P 500 has risen in the first full week of the year, it’s had an 87% success rate of gaining for the full calendar year. -@callieabost
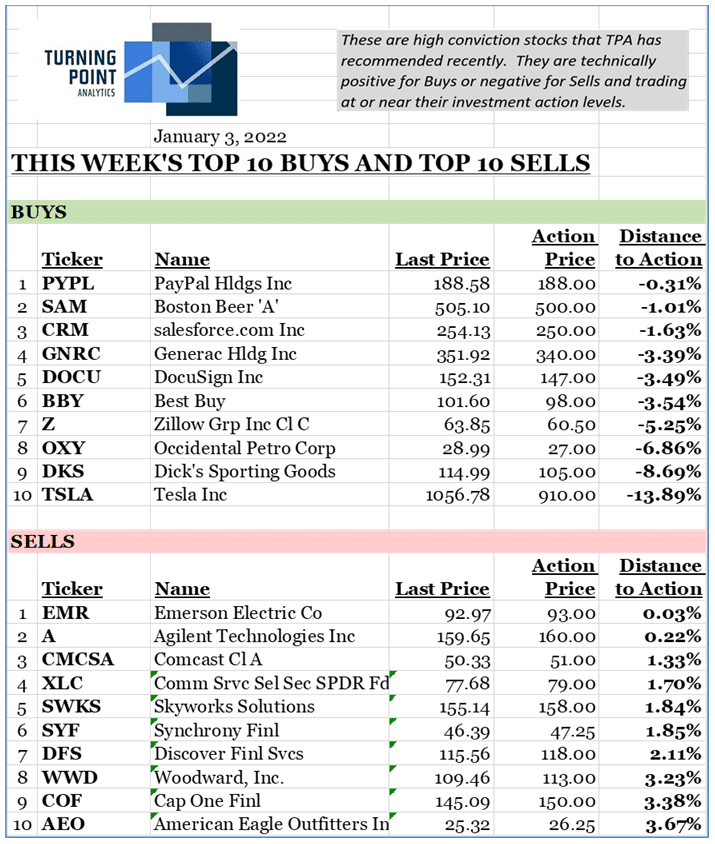
Top 10 Buys & Sells From TPA Research
Click on RIAPro+ today to add TPA Research to your subscription for just $20/month.
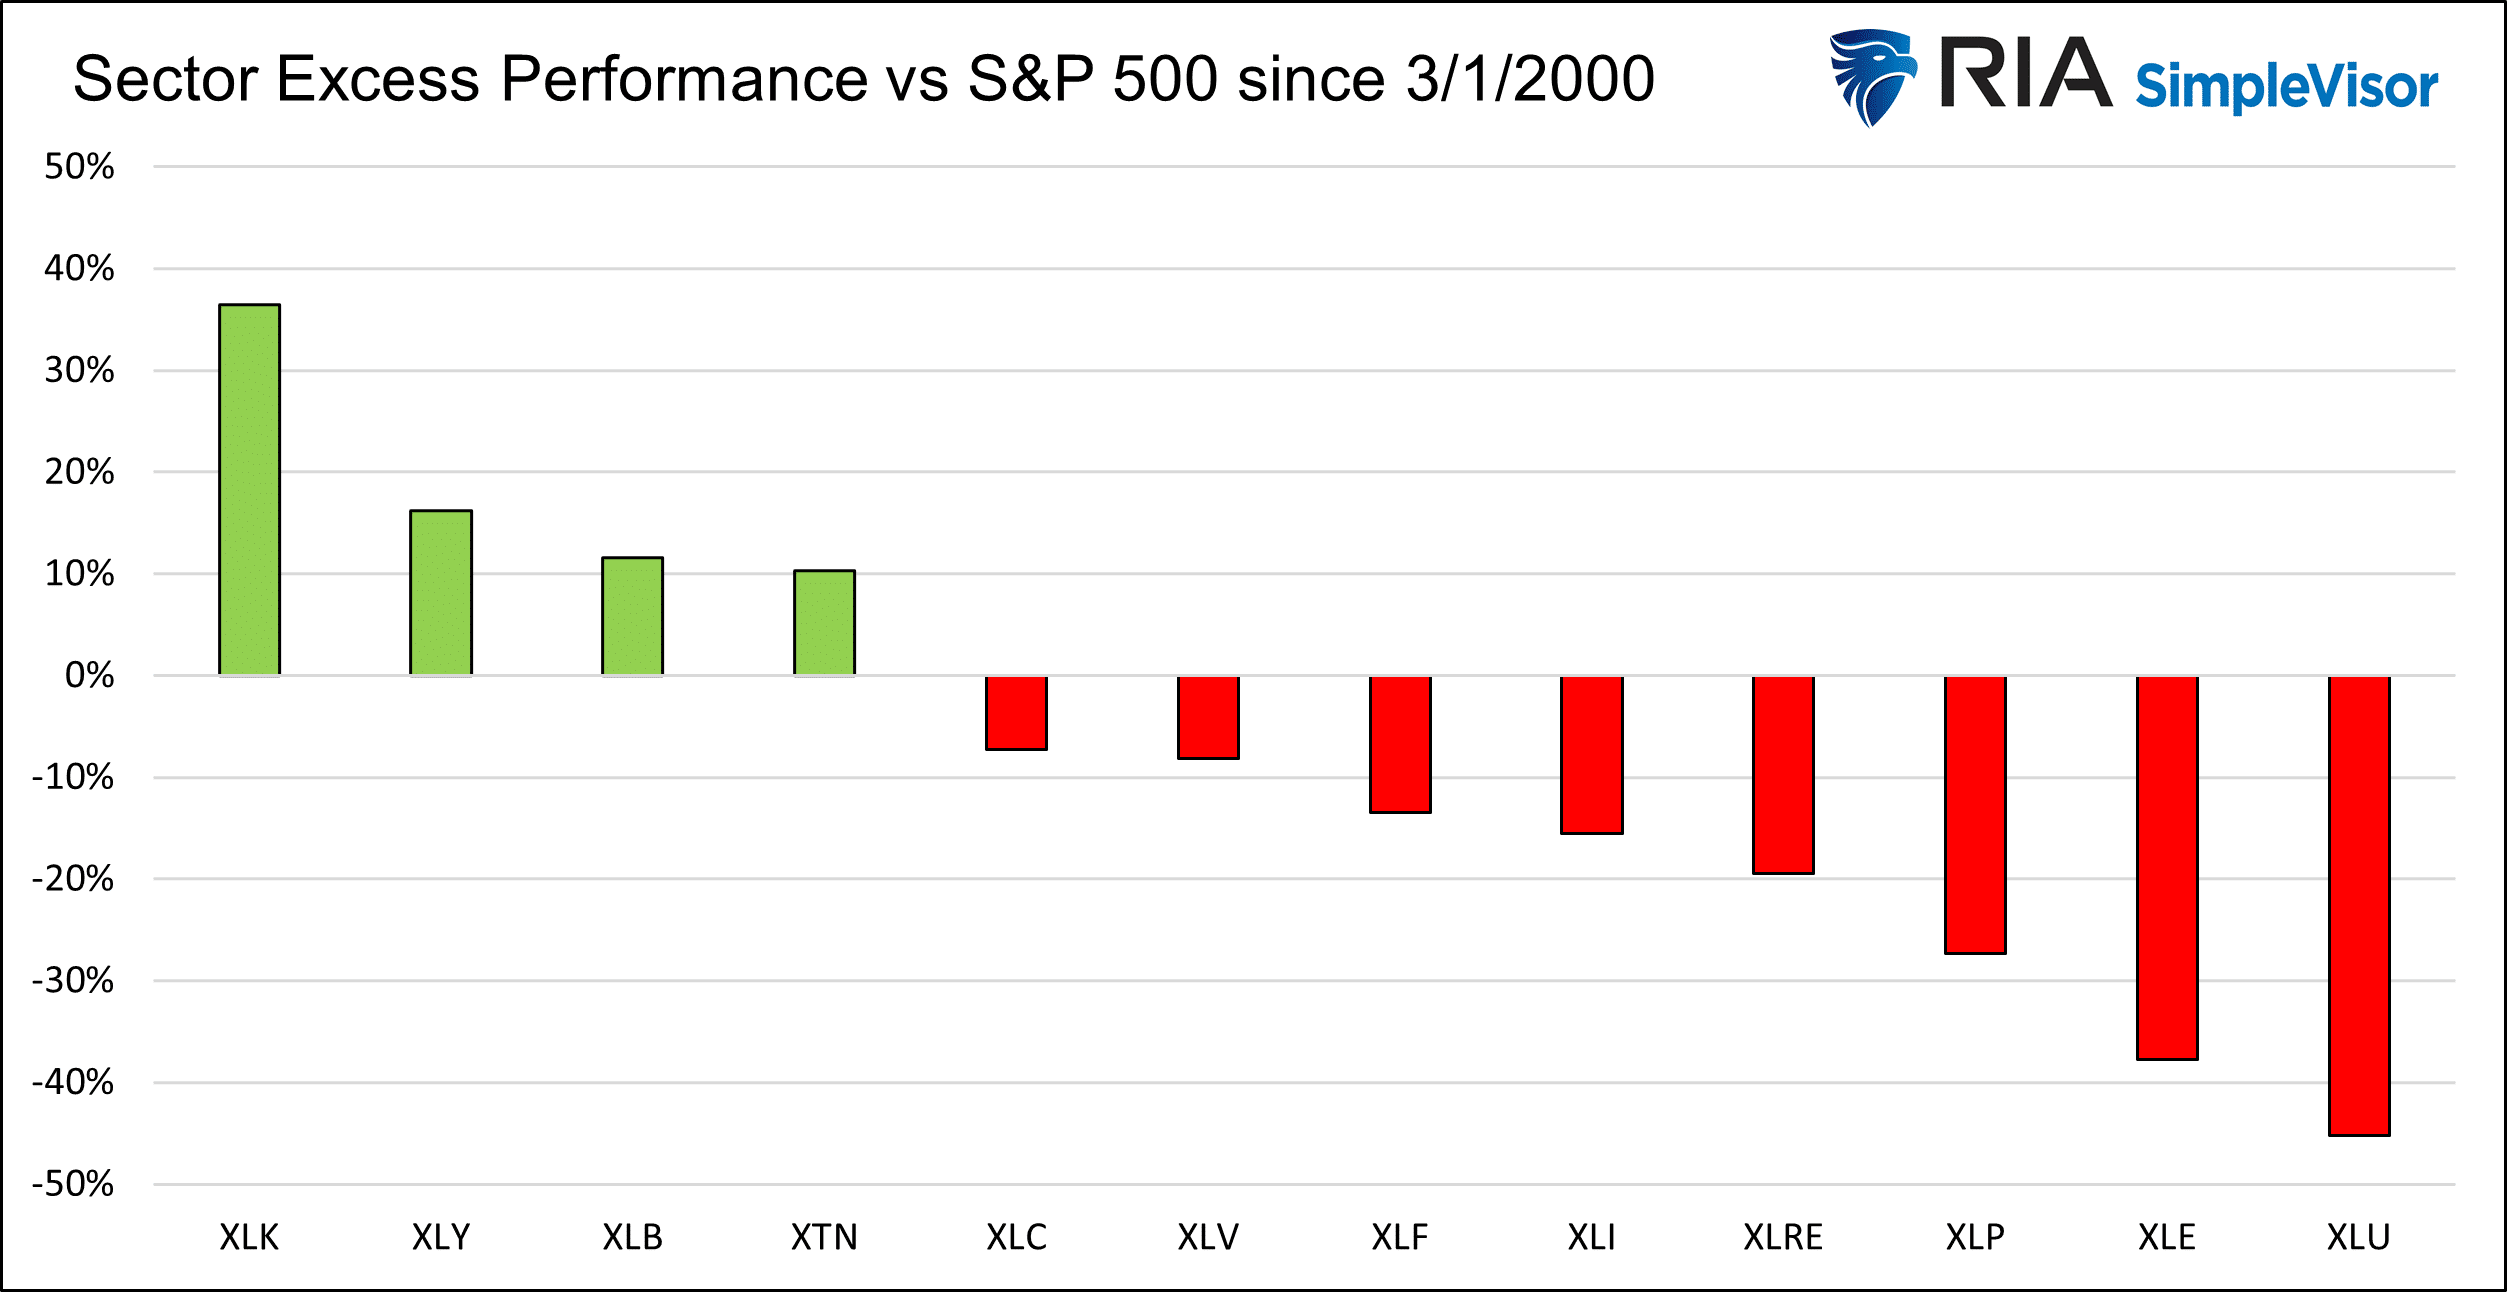
Sector Performance Since the Pandemic
The bar chart below plots the relative performance of each S&P 500 sector versus the S&P 500. In addition to spotting the winners and losers of the last two years, it also may also provide insight into which sectors may benefit from economic and monetary policy normalization. Of interest, utilities have given up nearly 50% versus the S&P 500 since the pandemic started. XLU is up 15% compared to 60% for the S&P 500. On the other side, the technology sector is beating the S&P 500 by over 35%.
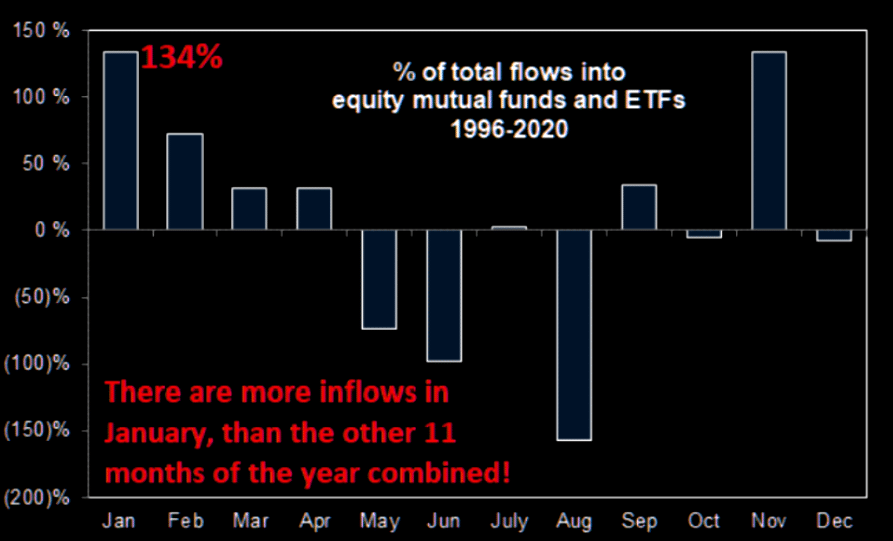
May the Santa Rally Linger?
The following graph and commentary from David Robertson provide insight into a bullish factor that may drive returns in January.
“The following graph, posted by themarketear.com on Dec 27, 2021, illustrates the seasonal effect of money flows. Obviously January is a big one and that makes sense since year-end bonuses can be slogged away and annual limits for retirement programs are reset. These are valid reasons to expect above average flows of cash to enter the stock market – and therefore for the bias on stocks to be upward, all else being equal. By the same token, look out for the period of May through August.“
Please subscribe to the daily commentary to receive these updates every morning before the opening bell.
Also Read


