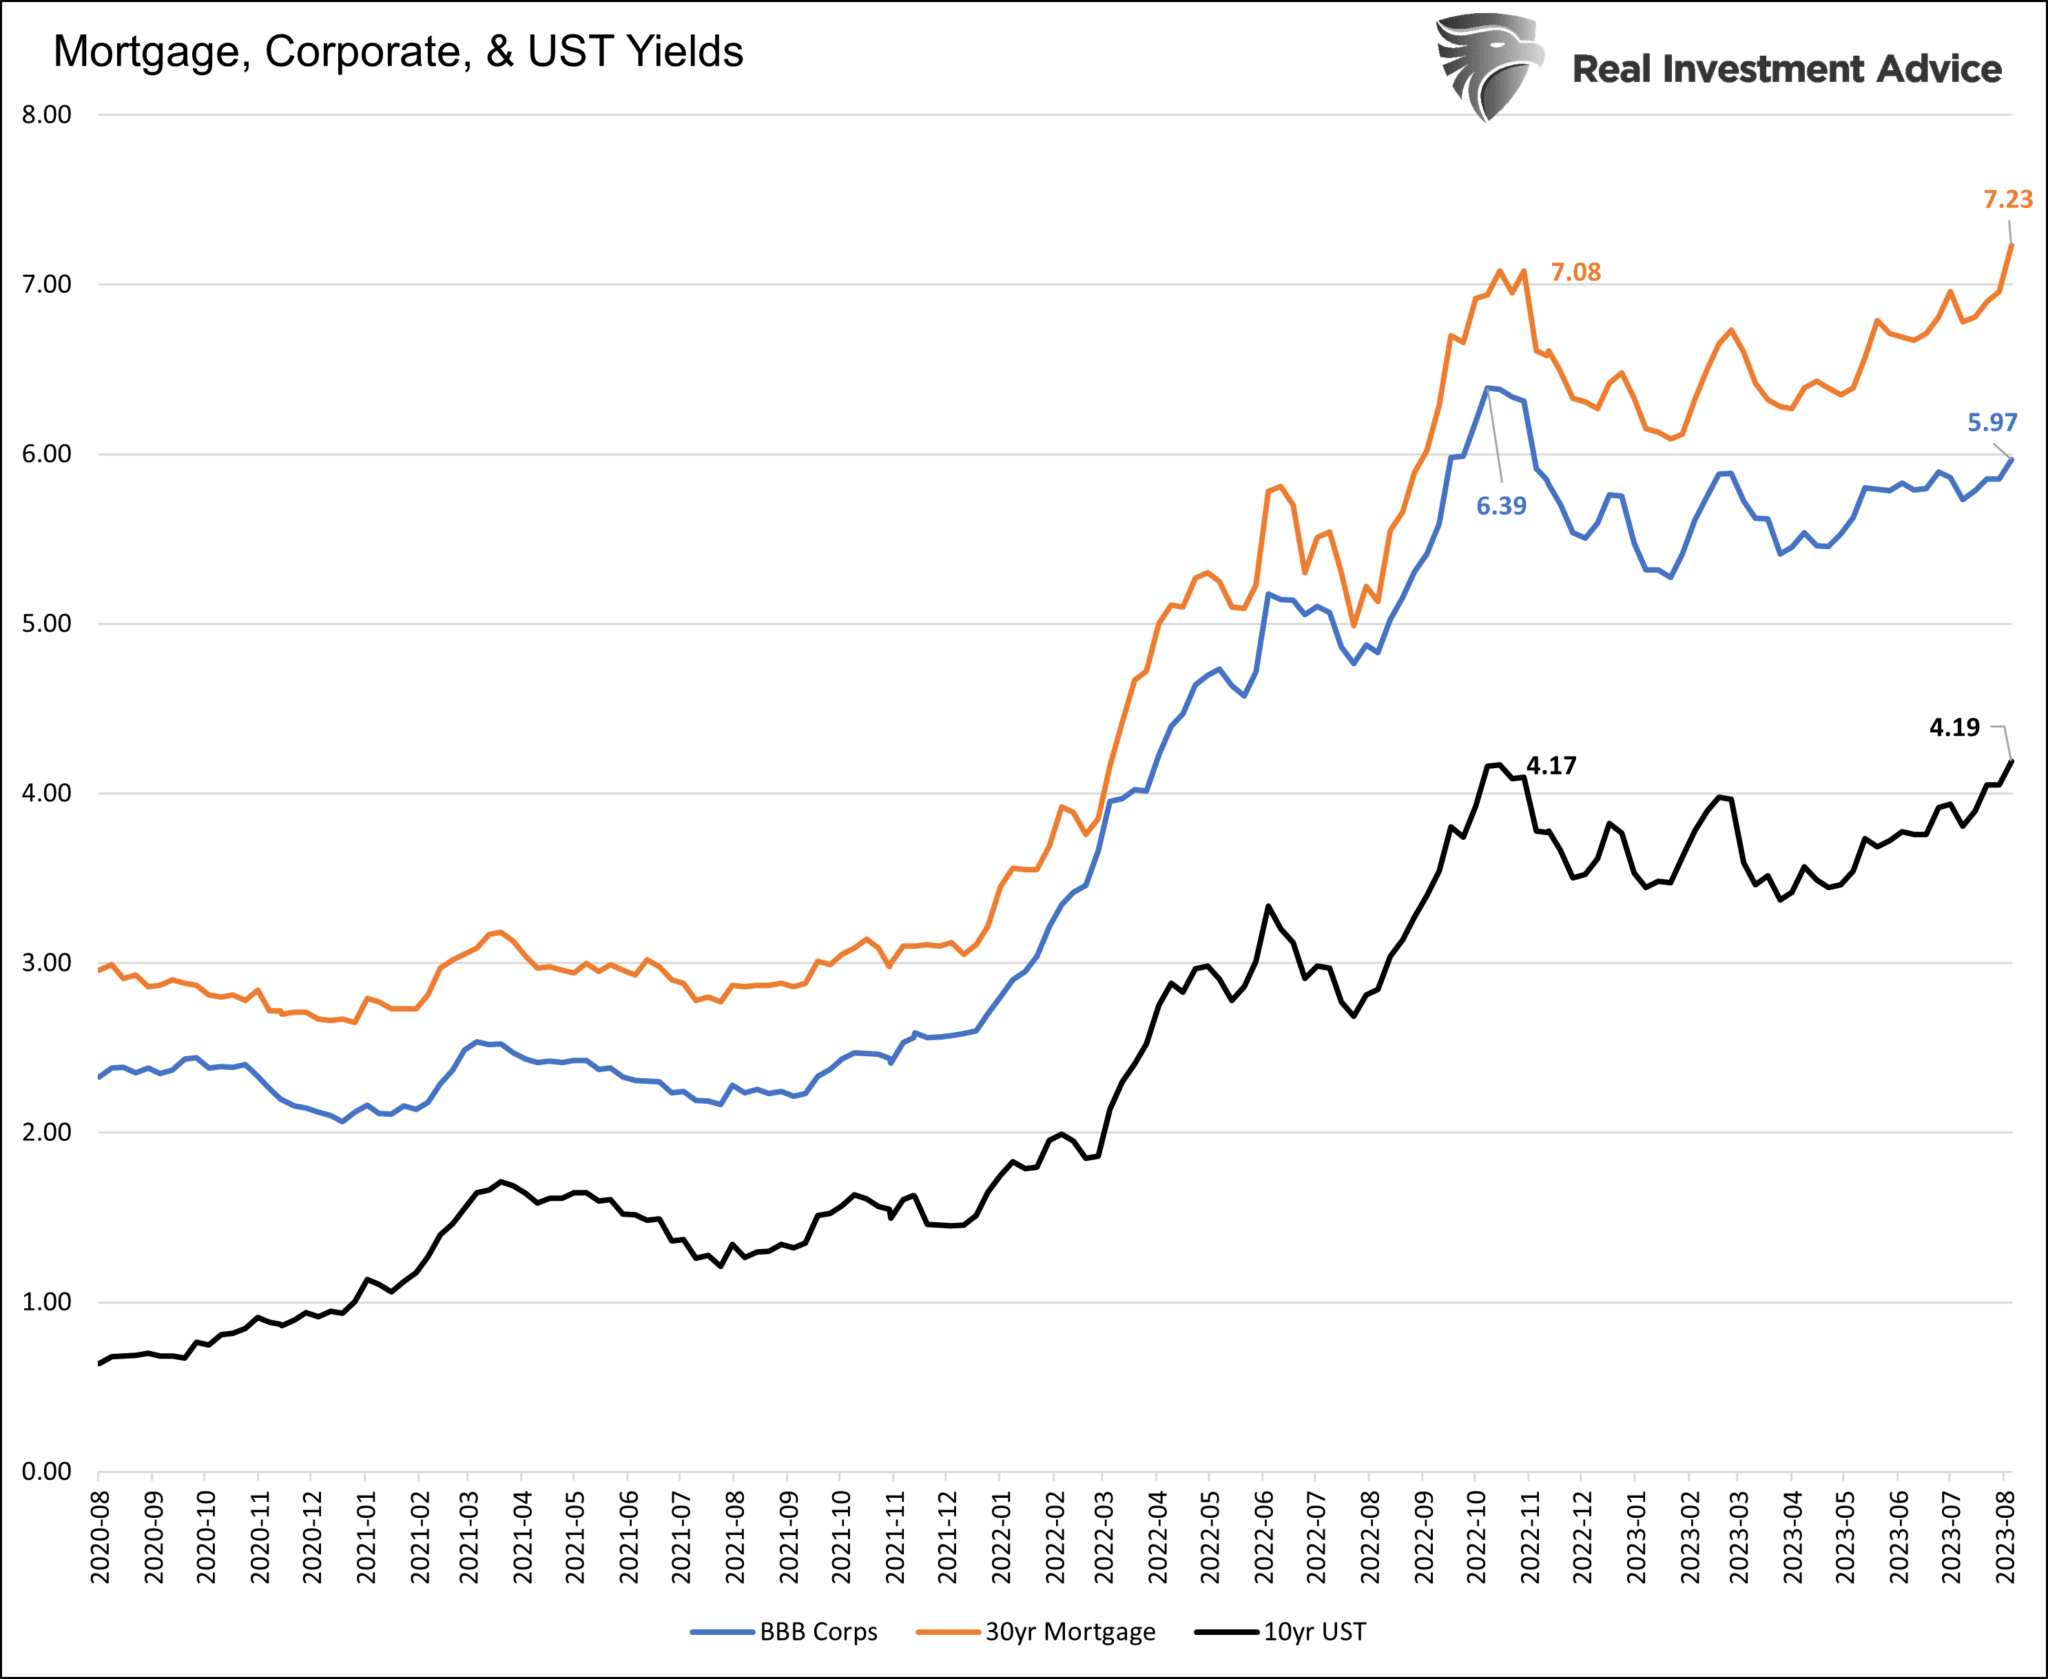
Monday’s Daily Commentary highlighted four factors that could lead to a credit crunch in the mortgage market. The graph below shows a credit crunch for mortgages may have already begun. The bellwether 10-year U.S. Treasury note yields 4.19%, almost identical to its peak in the fall of 2022. Yet, mortgages are trading .15% above the 2022 highs. The combination of an inverted yield curve, fleeting deposits, and unrealized losses is causing banks to retrench and reduce lending. A mortgage credit crunch can be damaging, but should we also consider a corporate credit crunch might be in the making?
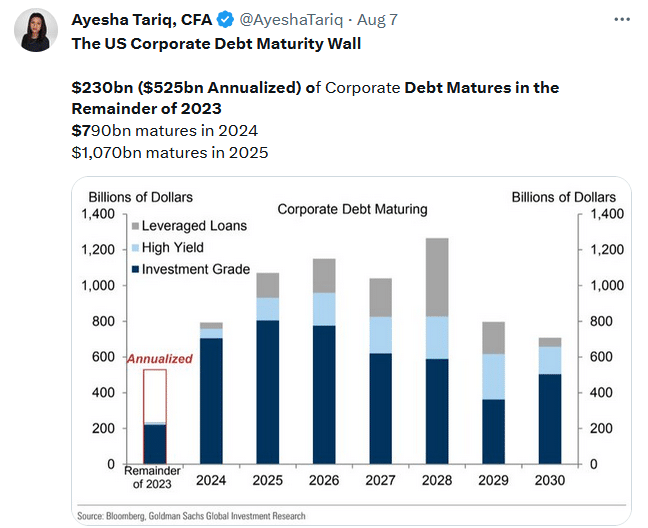
Despite ten-year UST yields returning to their high water mark, investment grade-BBB corporate bonds are still .42% below their peak. Unlike the mortgage market, corporate borrowers can borrow directly from the capital markets. As such, they are not beholden to banks. Investors’ demand for corporate debt remains robust as the no- or soft-landing scenario economic consensus is conducive to low credit risk. Further, the supply of corporate bonds has been light this year as many corporations took advantage of the low-interest rates in 2020 and 2021. However, the Tweet of the Day below does raise a concern. The amount of corporate debt maturing will rise sharply in the coming years. If interest rates remain high, a corporate credit crunch is a possibility. But for now, the market for new corporate debt seems healthy, as witnessed by very low spreads between corporate and U.S. Treasury bonds.
What To Watch Today
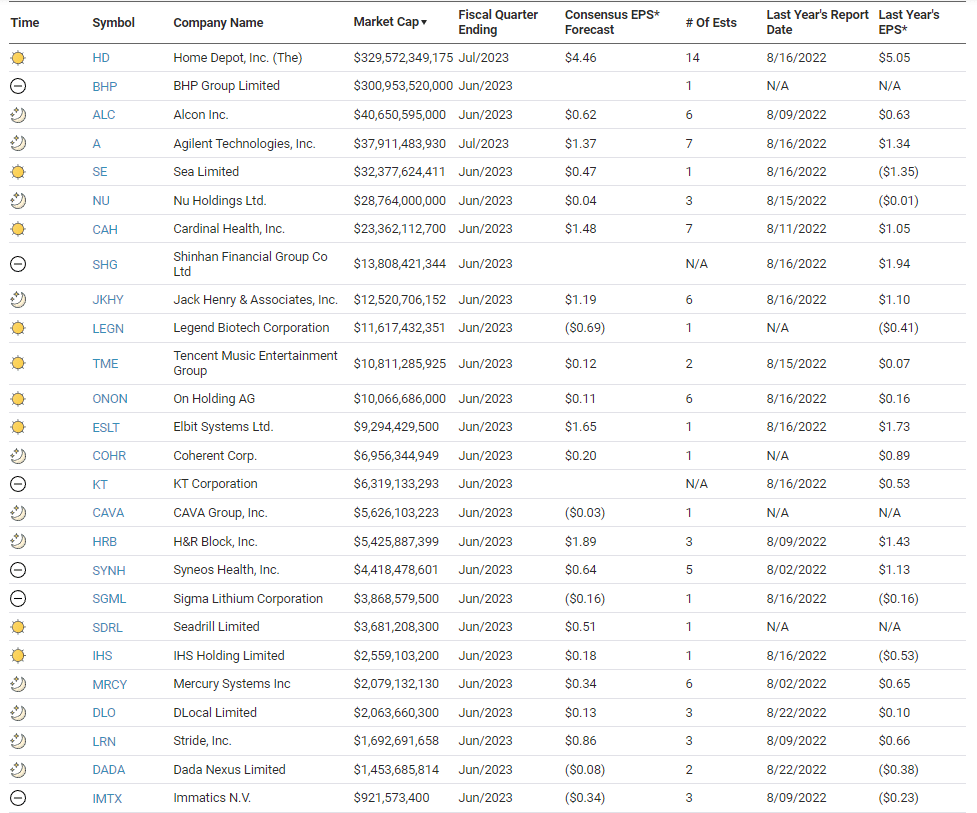
Earnings
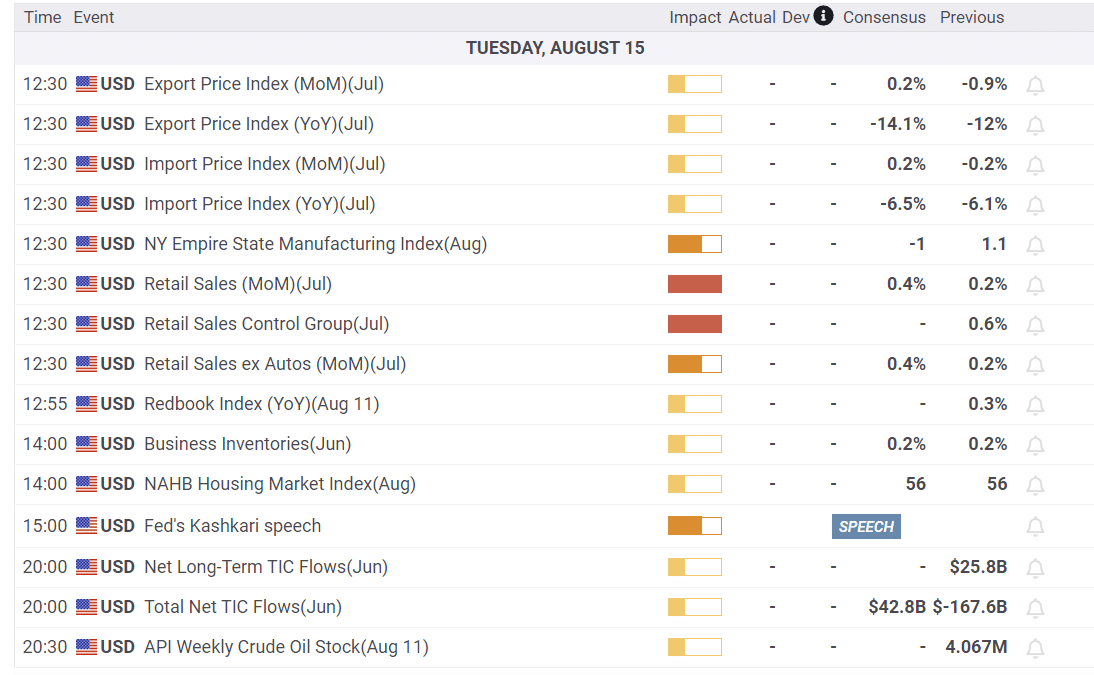
Economy
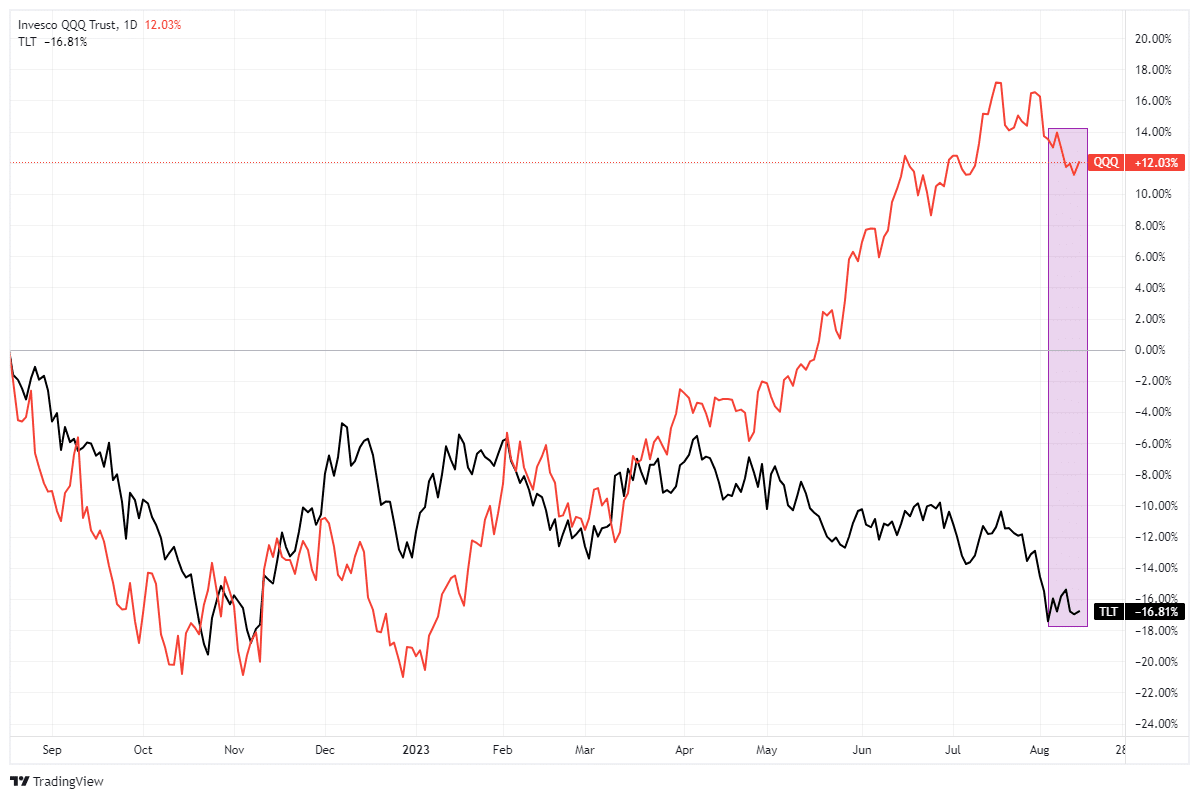
Market Trading Update
We discussed the deviation between long-duration assets (Technology stocks) and interest rates some months ago. That gap has continued to widen to one of the largest we have seen. In a heavily indebted economy, low-interest rate levels are required to finance new spending (including share buybacks) and refinance maturing debt. Furthermore, given that high-growth companies, like Technology stocks, depend on revenue growth to support valuations, high-interest rate environments put that growth at risk.
While interest rates remain at high levels, the consumption drag becomes problematic as excess liquidity levels are drained from household savings accounts. While there seems to be no concern about a recession, or even a rather sharp slowdown in economic activity, it only seems logical that, at some point, that gap will close. As we discuss in today’s blog, this is just another reason why I personally increased my bond holdings recently.

Are CTA’s Too Bullish?
The FT shares the following commentary and graph below, which warn that high equity allocations of Commodity Trading Advisors (CTA’s) may be bearish. Per the FT:
‘Commodity trading advisers — hedge funds that rely on pattern-detecting algorithms and statistical models to direct trading across markets — have in recent weeks increased their exposure to equities to the highest level since before the pandemic.
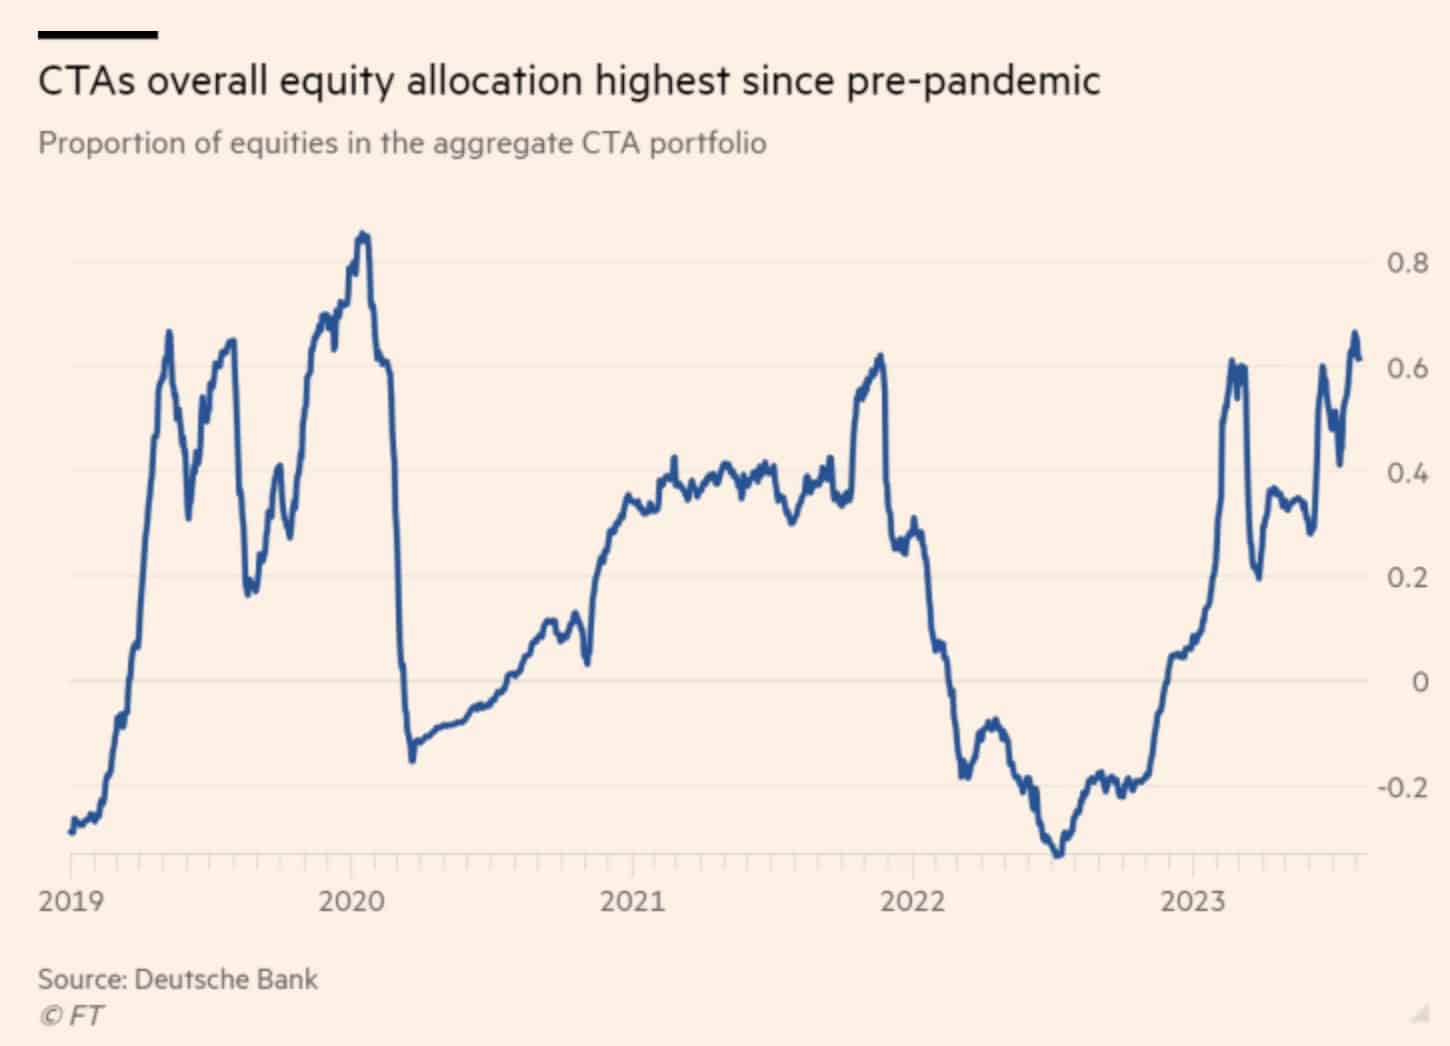
Quite often, when investors are in agreement about the market direction, they are wrong. As Bob Farrell says: “When all the experts and forecasts agree – something else is going to happen.“
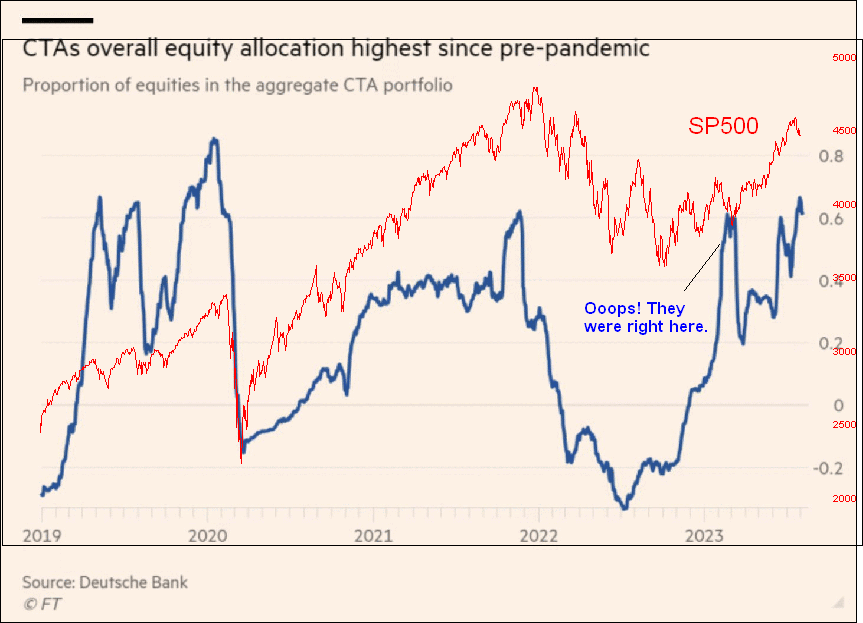
The graph below compares the one above to the S&P 500. The takeaway is that sometimes when the CTA’s, aka experts, are in agreement, they are correct. Such an instance in early 2023 is highlighted. However, in late 2019 and 2021, they were clearly in agreement and grossly offside.
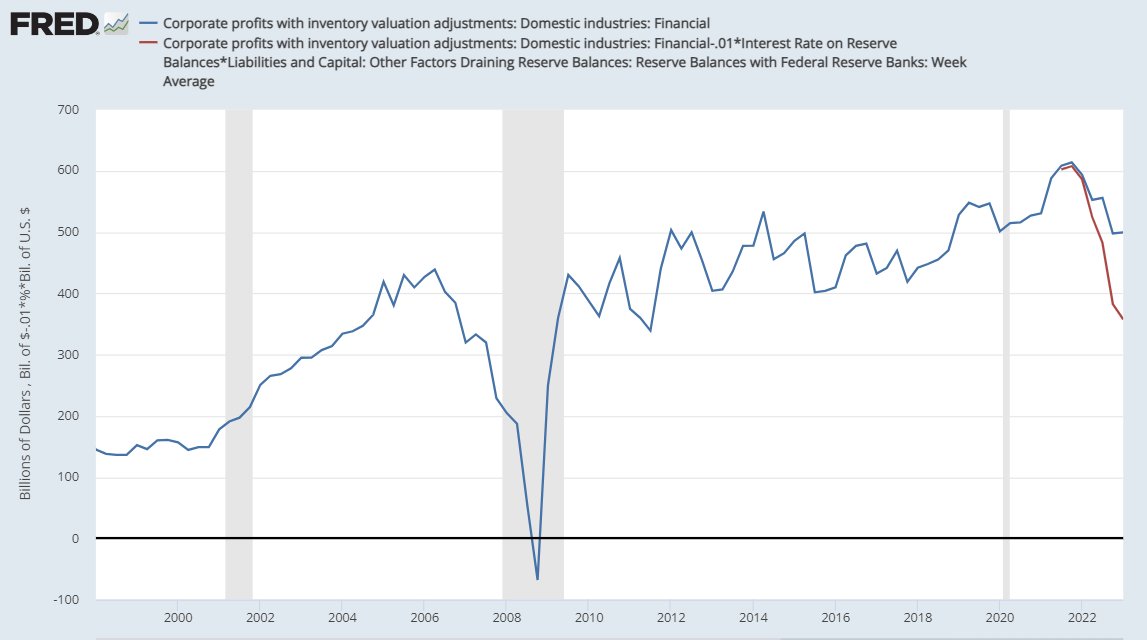
The Fed Boosts Bank Profits
The graph below, courtesy of John Hussman, shows what the profits of U.S. financial corporations look like with and without IOER. IOER is the interest the Fed pays to banks on excess reserves. Excess reserves are the reserves or methods of payment by the Fed when they do QE and buy bonds. The Fed pays banks the IOER rate to encourage them not to lend the reserves, which would boost the money supply and inflation. That current IOER is 5.40%, which is slightly higher than the overnight alternative for banks, the Fed Funds rate. The graph shows that the financial sector is benefiting by $150 billion. Without the excess reserves and the IOER, bank profits would be at 10-year lows!
Tweet of the Day
Please subscribe to the daily commentary to receive these updates every morning before the opening bell.
If you found this blog useful, please send it to someone else, share it on social media, or contact us to set up a meeting.

